1
Microanalytic Coding Versus Global Rating of Maternal Parenting Behaviour
Alina Morawska*1, Allison Stalling1, Michelle Adamson2, Leanne Winter1 1
Parenting and Family Support Centre, School of Psychology, The University of Queensland, Brisbane, Australia
2
Department of Psychology, University of Southern Queensland, Hervey Bay, Australia
Running head: Observational coding of parenting
*Corresponding author
Parenting and Family Support Centre School of Psychology
University of Queensland Brisbane 4072
2 Abstract
This study examined the relationship between microanalytic coding and global rating systems when coding maternal parenting behaviour in two contexts. Observational data from 55 mother-child interactions with 2-4 year old children, in either a mealtime (clinic; N=20 or control; N=20), or a playtime context (community; N=15), was coded via both microanalytic and global systems. Results from the microanalytic coding and global rating demonstrated similar results, with both scales showing adequate psychometric properties. No difference was found in the sensitivity of the two systems in the control sample, however the global method demonstrated more sensitivity in measuring behaviour in the playtime context. This finding may indicate that global ratings are more sensitive in a population with high base rates of positivity or in a playtime context. This study highlights the incongruence of different measurement methods and emphasises the importance of considering coding methodology for different types of populations.
3
4
account the context as aptly as global ratings (Alexander et al., 1995), and therefore may not be able to describe whole relationships independently from the moment-to-moment observed behaviours (Carlson et al., 1987). For example, interval based coding (e.g., Sanders, 2000) does not lend itself well to sequential or dyadic analyses, although frequency based codes can allow this type of analysis (e.g., Eyberg et al., 2004).
5
of occurrence and the parent may refrain from using spanking in an observational context. In contrast, a coder using a global coding system may be able to pick up cues in the parent’s behaviour which indicate negativity, despite the fact that the parent refrains from spanking the child in the presence of the observer. Such negativity may be difficult to define and code using a microanalytic code as it can involve subtle cues including changes in affect.
6
A further consideration is the correspondence between observational and self-report data. Research has generally demonstrated modest correlations between observations of child-rearing practices and mothers’ self-report for both microanalytic (Kochanska et al., 1989; Sanders et al., 2007; Sharry et al., 2005) and global rating systems in the expected directions (Hill et al., 2008; Weis et al., 2002).
Several limitations of the current literature in the area of observational methodology are apparent. Specifically, research has not directly assessed the effect that the sampling population has on the results of observational coding. This is an important area which needs to be examined given increasing focus on programs aimed at assisting parents at a population level (Sanders, 2012). An understanding of how base rates affect observational coding is also important for practitioners working with parents who are experiencing difficulties with their child's behaviour which are not at a clinical level but are still considered problematic. To our knowledge, very little research has directly examined whether global and microanalytic codes are comparable, or whether they generalise across contexts and populations.
Aims and Hypotheses
7
The second aim of the study was to determine whether one system was more appropriate in detecting behaviour when there were low base rates of aversive parenting behaviour, given increasing focus on non-clinical samples. We predicted that parents who were concerned and seeking help for their child's feeding (clinical) would have lower base rates of non-aversive (i.e. positive parenting) behaviour compared to parents who were not concerned (control) about their child's feeding (H2a). This was assumed because parents experiencing more difficulties with their child are more likely to use aversive strategies or to interact less with their child. We hypothesised, that parents who were not concerned about their child's behaviour would show more variability in scores when using a global rating versus microanalytic coding (H2b). Lastly we hypothesised that global ratings would show more variability in parental behaviour scores when compared to microanalytic coding in a playtime context (H2c). Finally, we aimed to determine the relationship between microanalytic coding and global ratings and self-report data. We predicted that scores indicating effective parenting on both systems would be positively related to scores indicating effective parenting on the self-report measure (H3).
Method
The data used for the present study were obtained from two larger projects (Adamson et al., 2012; Winter et al., 2012), by drawing a random sub-sample from each project.
Participants
8
and 54 of the 55 participants reported their ethnicity as white. Participants’ children were aged between one and four years with a mean of 2.40 (SD = .85). There were 33 boys and 22 girls (60% and 40%, respectively). Table 1 displays demographic data for the three groups, as well as between sample comparisons. No significant between sample differences were found on any of the demographic variables examined. Income measures from the mealtime and playtime study were not comparable and hence between sample comparisons were not calculated.
Measures
Demographic information included items which covered child age and gender, participant's marital status, ethnicity, education, employment, and income.
The Parenting Scale (PS; Arnold et al., 1993) is a 30-item questionnaire measuring three
dysfunctional discipline styles: laxness (permissive discipline), overreactivity (authoritarian discipline, displays of anger), and verbosity (overly long reprimands or reliance on talking). Each item has a more effective and a less effective anchor, and parents indicate on a 7-point scale, which end better represents their behaviour. In the current study, internal consistency was good for each subscale and the total score (α = .84, .82, .72 and .87 respectively). The scale has good test-retest reliability for the total score and each subscale (r = .84, r = .83, r = .82, r = .79, respectively) and has been found to distinguish between clinical and non-clinical populations.
Two different observational coding systems were used in this study: the Global Rating
Scale (GRS; Morawska et al., 2010) and the Family Observation Schedule (FOS; Sanders,
9
in children with behaviour problems (Sanders et al., 1985). The following dependent measure derived from the observation system was used in the current study: percentage of intervals of parent positive behaviour, which was normally distributed.
In this study the GRS was made up of four dimensions chosen on the basis of several theoretical and empirical considerations, including parenting behaviours identified in the research (e.g. permissiveness) as central to the development of child behaviour problems (e.g., Patterson, 1982), specific parenting strategies and behaviours targeted in behavioural family interventions (e.g., Sanders, 2008), and factors that would allow discrimination between families on key variables related to problematic family interactions. The four dimensions included: Permissiveness, Use of Positive Parenting Strategies, Appropriate Use of Strategies, and Parent-Child Interaction Quality. For each dimension, the parent was scored on a 9-point Likert scale anchored at each end with clear behavioural descriptions (e.g., The parent did not beg, coax, or plead with the child; Instructions to the child were largely vague, may have been too difficult for the child to accomplish or poorly timed), with lower scores indicating more optimal parenting on each of these dimensions after the observer viewed the observation once in its entirety. A total score was obtained by averaging across the four dimensions. The GRS had been previously piloted in a small sample in order to refine the scale. Estimates of internal consistency in the current study were high (α = .87). Data was coded by trained undergraduate psychology students. Approximately 20% of observations were coded by a second coder and substantive levels of inter-rater agreement were achieved for the FOS (mean κ = .61 for parent positive behaviour), and the GRS (mean intra-class correlation = .61) (Landis et al., 1977). Further details of dimensions of the GRS and their inter-rater reliability in the current study are reported in Table 3.
10
Participants for the mealtime observations were recruited via advertisements at on-line mothering forums, primary health physician surgeries, child-care centres, primary schools and play groups. These advertisements targeted parents who either had problems with their child’s feeding and wanted help for these problems, or parents who did not have problems with feeding and were not seeking help. Parents who responded to the advertisement were contacted by phone in order to determine their eligibility, and obtain informed consent. Participants were considered to be eligible if they were not currently accessing professional help for their child's behaviour/feeding difficulties, had no chronic medical conditions, and the child was between the age of 18 and 48 months. Parents completed the self-report measures and were thanked for their participation by either receiving a free mealtime intervention if they were concerned about and seeking assistance for feeding difficulties, as assessed during a screening interview (clinic), or being offered a movie/food voucher if they were not experiencing difficulties with their child's mealtime behaviour (control). Children in the clinic group were not diagnostically assessed, as we were not seeking a sample of children with DSM-IV or ICD-10 diagnoses of feeding disorders.
11
and ended either when the child left the table for the last time or the main meal was removed from the child. At the end of the observation parents indicated whether the meal was typical.
For the playtime observations (community), participants were recruited via advertisements in magazines, online through Facebook and various parenting forums, and via local school newsletters. Participants were directed to a website with information on the study where they could complete the self-report questionnaires, and consent to a home observation. Families who participated in the observations were given free movie tickets and parenting resources. Observations were conducted in the participant's home to ensure the behaviour was as natural as possible.The researcher set up the camera and then remained in the room for the duration of the 15 minute observation. Parents were given instructions on paper before the beginning of the session, as well as verbal prompts throughout the observation. The observation consisted of four segments: (1) 3 minute free play with their own toys; (2) 6 minute play with a researcher-provided game; (3) 2 minute pack up task, and; (4) 4 minutes parent busy task where the parent completed two brief questionnaires while the child played alone.
Statistical analyses
12
a total score which was then divided by four (the number of items) to create an average score. Pitman-Morgan's test was used to determine whether there was a difference in score variances when comparing between the two coding methods for each sample. This method compares variance between two groups which are not independent of one another by determining whether there is a correlation between the sum and the difference of two sets of scores (Mudholkar et al., 2003). To do this the two sets of scores being compared are summed to create one new variable, and the two scores are then subtracted from one another to create another new variable. The correlation between these two new variables is then examined, with significant correlations indicating a difference in the variation in scores between the two original score sets.
Results
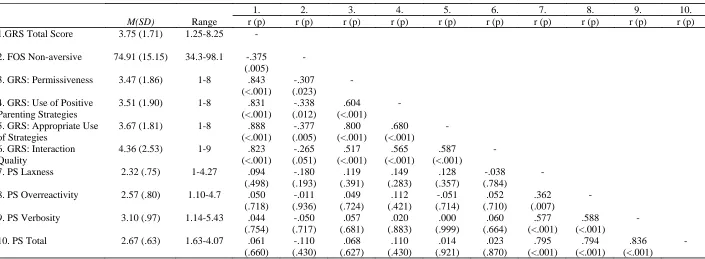
Relationships between Measures
The relationships between the GRS, FOS and Parenting Scale were examined using Pearson correlations and the results are shown in Table 4. As can be seen from the table, GRS and FOS scores were significantly correlated in the expected direction. However, there was no relationship between either observational coding system and the self-report measures.
Base Rates of Behaviour
A one-way ANOVA was conducted to determine whether there was a significant difference in the percentage of intervals of non-aversive parental behaviour across the three samples (clinic, control, and community) measured by the FOS indicating a significant main effect
F(2,52) = 6.14, p = .004. Independent samples t-test found no significant difference was found between the base rates of the clinic (M = 68.05, SD = 15.54) and control (M = 74.47,
SD = 16.23) samples, t(38) = -1.28, p = .209. However, a significant difference was found between the base rates of behaviour when comparing the control and community (M = 84.65,
13
community sample, t(33) = 2.29, p = .027. The comparison between the base rates of the clinic and control samples was recalculated using the GRS. Results remained the same, showing no significant difference between base rates of the clinic (M = 4.54, SD = 1.79) and control (M = 3.79, SD = 1.56) samples, t(38) = -1.41, p = .166.
Behaviour Variability
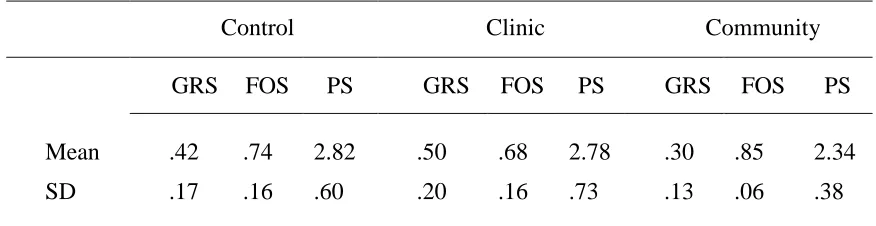
Analyses looking at the variance of scores when behaviour was measured using the FOS or GRS were conducted using Pitman-Morgan's Test. The Pitman-Morgan Test was conducted separately for both the control and community samples. Because the FOS and GRS were originally coded on different scales, the GRS scores were rescaled so that the scores were comparable to the percentage scores of the FOS. This was done by dividing each score on each scale of the GRS by nine (scale range) before summing the scores to provide a total score which was then divided by four (the number of items) and then by one hundred. Means and standard deviations of the GRS and FOS for each sample are displayed in Table 5.
The results indicated no significant difference in the variance in scores between the FOS and GRS for the control sample, r(20) = .07, p = .768. In contrast a significant difference in variance between the GRS and FOS was found in the community sample, r(15) = .73, p = .002. This variance was such that the global ratings resulted in more score variance.
Discussion
The primary aim of this study was to determine the relationship between global ratings and microanalytic observational coding of parenting in the context of parent-child interactions. Consistent with predictions (H1), results demonstrated significant correlations between data coded by the two different methods, as found by prior research (Metsäpelto et al., 2001).
14
behaviour between the clinic and control samples. This finding was contrary to past research where more aversive behaviour in the parents of children diagnosed with clinical disorders has been found (Dadds et al., 1992). The findings may be due to a lack of observed aversive behaviour in the current participant sample, similar to prior research (e.g., Morawska et al., 2006). The lack of significant differences between the clinic and control samples might also reflect the small sample size of the study, or indicate that mothers concerned about their child's feeding difficulties are not being less positive, but rather using effective parenting in an inappropriate manner, such as praising a child before the child has complied with a request. Such information is not available via the microanalytic FOS, but we expected to see a significant difference in the base rates between the two samples when using GRS. Future research should examine a larger, clinical parent sample, and incorporate an appropriateness measure into the assessment tool used to detect base rates of effective behaviour. Further research might also benefit from eliciting more aversive parenting behaviour, by recruiting a higher risk sample of parents for comparison or considering the nature of the task conducted for the observation.
15
and gained more attention, in the playtime context as a result of having their mother’s full attention. In line with this, while in the majority of the playtime observations only the mother and child were present, in the mealtime observations several children were often present, thus limiting the positive attention she could give to the target child. These findings demonstrate that context might play a role in the base rates of positivity and has implications in comparing research findings across contexts.
With regard to the sensitivity of the different systems, contrary to predictions (H2b), results demonstrated no significant difference in the variability of scores in the control sample when data was coded globally as opposed to microanalytically. This finding was not expected based on past research (Bor et al., 2002; Morawska et al., 2006). However, the lack of significant results correspond with the finding that there was no significant difference in the base rates of positivity between the clinic and control samples. Specifically, if the failure to find a significant difference between the base rates of positivity in the clinic and control sample genuinely reflected a lack of difference between these two samples, then it is logical that there should be no difference in the sensitivity of the FOS and GRS when looking at the positivity scores.
16
Results did not support the hypothesis that either observational measure would be related to the self-report measures (H3). This is somewhat consistent with the small body of literature demonstrating that self-report and observational measures are only modestly correlated (Arnold et al., 1993; Deater-Deckard et al., 1996; Kochanska et al., 1989; Webster-Stratton, 1998). It may be that each measure taps different constructs, or reflects different time periods and contexts – observations, for example, capture parent behaviour on a single occasion, compared to self-report measures which require the parent to reflect on their behaviour over a longer period and in various situations. This finding has implications regarding the use of self-report to validate observational research and vice versa. Further research should ensure congruence in the constructs assessed by the different measures as well as ensure that the observation and self-report measures are either completed with a specific time period in mind, or take into account behaviour over several contexts and time periods.
17
mealtimes means that they may not be the best context in which to examine the correspondence in coding systems due to the fact that microanalytic coding might be more dependent on the occurrence of interactive behaviour compared to global ratings. The small sample size as well as the homogenous nature of the sample in terms of demographic variables across groups also limits the generalisability of the findings, and future research should include larger and more diverse samples. Finally, this study did not include a clinic sample in the playtime context. This introduced a confound whereby the population changed as did the context. Thus, comparisons across the two contexts need to be considered in light of this confound. While in the mealtime environment the observational context was the same for both groups, allowing direct comparisons between a clinic and control sample, this was not the case for the playtime context. Further research should examine both clinical and non-clinical populations across different contexts. Furthermore, it is worthwhile noting that the mealtime context is somewhat different to the playtime context in terms of family composition. In our study, for most playtime observations there was only one child and one mother involved, although in some cases a sibling may also have been taking part in the interaction. In our mealtime observations there was often more than one child present at the meal setting, and on some occasions another parent was present as well. In all cases however, only the interaction between the target child and target parent was coded. Future research could also potentially explore triadic parent-child interactions in both a mealtime and playtime context.
18
19 References
Adamson, M., Morawska, A., & Sanders, M. R. (2012). Childhood feeding difficulties: A randomised controlled trial of a group-based parenting intervention. Submitted for
publication.
Alexander, J. F., Newell, R. M., Robbins, M. S., & Turner, C. W. (1995). Observational coding in family therapy process research. Journal of Family Psychology, 9(4), 355-336.
Arnold, D. S., O'Leary, S. G., Wolff, L. S., & Acker, M. M. (1993). The Parenting Scale: A measure of dysfunctional parenting in discipline situations. Psychological
Assessment, 5, 137-144.
Aspland, H., & Gardner, F. (2003). Observational measures of parent-child interaction: An introductory review. Child and Adolescent Mental Health, 8, 136-143.
Bakeman, R., & Brown, J. V. (1980). Early interactions: Consequences for social and mental development at three years. Child Development, 51(2), 437-447.
Barkley, R. A. (1989). Hyperactive girls and boys: stimulant drug effects on mother-child interactions. Journal of Child Psychology and Psychiatry, 30, 379-391.
Bassett, H., King, R., & Lloyd, C. (2006). The development of an observation tool for use with parents with psychiatric disability and their preschool children. Psychiatric
Rehabilitation Journal, 30(1), 31-37.
Berk, L. E., & Spuhl, S. T. (1995). Maternal interaction, private speech, and task performance in preschool children. Early Childhood Research Quarterly, 10(2), 145-169.
20
attentional/hyperactive difficulties. Journal of Abnormal Child Psychology, 30(6), 571-587.
Carlson, C. I., & Grotevant, H. D. (1987). A comparative review of family rating scales: Guidelines for clinicians and researchers. Journal of Family Psychology, 1(1), 23-47. Dadds, M. R., Sanders, M. R., Morrison, M., & Rebgetz, M. (1992). Childhood depression
and conduct disorder: II. An analysis of family interaction patterns in the home.
Journal of Abnormal Psychology, 101(3), 505-513.
Deater-Deckard, K., Dodge, K. A., Bates, J. E., & Pettit, G. S. (1996). Physical discipline among African American and European American mothers: Links to children’s externalizing behaviors. Developmental Psychology, 32, 1065-1072.
Eyberg, S. M., Nelson, M. M., Duke, M., & Boggs, S. R. (2004). Manual for the Dyadic
Parent-Child Interaction Coding System (3rd ed.): University of Florida.
Gardner, F. (2000). Methodological issues in the direct observation of parent-child interaction: Do observational findings reflect the natural behavior of participants?
Clinical Child and Family Psychology Review, 3, 185-198.
Gardner, F., Sonuga-Barke, E., & Sayal, K. (1999). Parents anticipating misbehaviour: An observational study of strategies parents use to prevent conflict with behaviour problem children. Journal of Child Psychology and Psychiatry, 40(8), 1185-1196. Hill, C., Maskowitz, K., Danis, B., & Wakschlag, L. (2008). Validation of a clinically
sensitive, observational coding system for parenting behaviors: The Parenting Clinical Observation Schedule. Parenting: Science and Practice, 8(2), 153-185.
Hodges, E. A., Houck, G. M., & Kindermann, T. (2007). Reliability of the Nursing Child Assessment Feeding Scale during toddlerhood. Issues in Comprehensive Pediatric
21
Horn, W., Conners, C. K., Wells, K. C., & Shaw, D. (1986). Use of the Abikoff Classroom Observation Coding System in a children's inpatient psychiatric unit. Journal of
Psychopathology and Behavioral Assessment, 8(1), 9-23.
Julien, D., Markman, H. J., & Lindahl, K. M. (1989). A comparison of a global and a microanalytic coding system: Implications for future trends in studying interactions.
Behavioral Assessment, 11(1), 81-100.
Kerig, P. K. (2000). Introduction and overview: Conceptual issues in family observational research. In P. K. Kerig & K. M. Lindahl (Eds.), Family observational coding
systems: resources for systemic research (pp. 1-22). Mahwah, NJ: Lawrence
Erlbaum.
Kochanska, G., & Aksan, N. (2004). Development of Mutual Responsiveness Between Parents and Their Young Children. Child Development, 75(6), 1657-1676.
Kochanska, G., Leon, K., & Radke-Yarrow, M. (1989). Correspondence between mothers' self-reported and observed child-rearing practices. Child Development, 60(1), 56-63. Landis, J. R., & Koch, G. G. (1977). The measurement of observer agreement for categorical
data. Biometrics, 33(1), 159-174.
Locke, L. M., & Prinz, R. J. (2002). Measurement of parental discipline and nurturance.
Clinical Psychology Review, 22, 895-929.
Metsäpelto, R. L., Pulkkinen, L., & Poikkeus, A. M. (2001). A search for parenting style: a cross-situational analysis of parental behavior. Genetic, Social, And General
Psychology Monographs, 127(2), 169-192.
22
Morawska, A., & Sanders, M. R. (2006). Self-administered behavioural family intervention for parents of toddlers: Part I - Efficacy. Journal of Consulting and Clinical
Psychology, 74, 10-19.
Mudholkar, G. S., Wilding, G. E., & Mietlowski, W. L. (2003). Robustness properties of the Pitman-Morgan Test. Communications in Statistics, 32(9), 1801-1816.
Patterson, G. R. (1982). Coercive family process. Eugene, Oregon: Castalia Publishing Co. Patterson, G. R., & Forgatch, M. S. (1995). Predicting future clinical adjustment from
treatment outcome and process variables. Special Issue: Methodological issues in psychological assessment research. Psychological Assessment, 7, 275-285.
Sanders, M. R. (2000). Family Observation Schedule. Brisbane, Australia: University of Queensland, Parenting and Family Support Centre.
Sanders, M. R. (2008). Triple P-Positive Parenting Program as a Public Health Approach to Strengthening Parenting. Journal of Family Psychology, 22(3), 506–517.
Sanders, M. R. (2012). Development, Evaluation, and Multinational Dissemination of the Triple P-Positive Parenting Program. Annual Review of Clinical Psychology, 8, 345-379.
Sanders, M. R., Bor, W., & Morawska, A. (2007). Maintenance of Treatment Gains: A Comparison of Enhanced, Standard, and Self-directed Triple P-Positive Parenting Program. Journal of Abnormal Child Psychology, 35(6), 983–998.
Sanders, M. R., & Christensen, A. (1985). A comparison of the effects of child management and planned activities training in five parenting environments. Journal of Abnormal
Child Psychology, 13, 101-117.
23
family intervention for parents of children with early onset conduct problems. Journal
of Consulting and Clinical Psychology, 68(4), 624-640.
Sharry, J., Guerin, S., Griffin, C., & Drumm, M. (2005). An evaluation of the Parents Plus Early Years Programme: A video-based early intervention for parents of pre-school children with behavioural and developmental difficulties. Clinical Child Psychology
and Psychiatry, 10(3), 319-336.
Snyder, J., Reid, J., Stoolmiller, M., Howe, G., Brown, H., Dagne, G., & Cross, W. (2006). The Role of Behavior Observation in Measurement Systems for Randomized Prevention Trials. Prevention Science, 7(1), 43-56.
Tabachnick, B. G., & Fidell, L. S. (1996). Using multivariate statistics. New York: HarpersCollins.
Tryon, W. W. (1998). Behavioral observation. In A. S. Bellack & M. Hersen (Eds.),
Behavioral assessment: A practical handbook (pp. 79-103). Needham Heights, MA:
Allyn & Bacon.
Webster-Stratton, C. (1985). Comparisons of behavior transactions between conduct-disordered children and their mother in the clinic and at home. Journal of Abnormal
Child Psychology, 13, 169-184.
Webster-Stratton, C. (1998). Preventing conduct problems in head start children: Strengthening parenting competencies. Journal of Consulting and Clinical
Psychology, 66, 715-730.
24
Weis, R., & Lovejoy, M. C. (2002). Information processing in everyday life: Emotion-congruent bias in mothers' reports of parent-child interactions. Journal of Personality
and Social Psychology, 83(1), 216-230.
Winter, L., Morawska, A., & Sanders, M. R. (2012). The Knowledge of Effective Parenting Scale (KEPS): A tool for public health approaches to universal parenting programs.
25 Table 1.
26 Control
(N = 20)
Clinic (N = 20)
Community (N = 15)
Clinic vs control Community vs control
M (SD) M (SD) M (SD) t (p) t (p)
Child age 2.15 (.81) 2.65 (.93) 2.40 (.74) -1.87 (.079) -.94 (.356)
N (%) N (%) N (%) χ2 (p) χ2 (p)
Child gender Male Female 12 (60.0) 8 (40.0) 10 (50.0) 10 (50.0) 11 (73.3) 4 (26.7)
.40 (.525) .68 (.411) Parent Marital Status
Married/cohabiting Separated Single 19 (95.0) 1 (5.0) 0 (0.0) 18 (90.0) 0 (0.0) 2 (10.0) 13 (91.4) 1 (6.70) 1 (6.70)
3.03 (.220) 1.44 (.487)
Education
Less than high school High school Trade/college University 1 (5.0) 3 (15.0) 1 (5.0) 15 (75.0) 0 (0.0) 1 (5.0) 5 (25.0) 14 (75.0) 0 (0.0) 0 (0.0) 2 (13.3) 13 (86.7)
4.70 (.195) 3.84 (.279)
Difficulty meeting essential needs Yes No 1 (5.0) 19 (95.0) 3 (15.0) 17 (85.0)
NA 1.11 (.292) NA
Annual Family Income $25-50000 $70-90000 >$90000
NA NA 1 (6.7)
5 (33.3) 9 (60.0)
27 Table 2. FOS Parent Behaviour Codes
Code Description
Positive codes
Praise A positive description of a child’s behaviour or characteristic, or positive global reference to the child. + Contact Parent physically touches child in a non-aversive manner.
+ Specific Instruction A non-aversive instruction that implies the child should change their behaviour. It is direct and has a clear behavioural referent.
+ Vague Instruction A non-aversive instruction that implies the child should change activity but is not direct or has no clear behavioural referent.
+ Social Attention Parent gives positive (non-aversive) attention (verbal or non-verbal) to the child that cannot be coded elsewhere. Affection Any verbal or non-verbal affection directed towards the child.
Aversive codes
- Contact Parent physically touches child in an aversive manner.
- Specific Instruction An aversive instruction that implies the child should change their behaviour. It is direct and has a clear behavioural referent.
- Vague Instruction An aversive instruction that implies the child should change activity but is not direct or has no clear behavioural referent.
28 Table 3. GRS Parent Behaviour Codes
Code Description Intra-class Correlations
Permissiveness This dimension captures the extent to which the parent had clear expectations for the child’s
behaviour and how lenient or laissez-faire the parent was in regards to the child’s behaviour .706 Use of Positive
Parenting Strategies
This dimension captures the extent to which the parent used positive parenting strategies
.634 Appropriate use of
Strategies
This dimension captures how appropriate the management strategies used by the parent were
in relation to their child’s behaviour, and when they were applied .514 Parent-Child Interaction
Quality
This dimension captures the relationship between parent and child during the observation, and
29
Table 4.
Pearson Correlations and Significance Values Between the FOS, the GRS and GRS Items, and the PS and PS Subscales
1. 2. 3. 4. 5. 6. 7. 8. 9. 10.
M(SD) Range r (p) r (p) r (p) r (p) r (p) r (p) r (p) r (p) r (p) r (p)
1.GRS Total Score 3.75 (1.71) 1.25-8.25 -
2. FOS Non-aversive 74.91 (15.15) 34.3-98.1 -.375 (.005)
-
3. GRS: Permissiveness 3.47 (1.86) 1-8 .843
(<.001)
-.307 (.023)
-
4. GRS: Use of Positive Parenting Strategies
3.51 (1.90) 1-8 .831
(<.001) -.338 (.012) .604 (<.001) -
5. GRS: Appropriate Use of Strategies
3.67 (1.81) 1-8 .888
(<.001) -.377 (.005) .800 (<.001) .680 (<.001) -
6. GRS: Interaction Quality
4.36 (2.53) 1-9 .823
(<.001) -.265 (.051) .517 (<.001) .565 (<.001) .587 (<.001) -
7. PS Laxness 2.32 (.75) 1-4.27 .094
(.498) -.180 (.193) .119 (.391) .149 (.283) .128 (.357) -.038 (.784) -
8. PS Overreactivity 2.57 (.80) 1.10-4.7 .050
(.718) -.011 (.936) .049 (.724) .112 (.421) -.051 (.714) .052 (.710) .362 (.007) -
9. PS Verbosity 3.10 (.97) 1.14-5.43 .044
(.754) -.050 (.717) .057 (.681) .020 (.883) .000 (.999) .060 (.664) .577 (<.001) .588 (<.001) -
10. PS Total 2.67 (.63) 1.63-4.07 .061
(.660) -.110 (.430) .068 (.627) .110 (.430) .014 (.921) .023 (.870) .795 (<.001) .794 (<.001) .836 (<.001) -
30 Table 5.
Means and Standard Deviations for the GRS (Rescaled), FOS, and PS for the Control, Clinic and Community Samples
Control Clinic Community
GRS FOS PS GRS FOS PS GRS FOS PS
Mean .42 .74 2.82 .50 .68 2.78 .30 .85 2.34
SD .17 .16 .60 .20 .16 .73 .13 .06 .38