University of Southern Queensland
Faculty of Health, Engineering & Sciences
Improved Cooling System for USQ’s Small Scale Icing
Wind Tunnel
A dissertation submitted by
Rhyan Wall
in fulfilment of the requirements of
Courses ENG4111 and ENG4112 Research Project
towards the degree of
Bachelor of Engineering (Mechanical)
Abstract
Turbofan engine icing is a relatively new mode of icing attributed to solid phase ice
ac-cretion inside the engines. This occurs during flights at high altitudes through convective
regions, where tiny ice crystals are ingested and make contact with the engine’s warm
internal surfaces. The University of Southern Queensland has a small scale icing wind
tunnel dedicated to studying aspects of thermal and particle conditions characteristic of
ice accretion initiation in turbofan engines.
This dissertation aimed to improve the operation of the facility’s refrigeration system by
investigating the feasibility of implementing a steady flow work extraction device to super
cool pressurised air via expansion processes.
A DEPRAG rotary vane air motor was sourced to conduct the bulk of testing on,
us-ing K type thermocouples to measure a maximum temperature drop of 20.7oC. After
this preliminary testing, the air motor was disassembled to assist in development of a
theoretical system model using equations based on geometry and fluid mechanics; tuned
using recorded data as a reference. This went to show that the expansion process of air
over short periods followed a roughly isentropic relationship. Further work was done to
determine whether this relationship held over longer periods of expansion.
Secondary testing was conducted after redesigning the cylinder rotor housing to maximise
temperature drop. Results from this test provided only minor improvement, producing
a maximum temperature drop of 21.2oC. The relative size of the cylinder bore, and the
speed of the motor are believed to have nullified the adaptations made to initiate the
ii
is posed that this resulted in the vanes reforming working chambers at a similar position
to what they did in the original motor.
A customised rotary vane air motor was designed to overcome these issues in design and
operation by being larger and slightly slower. Unfortunately time constraints prevented
this from advancing into fabrication and testing phases.
The findings from this project suggest that small commercial air motors are not capable
of conditioning air cold enough to be a feasible alternative to the current cooling system.
It also suggests that small motors are difficult to modify when aiming to increase their
maximum temperature drops. In the case of the DEPRAG air motor, its high speed and
small cylinder bore are believed to interfere with the amount of expansion experienced
by affecting vane (or working chamber) engagement.
Larger temperature drops may be possible using larger sized rotary vane air motors,
such as the customised rotary vane air motor designed in this project. However a key
assumption in this is that the isentropic behaviour of expanding air observed in the
DEPRAG air motor carries over to larger motors, and there is no easy way to confirm
University of Southern Queensland Faculty of Health, Engineering & Sciences
ENG4111/2 Research Project
Limitations of Use
The Council of the University of Southern Queensland, its Faculty of Health, Engineering
& Sciences, and the staff of the University of Southern Queensland, do not accept any
responsibility for the truth, accuracy or completeness of material contained within or
associated with this dissertation.
Persons using all or any part of this material do so at their own risk, and not at the risk of
the Council of the University of Southern Queensland, its Faculty of Health, Engineering
& Sciences or the staff of the University of Southern Queensland.
This dissertation reports an educational exercise and has no purpose or validity beyond
this exercise. The sole purpose of the course pair entitled “Research Project” is to
con-tribute to the overall education within the student’s chosen degree program. This
doc-ument, the associated hardware, software, drawings, and other material set out in the
associated appendices should not be used for any other purpose: if they are so used, it is
entirely at the risk of the user.
Dean
Certification of Dissertation
I certify that the ideas, designs and experimental work, results, analyses and conclusions
set out in this dissertation are entirely my own effort, except where otherwise indicated
and acknowledged.
I further certify that the work is original and has not been previously submitted for
assessment in any other course or institution, except where specifically stated.
Rhyan Wall
Acknowledgments
I’ve had a great deal of help in my thesis project and there are a few people I would
like to thank for their assistance. First and foremost, I would like to acknowledge the
contribution and support provided by the academic and technical staff of the University
of Southern Queensland.
I would like especially to thank my supervisors, Dr. David Buttsworth and Dr. Khalid
Hashim Saleh, and Dr. Ray Malpress for their valued guidance and continued assistance
over the duration of my undergraduate dissertation project. I’d also like to thank Mr.
Chris Galligan for his patience and insight regarding the fabrication of my test rig.
I really enjoyed this phase of my program and greatly appreciate the support you have
all lent to me over the past year.
Lastly, I want to thank my family and friends for their overwhelming encouragement and
support over the course of this degree. Additional acknowledgements go out to coffee,
The Natural Confectionery Co. and Marvel Studios; for helping me to get to this point
in my degree without having blown my brains out.
Contents
Abstract i
Acknowledgments v
List of Figures xi
List of Tables xiv
Nomenclature xv
Chapter 1 Introduction 1
1.1 Purpose . . . 1
1.2 Background . . . 2
1.3 Project Goals . . . 2
1.4 Overview of the Dissertation . . . 4
CONTENTS vii
2.2 Introduction to Icing . . . 5
2.3 Structural Ice Accretion . . . 6
2.3.1 Clear Ice . . . 6
2.3.2 Rime Ice . . . 7
2.4 Ice Crystal Engine Icing . . . 7
2.5 Icing Wind Tunnel . . . 9
2.6 Expansion Based Cooling . . . 15
2.7 Supercooling and Freezing of Small Water Droplets . . . 16
2.8 Air Motor . . . 17
2.9 Band Brake . . . 20
2.10 Chapter Summary . . . 22
Chapter 3 Vacuum Pump Case Study 25 3.1 Chapter Overview . . . 25
3.2 Introduction . . . 25
3.3 Analysis . . . 26
3.4 Results . . . 31
3.5 Chapter Summary . . . 32
CONTENTS viii
4.2 Experimental Design and Materials . . . 33
4.2.1 Theoretical Model of Fully Expanded Air . . . 35
4.2.2 Air Motor Sizing . . . 36
4.2.3 Dynamometer for DEPRAG Air Motor . . . 38
4.2.4 AMR Assembly . . . 42
4.3 Experimental Set-up and Procedure . . . 43
4.3.1 Materials and Equipment . . . 43
4.3.2 Testing of AMR . . . 45
4.4 Chapter Summary . . . 46
Chapter 5 Results and Discussion 47 5.1 Chapter Overview . . . 47
5.2 Experimental Results . . . 47
5.3 Discussion of Results . . . 49
5.4 Chapter Summary . . . 53
Chapter 6 Post Experimental Design Work 55 6.1 Chapter Overview . . . 55
6.2 Refined System Model . . . 55
6.3 Redesigned Rotor Cylinder Housing . . . 58
CONTENTS ix
6.3.2 Conclusions . . . 63
6.4 Customised Rotary Vane Air Motor (RVAM) . . . 63
6.4.1 Material Selection . . . 64
6.4.2 Performance Simulation Results . . . 65
6.4.3 Stress Analysis . . . 65
6.4.4 Vane Displacement Analysis . . . 69
6.4.5 Fatigue Analysis . . . 71
6.4.6 Simulation Results . . . 71
6.4.7 Conclusions . . . 76
6.5 Chapter Summary . . . 77
Chapter 7 Conclusion 79 7.1 Review of Dissertation . . . 79
7.2 Conclusions . . . 80
7.3 Limitations and Further Work . . . 81
CONTENTS x
B.2 Refined Air Motor Simulation -predict.m . . . 97
B.3 Experimental Results - experimental results.m. . . 108
B.4 Force and Stress Analysis -Stress analysis.m . . . 111
Appendix C Risk Management Plan 123
Appendix D Model Drawings 131
D.1 Air Motor Rig (AMR) . . . 132
D.2 Redesigned DEPRAG Cylinder Rotor Housing . . . 137
List of Figures
2.1 Clear icing on airfoil (FAA 1975) . . . 7
2.2 Rime icing on airfoil (FAA 1975) . . . 7
2.3 CIRA icing wind tunnel layout (Ferrigno et al. 2004) . . . 11
2.4 Loop configuration of the IRT after the 1999 modifications (Irvine, Kevdz-ija & Sheldon 2001) . . . 12
2.5 Configuration and specs of the VTT (TRCF 2010) . . . 14
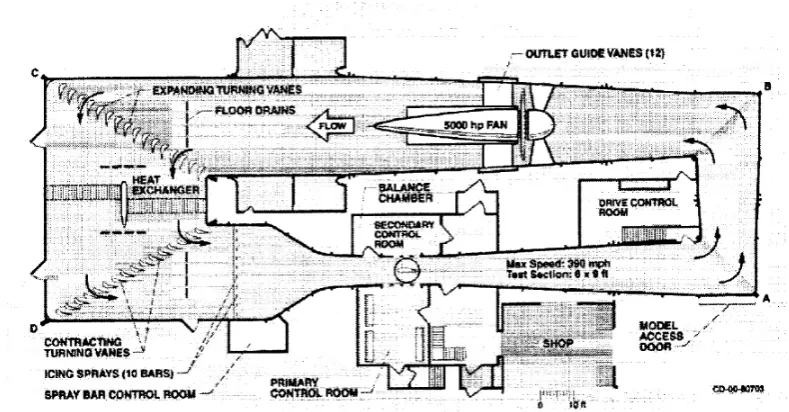
2.6 Current configuration of USQ’s small scale IWT (Saleh 2013) . . . 15
2.7 Cutaway view of an axial piston air motor (Air Motor Selection and Sizing 2012) . . . 18
2.8 Cutaway view of a rotary vane air motor (Air Motor Selection and Sizing 2012) . . . 19
2.9 Band brake schematic (Juvinall & Marshek 2012) . . . 21
3.1 Cross section of vacuum pump . . . 27
LIST OF FIGURES xii
4.1 AMR Experimental Set-up for Initial Testing. The yellow exhaust hose
leads to a volumetric reader while the black intake tube leads under the
table to the acting control valve; positioned off screen. . . 34
4.2 DEPRAG air motor catalogue extract (Basic Line: Air Motors from 200W to 1.2kW 2015) . . . 36
4.3 Stenco Aluminium 1A v-pulley (Blackwoods Catalogue 2014) . . . 38
4.4 Fenner SX jaw coupling (Blackwoods Catalogue 2014) . . . 41
4.5 Air Motor Rig Assembly (initial design drawing) . . . 42
4.6 High Pressure K-type thermocouple arrangement . . . 43
4.7 EasyView 10 Dual K Thermometer . . . 44
4.8 Lutron DT-2236 photo-tachometer . . . 44
5.1 MATLAB Plot of Torque versus Rotational Speed . . . 50
5.2 DEPRAG 63-001F03 Performance Curve . . . 50
5.3 MATLAB Plot of Power versus Rotational Speed . . . 51
5.4 MATLAB Plot of Temperature Difference versus Brake Torque. Note that predicted temperature was calculated using equation 3.13, assuming 60% of calculated power is used. . . 52
6.1 Convention for volumes in refined model geometric calculations. . . 56
6.2 MATLAB Plot of Power versus Rotational Speed . . . 60
6.3 MATLAB Plot of Temperature Difference versus Brake Torque. . . 61
LIST OF FIGURES xiii
6.5 Vane Force Analysis Conventions . . . 67
6.6 Rotor Force/Moment Convention, If FR1 or FL2 are positive, and FR2 or FL1 are negative, then equate them to 0. . . 67
6.7 Stiffness matrix calculation (Hibbeler 2012) . . . 69
6.8 Stiffness Analysis Convention: (above) FL acting before centre of gravity, (below) FL beyond centre of gravity . . . 70
6.9 Vane Force Simulation . . . 72
6.10 Rotor Stress Simulation . . . 72
6.11 Shaft Stress Simulation . . . 73
6.12 Bearing Force Simulation . . . 73
6.13 Maximum Vane Displacement Simulation . . . 74
6.14 Vane Stress Simulation . . . 74
6.15 Rotor Section Constant Life Fatigue Diagram . . . 75
6.16 CREO model constraints and forces setup . . . 75
List of Tables
3.1 MATLAB Vacuum Pump Simulation Results . . . 31
4.1 MATLAB Air Motor Simulation Results . . . 35
4.2 Preliminary MATLAB DEPRAG Air Motor Simulation Results . . . 37
4.3 MATLAB DEPRAG Band Brake Simulation Results . . . 39
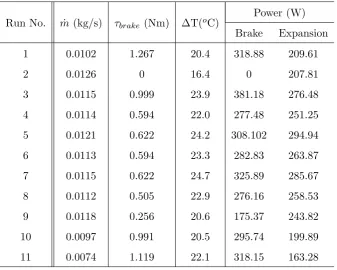
5.1 Recorded Data From Round 4 of AMR Testing . . . 48
5.2 Secondary Results From Round 4 of AMR Testing . . . 48
6.1 Refined MATLAB DEPRAG Air Motor Simulation Results . . . 58
6.2 Recorded Data From Redesigned AMR Testing . . . 59
6.3 Secondary Results From Redesigned AMR Testing . . . 60
6.4 Recorded Data From AMR Re-Testing . . . 62
6.5 Secondary Results From AMR Re-Testing . . . 62
6.6 Material Selection Summary . . . 64
Nomenclature
All values in SI units unless otherwise stated.
SYMBOLS
A Area m2
a,s Gap Clearance m
β,φ,θ Angle rad
c Speed of Sound m/s
cp Specific Heat Under Constant Pressure J/kg.K
D Diameter m
η Efficiency
F, P Force N
f Coefficient of Friction
I Second Moment of Inertia m4
k Ratio of Specific Heats
L Depth m
M Mach Number
˙
m Mass Flow Rate kg/s
n Polytropic Index
p Pressure Pa
Q Volumetric Flow Rate m3/s
R Universal Gas Constant J/kg.K
r Radius m
rpm Rotational Speed rpm
Nomenclature xvi
t Thickness m
τ Torque N.m
U Velocity m/s
w Width of Vane m
V Volume m3
˙
W Power W
z Number of Vanes
SUBSCRIPTS
0 Under Stagnant Conditions
1 Initially / Leading
2 Finally / Lagging
act Actuating
b Base
beg Beginning
c Cylinder
cor Coriolis Effect
ex Exhaust
exp Expansion
f ill Filling
i Inner
∞ Under Free-Stream Conditions
L Left
m Centre of Mass
n Normal
o Outer
R Right
r Rotor
S Shaft
s Shear
rem Remaining
Nomenclature xvii
v Vane
wc Working Chamber
ACRONYMS
AIWT Altitude Icing Wind Tunnel
AMR Air Motor Rig
CIRA Italian Aerospace Research Centre
IWT Icing Wind Tunnel
IRT Icing Research Tunnel
NASA National Aeronautics and Space Administration
NRC National Research Council
PIWT Propulsion Icing Wind Tunnel
RVAM Rotary Vane Type Air Motor
RVVP Rotary Vane Type Vacuum Pump
USD United States Dollar
USQ University of Southern Queensland
Chapter 1
Introduction
1.1
Purpose
Given the continued role icing has in aircraft accidents, development of methods and
tech-nologies regarding the safe operation of aircraft under meteorological conditions promoting
the occurrence of natural icing is of continued importance. The purpose of this project is
to improve upon the current cooling system utilised by the small scale icing wind tunnel
(IWT) at the University of Southern Queensland (USQ). As such, this project utilised
the existing icing wind tunnel’s setup, which is designed to simulate aspects of thermal
and particle conditions characteristic of ice accretion initiation in turbofan engines.
This project aims to investigate the feasibility of improving the cooling system on USQ’s
small scale IWT through utilising steady flow work extraction based expansion in
super-cooling air; specifically by using a rotary vane type air motor (RVAM). Using expansion
based cooling via work extraction as an alternative would eliminate several problems
in-volving the current mode of cooling; particularly the large fluctuations in temperature
and the introduction of vaporised liquid nitrogen in the air stream. This novel method of
cooling also has a far lower running cost compared to typical refrigeration systems used
1.2 Background 2
1.2
Background
The supercooling and freezing of water has been studied by a large number of workers for
the better part of the last 300 years (Langham & Mason 1958). Significant breakthroughs
having been made in the last 50 years by studies conducted on the effects of icing in a
number of different sectors. An area of practical interest is the aerospace sector.
Although icing is not a new hazard to the aerospace sector, its capacity to cause major
accidents even today remains considerable. For example ice accretion within turbofan
engines during operation through or in the vicinity of highly convective regions is a
rea-sonably new mode of icing where gaps in knowledge still remain. The continued need for
ice accretion experimental studies forms this work’s motivational precedence.
There are a multitude of testing techniques and facilities available for researchers to use
today in simulating icing conditions, with one of the more popular facilities being icing
wind tunnels (IWTs). Typical IWTs with refrigeration based cooling system are highly
costly in operation; particularly so in simulating solid phase ice accretion. The
develop-ment of USQ’s small scale icing wind tunnel aimed to achieve the necessary operating
characteristics required to gather meaningful data using a high efficiency, low cost mode of
cooling. It was also aimed at allowing USQ to simulate the thermal and particle conditions
characteristic of solid phase ice accretion initiation in turbofan engines (Saleh 2013).
1.3
Project Goals
This project seeks to improve the operational efficiency and realism of in flight icing
simulation when using the small scale IWT at USQ. The primary goal of this project
is to determine and investigate the validity of work extraction based cooling system in
suitably conditioning an air stream for icing simulation and subsequent testing. The
RVAM was specifically chosen as the expansion device. Secondary goals of the project
were to integrate the system into the current IWT and optimise its operation.
1.3 Project Goals 3
already have the capacity to provide the necessary expansion based cooling. Assuming
performance in preliminary testing is acceptable, objectives of this project are as follows:
1. Research background information relating to icing wind tunnels, ice accretion
par-ticulate conditions, and devices capable of super cooling air; particularly through
work extraction based expansion.
2. Analyse and model the predicted operating conditions of cooling system based on
fluid and hardware properties using appropriate modelling techniques; based on
excel, matlab and maybe ansys.
3. Source required hardware and performing preliminary testing.
4. Redesign and implement proposed alterations to the icing wind tunnel.
5. Perform testing and analyse results to improve efficacy, varying the initial pressure
and work extraction.
6. Submit an academic dissertation on the research.
Should it be that performance does not meet the necessary criteria, the amended project
objectives will be as follows:
1. Research background information relating to icing wind tunnels, ice accretion
par-ticulate conditions, and devices capable of super cooling air; particularly through
work extraction based expansion.
2. Analyse and model the predicted operating conditions of cooling system based on
fluid and hardware properties using appropriate modelling techniques; based on
excel, matlab and maybe ansys.
3. Source required hardware and performing preliminary testing.
4. Redesign commercial air motor and perhaps design a purpose built air motor to
optimise cooling capacity.
5. Perform additional testing on modified device and analyse results.
1.4 Overview of the Dissertation 4
1.4
Overview of the Dissertation
Chapter 2 This chapter is the literature review, which provides an adequate overview
of modes of ice accretion (in particular engine icing conditions), the layout and
operating characteristics of conventional icing wind tunnel systems, and the primary
hardware of the proposed refrigeration system.
Chapter 3 This chapter is the case study of a Rotary Vane Vacuum Pump (RVVP),
which provides insight to the feasibility of operating a redesigned vacuum pump in
reverse to achieve similar expansion based cooling to that of an air motor (under
steady flow conditions).
Chapter 4 This chapter is the methodology, which details the selection and design of
hardware, and procedural considerations implemented in the physical testing and
experimentation of the postured cooling system.
Chapter 5 This chapter is the results and discussion, which details the collected and
sec-ondary data from the preliminary experimental campaign, and analyses the results
to determine the path to take in progressing.
Chapter 6 This chapter is the work conducted after the preliminary experimental
cam-paign, and details a refined system model, the design for a modified rotor cylinder
Chapter 2
Literature Review
2.1
Chapter Overview
This chapter summarises the present body of literature available in the scientific
com-munity pertaining to modes of ice accretion, the layout and operating characteristics of
conventional icing wind tunnels, and the primary hardware of the proposed refrigeration
system.
2.2
Introduction to Icing
Ice accretion is an environmental phenomenon that affects a wide range of systems; from
wind turbines to sea vessels; and initiates critical situations in which proper operation
of a system is impinged upon. From the perspective of the aerospace industry, icing is
a serious hazard. It has played a significant role in a multitude of accidents occurring
over the better part of the last century and continues to effect the operational capacity
of aircraft today.
Icing is a cumulative hazard that conventionally reduces aircraft efficiency by
2.3 Structural Ice Accretion 6
decreasing thrust. It also has the ability to impinge on engine performance, render flight
instrumentation readings false, and cause loss of operation on secondary mechanisms
(FAA 1975).
Ice formations are generally categorized into three main groups; in-cloud icing,
precip-itation and frost; though the context of icing in this thesis will mainly concentrate on
in-cloud icing.
2.3
Structural Ice Accretion
Structural icing is a mode of ice accretion occurring on the aircraft’s external structure
(such as the wings and tail) when two necessary conditions are met (FAA 1975):
1. the aircraft must be flying through visible water such as a rain or cloud droplets.
2. the temperature at the point where the moisture strikes the aircraft must be 0oC
or colder.
These supercooled droplets are in an unstable liquid state and will partly freeze
instan-taneously on contact. However the latent heat of fusion they release raises the remaining
portion to melting point. This remaining portion determines the type of icing exhibited.
2.3.1 Clear Ice
Clear ice forms when the remaining liquid portion of the supercooled droplet freezes
gradually after initial impact as it flows over the contacting surface. This type of icing
generally tends to form at combinations of high speeds or high cloud water concentration,
and warm or ”close to freezing” temperatures; between -15oC and 0oC (Saleh, Buttsworth
2.4 Ice Crystal Engine Icing 7
Figure 2.1: Clear icing on airfoil (FAA 1975)
2.3.2 Rime Ice
Rime ice forms when the remaining liquid portion of small supercooled droplet freezes
rapidly after the initial impact, resulting in a white opaque accretion that is relatively
streamlined. This type of icing generally tends to form at combinations of low speeds or
low cloud water concentration, and low ambient temperatures; between -40oC and -10oC
(Saleh et al. 2010, Think Ice!2010, FAA 1975). It is characteristically clear, hard, heavy and tenacious (FAA 1975).
Figure 2.2: Rime icing on airfoil (FAA 1975)
2.4
Ice Crystal Engine Icing
Ice accretion initiation in turbofan engines is a mode of ice accretion that has only recently
become a focal point of study, and is highly relevant to commuter and commercial aircraft
2.4 Ice Crystal Engine Icing 8
structural ice accretion, turbofan engine icing and power loss accidents can occur with no
ice accretion on external surfaces of aircraft.
Failures of this kind have only been reported in the last thirty years during flights through
highly convective flight regions (Saleh 2013). These regions are typically considered to
be above altitudes associated with general icing conditions. However research has shown
that high concentrations of moisture can be lifted to these high altitudes, where upon they
almost instantly freeze and become tiny ice crystals in ambient temperatures generally
less than -40oC (Mason 2007).
The typical temperature of the first stage of an engine compressor’s surface is above 0oC
(Saleh et al. 2010), so ingested ice particles will slightly melt on impact with internal
warm surfaces. Here they form enough liquid friction to stick to surfaces and trap more
ice particles in the air stream, which coalesce at certain locations within the turbofan
compressor; such as stationary compressor blades. This ice formation has the potential
to either (Buttsworth 2014):
1. cause flow blockages, degrading engine performance which has the potential to cause
a sudden unwanted drop in engine power.
2. break off and be ingested into the combustion chamber, which could cause a
flame-out or damage subsequent stages.
In late 2013, Turbofan engine icing was attributed to a number of Boeing’s new 747-8 and
787 Dreamliner aircrafts losing power at high altitude. A new warning was subsequently
posted to airlines to avoid flying aircraft with the affected engines within 50 nautical miles
of thunderstorms that may contain ice crystals (BBC 2013). It is fair to say from this that
icing maintains a clinch hold on the aviation industry today; in both health and safety,
and financial respects. The continued study and investigation into ice accretion will help
to combat icing on both these fronts by aiding in the development of new methods and
technologies to mitigate related hazards.
The physics behind this type of ice accretion can be investigated with great assistance by
2.5 Icing Wind Tunnel 9
models have yet to progress to the point of completely replacing the physical performance
and operation testing of aircraft and aircraft components. Traditional forms of testing are
primarily comprised of in-flight testing (in both natural and simulated icing conditions)
and ground testing.
In-flight testing under natural icing conditions is the most realistic means of studying the
effects of icing on aircraft. It is often a necessary stage of testing in verifying the validity
of artificial ice shapes for simulations and physically demonstrating a mitigation system’s
effectiveness. Unfortunately this method is costly and has a number of potential problems.
These include difficulties involved in finding the ideal conditions to test equipment and
demonstrate system adequacy, and in managing the related health safety issues (AGARD
1997). Time taken to find natural icing conditions can be reduced by conducting
in-flight testing under simulated icing conditions using icing spray tankers, which fly in
front of the test aircraft. Conducting in-flight tests in dry air using critical artificial ice
shapes, determined using ground facilities (Bellucci 2007), is another approach to take in
investigating the aircraft’s degraded performance and handling characteristics.
In either case there are a number of health and safety issues associated with performing
in-flight aircraft icing research. It is clear that a paradox exists: to gather accurate data
on aircraft icing and new de-icing equipment under natural icing conditions safely requires
an aircraft that is already invulnerable to the dangers of icing (Bugos 1998). In lieu of
such an aircraft, ground based testing facilities are an attractive alternative for gathering
the bulk of data on ice accretion.
2.5
Icing Wind Tunnel
Icing Wind Tunnels (IWTs) are the traditional ground facility used to simulate in-flight
icing, and have existed in a functional capacity since the early 1950’s. They are
capa-ble of producing reliacapa-ble icing data in repeatacapa-ble and controlled environments, and are
valuable tools to use in analysis and generating critical artificial ice shapes. Limitations
to their testing capabilities pertain to their size and their ability to recreate relevant
usu-2.5 Icing Wind Tunnel 10
ally be accommodated, so aircraft components and scaled models are more commonly
tested. An important benefit from using IWTs is that personnel and aircraft safety are
not compromised by any damage to test equipment during icing tests (AGARD 1997).
The majority of facilities today utilise some form of refrigeration cycle operating device.
These either operate independently or in tandem with local environmental conditions.
Refrigeration systems or plants are a well tried and tested means to conditioning test air
to temperatures well below freezing. However this method of cooling often goes hand
in hand with significant facility operation costs and inefficiencies; given the number of
processes involved. The novel idea of expansion based temperature reduction via steady
flow work extraction forms the basis of the investigation conducted by this thesis, with
an aim of reducing the operating costs and improving the efficiency of contemporary
IWT refrigeration systems. Implementing such a device would also theoretically address
the problems associated with the current cooling system on USQ’s small scale IWT; i.e.
temperature fluctuations and nitrogen entering the test air stream.
IWT systems are generally of a similar configuration to conventional dry air wind
tun-nels, however incorporate additional subsystems unique to their investigative purposes,
primarily (Bellucci 2007):
• a refrigeration system, cooling the air to temperatures below freezing.
• a water spray system, injecting a fine mist of water droplets into the air stream to produce an icing cloud.
Despite their importance, there are very few places in the world that have large scale
tunnels available for research/industrial activities (Bellucci 2007). This has led to the
wider use of small scale icing facilities, in developing new instrumentation and for carrying
out basic research on small and large supercooled droplets. At present, less than a dozen
full sized icing facilities exist in the entire world; the largest and most advanced of these
2.5 Icing Wind Tunnel 11
CIRA IWT
The CIRA IWT is a closed loop, fan driven IWT that was officially inaugurated in
Septem-ber 2002. It is considered the world’s most advanced facility to date and is capable of
reproducing real flight conditions (i.e. altitude, temperature, humidity and velocity) on
the ground in a totally secure, controlled and repeatable environment (CIRA 2015).
It is equipped with four different test sections configurations; each having synchronised
turntables. The main test section is dimensioned at 2.35m x 2.25m x 7.00m and is capable
of reaching temperatures as low as -32oC, speeds up to 214m/s and simulating flight
con-ditions at altitudes of 23,000ft (7km). The spray bar system is distanced at roughly 18m
upstream of the test sections and produces droplet sizes with a mean volume diameter of
50µm to 300µm (Ferrigno et al. 2004).
Figure 2.3: CIRA icing wind tunnel layout (Ferrigno et al. 2004)
NASA IRT
Another large refrigerated IWT system is the NASA Glenn Icing Research Tunnel (IRT)
(NASA 2009). It was designed as an atmospheric tunnel, it owes its existence to the
2.5 Icing Wind Tunnel 12
construction in 1944 by the National Advisory Committee for Aeronautics (NACA) in
Cleveland, Ohio. It was purposed with the task of investigating ways to prevent and
mitigate catastrophic aircraft failures under icing conditions (Khalid) and has played a
significant role in developing the anti icing technologies adopted by many aircraft today.
The IRT is a fan driven, closed loop, atmospheric IWT, which generates an icing cloud
to simulate icing conditions using a 2,100 ton refrigeration plant and a spray bar system;
producing droplet sizes of 15µm to 50µm with a liquid water content (LWC) between
0.2g/m3 to 3.0g/m3. As with the majority of closed loop IWTs, the heat exchanger used
in the IRT is positioned in a corner section just downstream from the fan. Further
down-stream is the water injection system, positioned just before the settling chamber. The
IRT’s test section is dimensioned at 1.83m x 2.74m x 6.10m, and the facility operates at
air speeds between 25.72m/s and 180.06m/s and temperatures between -40oC and 5oC
(ASME 1987). The operation of this facility was costed by a recent journal article at
[image:30.595.101.496.419.625.2]roughly $34,000 USD a day, with scheduling required at least nine months in advance (Saleh 2013).
2.5 Icing Wind Tunnel 13
NRC AIWT
The National Research Council’s (NRC’s) Altitude IWT, located in Ottawa (Ontario,
Canada), is an IWT used to simulate in flight atmospheric icing; conditions reaching
altitudes as high as 30,000ft (9.144km). The facility supports research organisations and
commercial clients for a multitude of needs and produces test results that have been
accepted by a number of high level certification authorities. The IWT has three test
sections available (one standard and two reduced size sections), with its standard section
dimensioned at 0.57m x 0.57m x 1.83m and reduced working sections dimensioned at
0.30m x 0.57m x 0.60m and 0.24m x 0.57m x 0.60m. This main test section operates
at air speeds between 5m/s and 100m/s with the air temperature at maximum velocity
reaching as low as -35oC. The droplet sizes produced range between 8µm and 120µm with
a LWC between 0.1g/m3 and 3.5g/m3 (NRC 2013b).
NRC PIWT
The NRC has another IWT located in Ottawa (Ontario, Canada) known as the Propulsion
IWT. The facility has a single test section dimensioned at 3.1m x 6.1m x 12.2m and has
an open circuit layout. This means a naturally cold test section is available during the
Winter season (or when the local environmental and atmospheric conditions are suitable),
which combined with the working section’s height allows the facility to simulate larger
water droplets than most other IWTs can support (NRC 2013a). Coupled with a 750kW electric fan at the entry point, the propulsion IWT is capable of simulating the effects
of fluids and snow and ice pellets on a full sized tail test section under fully operational
speeds in freezing conditions.
VTT IWT
Another open circuit IWT facility exists in Espoo Finland, which is operated by the
Technical Research Centre of Finland (VTT). This particular IWT is fan driven and
2.5 Icing Wind Tunnel 14
IWT’s test section is dimensioned at 0.70m x 0.70m x 1.00m, and the facility operates at
speeds up to 45m/s and temperatures between -20oC and 30oC (TRCF 2010). The droplet
[image:32.595.143.454.163.419.2]sizes produced range between 20µm and 50µm with a LWC between 0.1g/m3and 1.0g/m3.
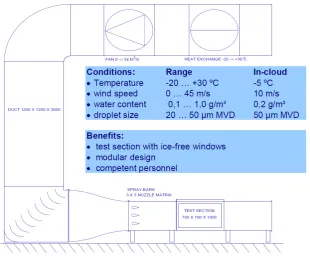
Figure 2.5: Configuration and specs of the VTT (TRCF 2010)
USQ Small Scale IWT
There is a small scale IWT that currently exists at USQ, which had been commissioned
in 2013. It utilises a liquid nitrogen plenum based cooling system, which supplies liquid
nitrogen from a 20L dewar fitted with a manual discharge device (Khalid), and has the
capacity to simulate aspects of thermal and particle conditions characteristic of ice
accre-tion initiaaccre-tion in turbofan engines. The droplet sizes produced are around 50µm with an
ice water content of 0.42±0.26g/m3.
However, there are problems associated with the system’s cold air conditions due to
fluc-tuation in the mixed flow temperature at the exit of the plenum chamber; flucfluc-tuations
2.6 Expansion Based Cooling 15
nitrogen bath based heat exchanger introduces the likelihood of nitrogen being taken up
with the air during the thermodynamic process, resulting in the icing simulation of a
non characteristic air stream. To counter this, a new approach is being tested where a
[image:33.595.139.456.185.394.2]pressurised air stream is cooled by expanding while doing work through an air motor.
Figure 2.6: Current configuration of USQ’s small scale IWT (Saleh 2013)
2.6
Expansion Based Cooling
Expansion based cooling occurs when a gas’ average kinetic energy reduces after it does
work on other molecules while expanding. As temperature is directly related to molecular
kinetic energy, this drop correlates with a drop in gas temperature; the more work done
through expansion, the greater the pressure drop and the lower the final temperature.
This principle is behind the idea to use a work extracting device to expand the
work-ing fluid or compressed air to achieve desired operatwork-ing temperatures required for the
homogeneous nucleation of water particles in solid phase icing tests.
The expansion of an ideal gas, such that the process is adiabatic and reversible, is known
2.7 Supercooling and Freezing of Small Water Droplets 16
air under steady flow conditions, and that air behaves like an ideal gas over the entire
process (which is reasonable given its high composition of Nitrogen), allows for the use of
a number of relevant thermodynamic and fluid mechanic equations (Cengel & Boles 2011):
ρ0
ρ∞
=
1 +k−1
2 M
2
k−11
(2.1)
p0
p∞
=
1 +k−1 2 M
2
k−k1
(2.2)
T0
T∞
= 1 +k−1 2 M
2 (2.3)
˙
m=ρU∞A (2.4)
Where: A cross sectional area of pipe, in m2
k ratio of specific heats
˙
m mass flow rate of fluid, in kg/s
M = U∞c Mach number, wherec=√kRT
ρ0/∞ stagnant / free-stream fluid density, in kg/m3
p0/∞ stagnant / free-stream fluid pressure (abs), in Pa
T0/∞ stagnant / free-stream fluid temperature, in degrees K
U∞ free-stream velocity of fluid, in m/s
2.7
Supercooling and Freezing of Small Water Droplets
The behaviour of supercooled water droplets has been an area of significant study over the
last three centuries, with results that spread into a range of science and atmospheric based
research fields. In clouds, supercooled water droplets are thought to sometimes freeze
homogeneously through the organisation of water molecules into an ice lattice without the
need for any external seeding agent (Wilson 2012). In the case of homogeneous nucleation,
in which foreign particles are not involved, cloud physicists have found that supercooling
2.8 Air Motor 17
-39oC. Bringing temperatures even slightly lower than this value rapidly transforms these
droplets into ice crystals (Langham & Mason 1958, Kuhns & Mason 1968, Wilson 2012).
The minimum temperature for heterogeneous nucleation as expected is slightly higher at
-33oC (Wilson 2012).
In order to replicate a similar performance to that of the current cooling system on USQ’s
small scale IWT, it will be necessary for the work extraction device to expand the air
stream to temperatures as far below -40oC as possible. The lower the air temperature
is below -40oC, the greater the heat transfer will be to drive the water particles’ phase
change. This may not impact significantly on the time necessary for full solidification if
bringing the temperature slightly lower than -39oC rapidly drives this change, so initial
aims will be achieve temperatures close to this.
2.8
Air Motor
An air motor is a pneumatic system designed to produce continuous rotary power from
the work done by expanding compressed air (using either linear or rotary motion). These
motors have found great success in the hand held tool industry, and have uses in many
other areas; including the automotive and manufacturing industries (What is a Pneumatic Motor? 2015). Some benefits to using air motors include the:
• ability to operate in volatile environments, as they do not require electrical power.
• ability to operate without auxiliary speed reducers.
• generally high power density.
• simple controls (e.g. speeds can be regulated with flow control valves in lieu of electronic speed controls).
Several different air motor designs exist, the most common ones include rotary vane,
piston, turbine, and tooth-gear air motors. Tooth-gear or turbines variations are highly
suitable for applications requiring continuous operation, while vane air motors are more
2.8 Air Motor 18
Piston Air Motor
Piston air motors are commonly used in applications that require high power, high
start-ing torque and accurate speed control at low speeds; so they are well suited to loaded
start applications (Korane 2012). They have a number of cylinders (usually two to six)
arranged in a housing either radially or axially. The air pressure acting on the pistons then
generates an output torque via reciprocating motion. The power developed by the motor
largely depends on intake pressure, number of pistons, piston area, stroke and speed; with
speed limited by the inertia of moving parts and the design of internal valves. A major
limitation to these motors is the need for internal lubrication (Air Motor Selection and Sizing2012).
Figure 2.7: Cutaway view of an axial piston air motor (Air Motor Selection and Sizing2012)
Rotary Vane Air Motor (RVAM)
Rotary vane air motors (RVAMs) are commonly used in applications involving low to
medium level power requirements; particularly driving portable power tools. They have
a number of axial vanes (usually three to ten vanes) fitted into radial slots that run the
length of a rotor. These seal against the interior wall of the housing by some variable
actuation mechanism (e.g. spring loading, thrust rings, CAM action, pressurised air etc.),
2.8 Air Motor 19
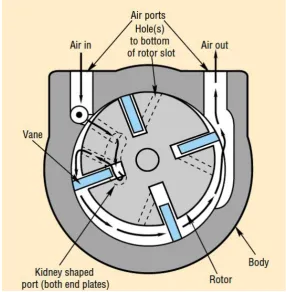
The rotor is set to circulate in an eccentrically offset perforation of the air motor cylinder,
which means vanes will form working chambers of variable volumes; which increase in the
turning direction. So when the pressurised air passes through the entry port into one of
the main motor chambers, it will start to expand and act against the exposed side of the
longer (or ”more protruding”) vane. This expansion process causes an energy conversion
from pressure energy to kinetic energy, resulting in rotation of the rotor and torque
[image:37.595.153.440.244.537.2]de-velopment. The cycle continues until the entry air is expanded to its exit pressure.
Figure 2.8: Cutaway view of a rotary vane air motor (Air Motor Selection and Sizing2012)
The effects of expansion based cooling of air through air motors is not an area that has
been heavily documented in its practical uses. However air motors are known to have
their performances impinged upon due to icing, which can occur at temperatures below
5oC (Air Vane Motorsn.d.). This is understandable given that exhaust temperatures are often well below freezing due to extremely high relative decreases in pressure over short
2.9 Band Brake 20
A report produced by Mechanical Engineering undergraduate students from the
North-eastern University (Al-Duwaisan, Sahaim, Roditi & Al-Husseini 1999) also demonstrates
the air motor’s capacity for supercooling compressed air. In the report, they detail the
design setup of a lab to measure the efficiency of an air motor. One of the advantages to
their laboratory design they made mention to was its ability to demonstrate how their air
motor could extract work from the air at a temperature of 29.4oC to reduce the exhaust
air temperature to -71oC. Part of this required calculating the theoretical temperature
drop and extracted work through a RVAM assuming the process was steady and
isen-tropic. Note that Al-Duwaisan et al. (1999) have effectively recommended taking 60%
of the rated air motor’s power in order to account for system losses when calculating
expansion power. This is based on known operating conditions, measurements and design
schematics; coupled with some knowledge of fluid mechanics theory.
Beater (2007) also recognises the capacity of an air motor to expel supercooled air given
a high enough expansion ratio; noting that water in the air stream can freeze and finally
block the air motor. Although all of this clearly demonstrates confidence in the air
motor’s capacity to expel very cold air, conducting testing is the only way to solidify
these predictions.
2.9
Band Brake
A band brake will be employed to extract the desired power. This device generates its
braking action by applying a flexible band of frictional material to a rotating drum via
some actuating force. The drum is commonly made from steel and is lined with a band
2.9 Band Brake 21
Figure 2.9: Band brake schematic (Juvinall & Marshek 2012)
Neglecting viscous effects of fluids, the following equations are associated with traditional
band brake design:
τ = (P1−P2)r (2.5)
τ = 60 ˙Wout
2π×rpm (2.6)
P1
P2
=ef φ (2.7)
Where: τ torque developed by brake, in N.m
P2 actuating force, in N
P1 anchoring force, in N
˙
Wout power extracted by brake, in N.m
rpm rotational speed of drum, in rpm
r radius of drum, in m
f coefficient of friction
φ angle of contact, in rad
In this particular project, the drum and band will be supplemented with a v-pulley and
v-section belt respectively. This is aimed at reducing the required actuating forces and
improving bearing life. As such the equation relating the forces generated will be sightly
2.10 Chapter Summary 22
a v-pulley with a wedge angle ofβ, the force acting on an infinitely small element will be
given by:
dP = P f µdθ
sinβ
This can be used to derive a relationship forP1 and P2 by integrating overθ:
Z P1
P2
dP
P =
Z φ
0
f dθ
sinβ
P1
P2
=esinf φβ (2.8)
2.10
Chapter Summary
The study of ice accretion in turbofan engines is of great importance in the aerospace
sector. Unlike structural icing, ice crystal engine icing can cause degraded performance
and power loss events without ice adhering to external surfaces. It generally occurs in
highly convective regions while aircraft are travelling at high altitudes, where ambient
temperatures are generally -40oC or less.
IWTs are a practical and economical means of accomplishing this study safely in a
con-trollable and repeatable environment. These facilities are generally capable of reaching
temperatures of -40oC, and speeds of 100m/s while producing droplet sizes of 50µm and
a liquid water content of 3.0g/m3.
USQ’s small scale IWT currently utilises a liquid nitrogen based cooling system, however
there are problems in its operation pertaining to large temperature fluctuations. The
novel approach taken by this thesis is to replicate the cooling conditions required for solid
phase ice accretion of small water droplets by extracting work from pressurised air. The
particular mode of work extraction investigated in this project is the RVAM.
The rotary vane air motor is a pneumatic system that converts work done by expanding
compressed air to rotational power. It operates with an eccentrically offset rotor fitted
2.10 Chapter Summary 23
in volume with the turning direction. Given the documentation present on air motor icing,
it is postured that an air motor with a large enough expansion ratio will be able to provide
the required cooling conditions needed to be a viable alternative to the current cooling
system.
A band brake will act as the powered device. As opposed to the traditional drum and
band design, this project will supplement these components with a v-pulley and v-section
Chapter 3
Vacuum Pump Case Study
3.1
Chapter Overview
This section covers the case study analysis conducted on USQ’s rotary vane vacuum pump
(RVVP). This was based on its geometry and theoretical performance characteristics in
reverse operation.
3.2
Introduction
RVVPs are positive displacement pumps that are setup similarly to RVAMs, in that they
consist of an eccentrically offset rotor inserted with vanes to form working chambers.
During the filling cycle, working chambers increase in volume; creating a vacuum at the
intake port. They then transition to the discharge phase of the cycle; where the chamber’s
volume decreases, and creates pressure at the exhaust port (Rotary Vane Compressors and Vacuum Pumps: February 2012 GAST Catalog 2012).
As noted by Beater (2007), an air motor operating with a high enough expansion ratio
is capable of freezing the water entrained in an air stream. Given their geometric
3.3 Analysis 26
experienced in an air motor may be achieved by reversing the processes carried out by
a RVVP to produce a net power output. USQ currently has a RVVP in their inventory,
which looks to have the potential to be redesigned and operated in reverse as an RVAM
equivalent. The current design of this vacuum pump does not lend itself to an expansion
ratio capable of reducing air to a suitably cold temperature necessary for recreating icing
conditions. A case study will be conducted to determine its theoretical cooling capability
(based on isentropic relationships) using simple, non-intrusive design adaptations. These
mainly constitute:
• relocating the intake and exhaust air ports.
• increasing the number of spring loaded vanes in the rotor
3.3
Analysis
Geometric
The area swept by a working chamber (as a function of the leading rotor vane’s angle of
rotation) can be calculated by applying trigonometry to the simple geometry relating the
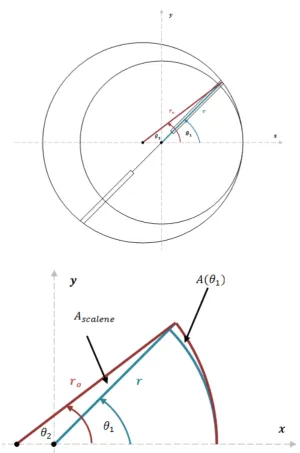
rotor and the cylinder to one another (refer to figure 3.1):
A(θ1) =Aθ2 −Ascalene−Aθ1
= r
2 oθ2
2 −
rsinθ1(ro−s−ri)
2 −
r2iθ1
2 (3.1)
Where: A cross sectional area of vacuum pump’s working chamber, in m2
θ1 the leading rotor vane’s angle of rotation, in rad
θ2 the internal vacuum pump case’s angle as a function of θ1, in rad
s the shortest space between the rotor and cylinder surfaces, taken as
10−4m
ro internal radius of vacuum pump casing, taken as 0.12690m
ri outer radius of rotor, taken as 0.10334m
3.3 Analysis 27
Figure 3.1: Cross section of vacuum pump
θ2 can be evaluated as a function of θ1 by the following:
θ2 =
arccosro−s−ri+rcosθ1 ro
0< θ1 ≤π
2π−arccosro−s−ri+rcosθ1 ro
π < θ1 ≤2π
(3.2)
and so can r, using the polar form of an offset circle:
r2o = (x+ [ro−s−ri])2+y2
3.3 Analysis 28
Rearranging into quadratic form and taking its positive root:
r= −b+
√
b2−4ac
2a (3.3)
Where: a= 1
b= 2 cosθ1(ro−s−ri)
c= (ro−s−ri)2−ro2
Volume was determined simply by multiplying this function by the length or internal
depth of the casing:
V(θ1) =
L
2 r
2
oθ2−rsinθ1(ro−s−ri)−r2iθ1
(3.4)
Where: V volume of vacuum pump’s working chamber, in m3
L internal depth of the vacuum pump casing, taken as 0.19970m
From this, the volume of the working chamber can be evaluated as a function ofθ1 for a
full rotation:
Vwc(θ1) =
V(θ1) 0< θ1 ≤ 2zπ
V(θ1)−V θ1−2zπ
2π
z < θ1≤2π
V(2π)−V θ1−2zπ
2π < θ1 ≤2π+2zπ
(3.5)
Where z is the number of rotor vanes. It is assumed that there will not be a control
valve at the intake port to regulate the volume of each working chamber. Therefore filling
will cease and expansion will begin in the working chamber once the lagging vane passes
beyond the intake port. Likewise, expansion will cease and emptying will begin once the
leading vane passes beyond the exhaust port. Based on this, the expansion ratio can be
expressed by:
εexp=
V θout+2zπ
V(θin)
3.3 Analysis 29
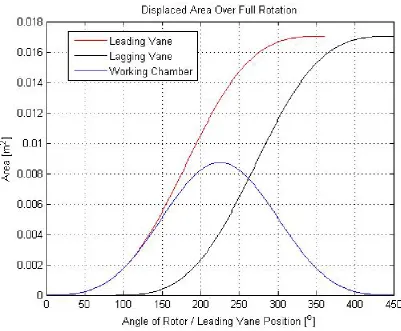
Figure 3.2: Displaced area of 4 vane vacuum pump arrangement
Figure 3.2 illustrates the changing area displaced by the leading vane, the lagging vane
and the working chamber of a 4-vane variation of the vacuum pump.
Fluid
Assuming air acts like an ideal gas and follows a steady flow, isentropic expansion process
and polytropic compression process, with no leakage and negligible frictional generation,
the maximum pressure and temperature drops can be predicted with the following
equa-tions (Cengel & Boles 2011):
Vexp
V1
−k
= pexp
p1
=
Texp
T1
k−k1
3.3 Analysis 30
V2
Vexp
−n = p2
pexp
=
T2
Texp
n−n1
(3.8)
Wherek and nare the ratio of specific heats for air and an arbitrarily chosen polytropic
index, taken as 1.4 and 1.25 respectively. Any drop in air temperature during the filling
and exhaust processes were neglected.
Ignoring the effects of kinetic and potential energies, an equation for the maximum
pos-sible amount of power generated by the isentropic expansion and polytropic compression
processes can be approximated by the following derivation:
˙
Wexp
˙
m =−
Z 2
1
vdp
=cp(T1−Texp) +ηcp(Texp−T2) (3.9)
Wherecp is the specific heat capacity of air at constant pressure, taken as 1.005kJ/kg.K,
η is the isentropic compression efficiency, taken as 85%, and ˙m is the maximum possible
mass flow rate of air (i.e. flow under sonic conditions). This can be found by determining
critical properties at the valve’s throat, based on assumed initial stagnant conditions:
ρ0 =
p0
RT0
(3.10)
T∗ =T0
1 +k−1 2 M
2 1
(3.11)
ρ∗ =ρ1
1 +k−1
2 M
2 1
k−11
(3.12)
Where: M Mach number under sonic conditions, taken as 1
T0 stagnant air temperature, taken as 293K
p0 stagnant air pressure (abs), taken as 600kPa
R universal gas constant of air, taken as 287J/kg.K
Mass flow rate can then be determined by inputting the relevant values into equation (2.4).
Note that the critical area considered in this case is the control valve’s throat; with an
3.4 Results 31
using only 60% of the operating mass flow rate in power calculations to account for losses
in the system.
If the cold air exhausts before any compression begins, equation (3.8) should be ignored
and the net power generated by expansion in the motor will be simplified to:
˙
Wexp
˙
m =cp(T1−T2) (3.13)
3.4
Results
Simulations for different RVVP arrangements were run based on the previous equations.
Each of these simulations ran on the assumption that the intake gauge pressure and static
air temperature were 600kPa (or 6 bar) and 20oC respectively.
Table 3.1: MATLAB Vacuum Pump Simulation Results
vanes ∗
Port (o) ε exp
∗∗
Min. Exit ∆T (oC) W˙
exp (kW) In Exit Max 60% Press. (kPa) Max 60% Max 60%
2 40 270 1.17 1.10 461.38 17.87 10.72 0.210 0.126 10 270 1.51 1.27 292.03 44.62 26.77 0.525 0.315
4
40 270 2.14 1.47 158.49 76.83 41.93 0.916 0.550
40 225 2.41 1.63 103.49 86.87 52.12 1.021 0.613
10 270 4.39 2.02 -6.30 130.82 71.85 1.548 0.929
10 225 4.94 2.30 -26.41 138.36 83.01 1.627 0.976
6
40 270 2.91 1.69 78.64 102.00 55.50 1.220 0.732
40 210 3.66 2.01 12.50 118.71 71.23 1.396 0.838
10 270 7.82 2.51 -56.16 164.33 90.17 1.947 1.168
10 210 9.84 3.05 -72.76 175.59 105.35 2.065 1.239
∗port’s angular position using figure 3.1’s convention
∗∗gauge pressure
The exhaust air temperature will need to be well below -40oC in order to be assured of
3.5 Chapter Summary 32
results from a small sample of arrangements, reducing the exhaust air’s temperature is
most effectively accomplished by assemblies with a larger number of vanes and a smaller
intake port position. An outlet port position closer to its optimal position (i.e. at π(zz+1) rad) also improves the temperature.
As minimal effort in redesign is desired, the best theoretical performance based assemblies
to consider implementing would be those that have more than 2 vanes and intake ports
repositioned at a lesser angle to the rotor’s horizontal line of symmetry. Some of these
arrangements have a minimum output pressure well below standard atmospheric
pres-sures. If such an arrangement is adopted, a fan or pump will likely need to be employed
downstream of the vacuum pump’s exhaust port to ensure positive flow.
Assuming that the expansion process occurs very quickly is a crucial assumption when
viewing the isentropic expansion simulation results for the different arrangements. If the
shaft speed is not fast enough then these performance characteristics are not likely to
hold.
3.5
Chapter Summary
USQ are in possession of a RVVP. Given their similar geometry and assembly, it is
pre-dicted that these types of pumps can operate similarly to a RVAM when the processes
are reversed. One significant advantage gained through utilising a redesigned RVVP over
conventional RVAMs is the theoretically larger expansion ratios, particularly when the
number of vanes employed are increased and the ports are repositioned optimally. This
will see a larger portion of work extracted from the air stream, thereby reducing the
exhaust air temperature.
The performance characteristics of these different arrangements however hinge on the
assumption that shaft speed will be high enough to validate an assumption of isentropic
expansion. However the overall size of the device would likely prove to be contrary to
this assumption operating under low intake pressures. The weight of components would
Chapter 4
Methodology
4.1
Chapter Overview
This section details the methodology used in the testing of a commercially available air
motor, including the design and sizing of necessary experimental hardware, the
experi-mental set up, procedure and post processing analysis conducted. Hardware sizing and
design was all based on known operating parameters and available base equipment at
USQ’s P10 laboratory.
4.2
Experimental Design and Materials
The experimental campaign was purposed toward testing the cooling capacity of
commer-cially available air motors while operating under steady flow conditions. This was aimed
at both:
• determining whether or not readily available equipment was suitable to use in pro-viding a viable alternative to the cooling system currently in use.
4.2 Experimental Design and Materials 34
Simplifying the experimental processes, compressed air from a large vessel at ambient
temperatures steadily flows through a pressure regulator toward an open control valve
upstream of the air motor. Work is then extracted from the air by the air motor before
being discharged at it’s exhaust pressure and temperature. Several hardware components
were required to facilitate this set of experimentation conducted on the air motor rig
(AMR); most notably the air motor and work extraction device.
Note that the early rounds of preliminary testing used two thermometers for temperature
readings (see figure 4.1), however they were replaced by a single dual thermometer when
it became available.
Figure 4.1: AMR Experimental Set-up for Initial Testing. The yellow exhaust hose leads to
a volumetric reader while the black intake tube leads under the table to the acting control
4.2 Experimental Design and Materials 35
4.2.1 Theoretical Model of Fully Expanded Air
Air motor distributors openly provide their motors’ operating specifications on websites.
Although cooling is not considered their primary function, predicted drops in temperature
can be approximated knowing an air motor’s power specifications (Al-Duwaisan et al.
1999).
A rudimentary model of an air motor was developed from ideal fluid mechanics equations,
and assumed the work extraction processes would fully expand the pressurised air.
A large majority of the performance data readily available online is related to an intake
air pressure (gauge) of roughly 6 bar. This value was set as the initial pressure in the
simulation conducted (refer to Appendix B). As it was assumed that the theoretical air
motor would be able to fully expand air to atmospheric pressure at its exhaust (with no
compression occurring at all), the final pressure (abs) will be taken as 101.325kPa. An
entering air temperature of 20oC was chosen.
Table 4.1: MATLAB Air Motor Simulation Results
Quantity Value
Temperature Drop (oC) 124.42
Maximum flow speed in pipe (m/s) 0.71
Maximum mass flow rate through system (g/s) 11.71
Maximum volumetric flow rate through system (m3/min) 0.58
Max air motor expansion power (W) 1462.96
Looking at table 4.3, it can be seen that quite a significant temperature drop can be
expected from fully expanding the compressed air isentropically.
It again assumed that air acts like an ideal gas and follows a steady flow, isentropic
expansion process, with no leakage and negligible frictional generation. The maximum
possible mass flow rate of air (i.e. flow under sonic conditions) expected was determined
from critical quantities, and inputted into equation (3.13) to provide an upper limit for
4.2 Experimental Design and Materials 36
open floating ball valve’s diameter. The values obtained in this simulation were used to
compare against a number of specification sheets provided by air motor distributors. The
maximum volumetric flow rate through the system was the particular quantity chosen in
matching to the air consumption of a suitable candidate air motor.
4.2.2 Air Motor Sizing
Given that power is a function of both temperature drop and flow, higher sized air motors
typically offset their lacking expansion ratios with a greater air consumption. Therefore it
is desirable for the chosen air motor to maximise power generation through expansion. It
is also desirable to have high nominal speed to ensure expansion processes are occurring
quickly.
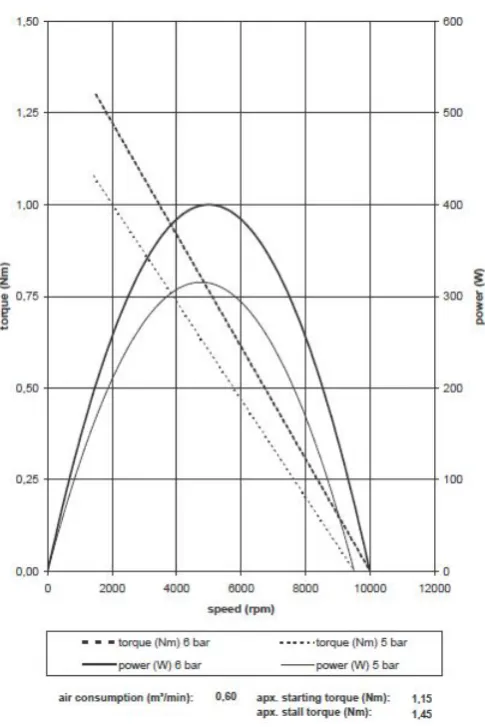
Figure 4.2: DEPRAG air motor catalogue extract (Basic Line: Air Motors from 200W to
4.2 Experimental Design and Materials 37
Knowing this, the highest rated air motor operating near 6 bar with an air consumption
of approximately 0.6m3/min was a 400W reversible model (without gearing) sourced from
DEPRAG. The particular model purchased was the 63-001F03 DEPRAG air motor (Basic Line: Air Motors from 200W to 1.2kW 2015). A supporting bracket was also added to the purchase order.
The operating specifications of this air motor were used in conjunction with equations (3.7)
and (3.9) to determine expected cooling performance characteristics. 60% of the air
motor’s power output was taken as the motor’s effective expansion power (Al-Duwaisan
et al. 1999). This provided an expected temperature drop of 20.41oC, with the expansion
power being 240W. Note that the entering air’s gauge pressure and temperature were
again assumed to be 6 bar and 20oC.
Table 4.2: Preliminary MATLAB DEPRAG Air Motor Simulation Results
Expansion Power Quantity Value
100% of rated power
Expansion Power (W) 400.00
Minimum exhaust pressure (kPa) 354.00
Minimum exhaust flow temperature (oC) -14.02
Temperature Drop (oC) 34.02
Effective Expansion Ratio 1.36
60% of rated power
Expansion Power (W) 240.00
Minimum exhaust pressure (kPa) 443.38
Minimum exhaust flow temperature (oC) -0.41
Temperature Drop (oC) 20.41
Effective Expansion Ratio 1.20
It would have been preferable to have determined these performance characteristics using
equations based on both fluid mechanics and the air motor’s geometry (similar to the
model developed in Chapter 3), however this would have required deconstructing the air
motor before any physical testing had even begun.
4.2 Experimental Design and Materials 38
Control” (Beater 2007), in which Beater refers to another study having measured
volu-metric expansion ratios up to 1.43 in non-reversible RVAMs. Substituting this value into
equation 3.7 (assuming only expansion is experienced) and using an initial temperature
of 20oC, the expected temperature drop is approximately 39oC. Note that the particular
air motor model being tested in this thesis is a reversible motor, so it can be expected
that the magnitude of temperature drop will be less than this.
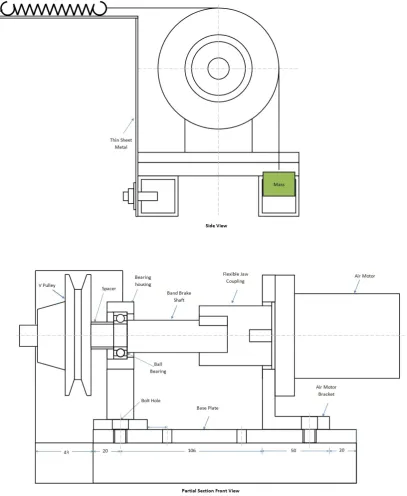
4.2.3 Dynamometer for DEPRAG Air Motor
The 400W of theoretical power available from the air motor has to be extracted by a
secondary device. The amount of power drawn will need to be measured. As a working
dynamometer was not available, a mechanical braking system was designed; specifically
a band brake due to the ease of analysis, design and construction.
Band Brake
An Aluminium 1A v-pulley with a 314” pitch diameter and a 58” bore was adopted (Blackwoods Catalogue 2014). Note that the imperial pulley happened to be more eas-ily sourced at the time, which is the only reason it was chosen over a metric pulley. A
readily available spring and a length of rubber v-section belting were also utilised in the
construction of the band brake.
4.2 Experimental Design and Materials 39
Equations (2.5) to (2.8) were arranged to determine the required actuating force, and
resulting anchoring and friction force after defining certain parameters (see am.m code in
Appendix B).
˙
Wout work output by air motor, taken as 400W
rpm nominal rotational speed of air motor, taken as 5000rpm
r radius of v-pulley, taken as 0.034m
f coefficient of friction, taken as 0.5
β half of the v-pulley’s wedge angle, taken as π9 rad (or 20o)
The length of friction material in contact with the pulley is one easily changeable
pa-rameter that significantly affects the amount of mass required. Reasonable values for the
angle of contact between the v-section belt and v-pulley would be taken as π and π 2 rad:
Table 4.3: MATLAB DEPRAG Band Brake Simulation Results
Angle of contact, φ(o) Quantity Value
180
Anchoring Force (N) 22.70
Actuating Mass (g) 23.43
Friction Force (N) 22.47
90
Anchoring Force (N) 24.98
Actuating Mass (g) 256.26
Friction Force (N) 22.47
Given that the actuating force required by a band with 180o degrees of contact is such a
small figure, a fully characterised set-up will be best served with around 90o of contact.
Several secondary components were required in order to connect the air motor to the band
brake. The more important of these were a transmission shaft, a bearing and housing,
power transmission coupling, an anchoring mechanism, and mounting plate. These were