White Rose Research Online URL for this paper:
http://eprints.whiterose.ac.uk/85366/
Version: Accepted Version
Proceedings Paper:
Ye, Cheng, Wilson, Richard C. orcid.org/0000-0001-7265-3033 and Hancock, Edwin R.
orcid.org/0000-0003-4496-2028 (2014) Entropic graph embedding via multivariate degree
distributions. In: Structural, Syntactic, and Statistical Pattern Recognition:Joint IAPR
International Workshop, S+SSPR 2014, Joensuu, Finland, August 20-22, 2014.
Proceedings. Joint IAPR International Workshop on Structural, Syntactic, and Statistical
Pattern Recognition, S+SSPR 2014, 20-22 Aug 2014 Lecture Notes in Computer Science
(including subseries Lecture Notes in Artificial Intelligence and Lecture Notes in
Bioinformatics) . Springer-Verlag , GBR , pp. 163-172.
https://doi.org/10.1007/978-3-662-44415-3_17
[email protected] https://eprints.whiterose.ac.uk/
Reuse
Items deposited in White Rose Research Online are protected by copyright, with all rights reserved unless indicated otherwise. They may be downloaded and/or printed for private study, or other acts as permitted by national copyright laws. The publisher or other rights holders may allow further reproduction and re-use of the full text version. This is indicated by the licence information on the White Rose Research Online record for the item.
Takedown
If you consider content in White Rose Research Online to be in breach of UK law, please notify us by
Entropic Graph Embedding via Multivariate
Degree Distributions
Cheng Ye, Richard C. Wilson and Edwin R. Hancock
Department of Computer Science, University of York, York, YO10 5GH, UK.
Email:{cy666, richard.wilson, edwin.hancock}@york.ac.uk
Abstract. Although there are many existing alternative methods for
using structural characterizations of undirected graphs for embedding, clustering and classification problems, there is relatively little literature aimed at dealing with such problems for directed graphs. In this pa-per we present a novel method for characterizing graph structure that can be used to embed directed graphs into a feature space. The method commences from a characterization based on the distribution of the von Neumann entropy of a directed graph with the in and out-degree con-figurations associated with directed edges. We start from a recently de-veloped expression for the von Neumann entropy of a directed graph, which depends on vertex in-degree and out-degree statistics, and thus obtain a multivariate edge-based distribution of entropy. We show how this distribution can be encoded as a multi-dimensional histogram, which captures the structure of a directed graph and reflects its complexity. By performing principal components analysis on a sample of histograms, we embed populations of directed graphs into a low dimensional space. Fi-nally, we undertake experiments on both artificial and real-world data to demonstrate that our directed graph embedding method is effective in distinguishing different types of directed graphs.
Keywords: directed graph embedding, von Neumann entropy, entropy
distribution
1
Introduction
There has been a considerable body of work aimed at extracting features from undirected graphs which reflect their structure and complexity. With such fea-tures to hand, especially multi-dimensional ones, then problems such as graph embedding, clustering and classification can be addressed using standard ma-chine learning and pattern recognition techniques. Unfortunately, there is very little work on the corresponding problems for directed graphs. This is unfortu-nate since many of the most common networks structures, e.g. the World Wide Web, exist in the form of directed graphs.
features that can be used to characterize the structure of directed graphs, and hence render them amenable to embedding, clustering and classification. The starting point is a recent result where we have shown how to compute the von Neumann entropy for a directed graph using the configurations of in and out-degrees on directed edges.
1.1 Related Literature
Quantifying the intrinsic complexity of undirected graphs is a problem of fun-damental practical importance in network analysis and pattern recognition. A good recent review of the state of the art can be found in the collection of pa-pers edited by Dehmer and Mowshowitz [1]. Moreover, the entropy measures have also been shown to be an effective tool for representing the complexity in graph structure. Han et al. [2] have shown how to approximate the calculation of von Neumann entropy in terms of simple degree statistics rather than needing to compute the normalized Laplacian spectrum.
However, while the problem of computing the entropy of undirected graphs is well studied, the literature on directed graphs is rather limited. One recent exception is the work of Berwanger et al. [3], who have proposed a new parameter for the complexity of infinite directed graphs by measuring the extent to which cycles in graphs are intertwined.
We now turn our attention to embedding methods, which has become a topic of considerable interest for characterizing patterns and graphs in recent years. Broadly speaking, with different choices of graph structure characteristics, there are many existing alternative measures for embedding undirected graphs into fea-ture vectors. An interesting method is provided by Ren et al. [4], who have used the polynomial coefficients determined by the Ihara zeta function to construct a feature vector, which shows good performance in graph clustering. Moreover, feature vectors can also be derived by embedding graphs into a feature space based on dissimilarity embedding [5]. Unfortunately, there are relatively few corresponding methods developed for embedding directed graphs into a feature space. One exception is the work proposed by Chen et al. [6], who have sug-gested a directed graph embedding method by preserving the local information of vertices in a directed graph. Similarly, directed graph embedding can also be obtained by retaining the information of directionality of the graph [7].
1.2 Contribution
Entropic Graph Embedding via Multivariate Degree Distributions 3
and out-degrees of the two vertices defining a directed edge. This leads us to a four-dimensional characterization of directed graph structure, which depends on the distribution of entropy with the in and out-degrees of pairs of vertices con-nected by a directed edge. We represent this distribution by a four-dimensional histogram, which can be encoded as a long-vector for the purposes of analysis. To curb the size of the histogram, we show how to requantize the bin-contents using quantiles of the four cumulative degree distributions.
2
Graph Embedding via Von Neumann Entropy
Distribution
In this section, we start from an approximation of the von Neumann entropy of a directed graph [8], and quantify the entropy associated with each directed edge. We show that this entropy is determined by the in and out-degrees of the start and end vertices connected by a directed edge. Based on this observation we explore the multivariate distribution of directed edge entropy with the dif-ferent combinations of vertex in and out-degrees that define edges in a graph. In practice this distribution can be computed by constructing a multi-dimensional histogram whose bins are indexed by the in and out-degrees of the connected vertices and whose contents accumulates the entropy contributions over the di-rected edges in the graph. The contents of the histogram can be represented by a multi-dimensional array whose contents can be encoded as a long-vector, which serves as a feature vector for the graph.
One of the problems that potentially limits this approach is that the vertex degree is unbounded. Hence, the size of histogram can become large. Moreover, it can become populated by a large number of empty bins. This renders the analysis of the feature vector unstable. In order to keep the vector length constant and reduce the number of empty bins, we requantize the degree bins of the histogram using quantiles of the cumulative distribution function (CDF). Specifically, we determine the m-quantiles, which divides the ordered vertex degree data into
m essentially equal-sized parts. This allows us to relabel each vertex with two quantile labels (1,2, . . . , m), one for in-degree and the second for out-degree. As a result, the length of our proposed feature vector is not affected by the variance of the degree distribution.
2.1 Edge-Based Local Entropic Measure
SupposeG(V, E) is a directed graph with vertex setV and edge setE⊆V ×V, then the adjacency matrixA is defined as follows
Auv =
1 if (u, v)∈E
0 otherwise (1)
The in-degree and out-degree of vertexuare
dinu =
X
v∈V
Avu doutu =
X
v∈V
Recently, commencing from Passerini and Severini’s work [9], Ye et al. [8] have extended the calculation of von Neumann entropy from undirected graphs to directed graphs, using Chung’s definition of the normalized Laplacian of a directed graph [10], with the result that
HV ND =
1 2|V|
X
(u,v)∈E
din
u
din
v dout
2
u
+ X
(u,v)∈Eb
1
dout
u doutv
(3)
whereEb ={(u, v)|(u, v)∈E and (v, u)∈E} is the set of bidirectional edges.
In particular, if the cardinality ofEb is very small (|Eb| ≪ |E|), i.e. a graph
is strongly directed (SD), this expression can be simplified one step further by ignoring the summation overEb in Eq.(3),
HV NSD =
1 2|V|
X
(u,v)∈E
din
u
din
v dout
2
u
(4)
These approximations sum the entropy contribution from each directed edge, and these are based on the in and out-degree statistics of the directed edge. In other words we can compute a normalized local entropy measure for each directed edge. Specifically, for an edge (u, v)∈E, we compute
Iuv=
din
u
2|E||V|din v dout
2
u
(5)
as the entropy contribution. If this edge is bidirectional, i.e. (u, v)∈Eb, then we
add an addition entropy contribution
Iuv′ =
1 2|Eb||V|doutu doutv
(6)
This local measure represents the entropy associated with each directed edge since for arbitrary directed graphs, we haveP
(u,v)∈EIuv+P(u,v)∈EbI
′
uv =HV ND
and for strongly directed graphs, we also haveP
(u,v)∈EIuv=HV NSD. Moreover,
this measure avoids the bias caused by graph size, which means that it is the edge entropy contribution determined by the in and out-degree statistics, and neither the vertex number or edge number of the graph that distinguishes a directed edge.
2.2 Feature Vector Extracted from Entropy Distribution
Our directed graph characterization is based on the statistical information con-verged by the distribution of directed edge entropy with the in and out-degrees of the start and end vertices. We represent this distribution of entropy using a four-dimensional histogram over the in and out-degrees of the two vertices.
Entropic Graph Embedding via Multivariate Degree Distributions 5
vertices which have been sorted according to in-degree (or out-degree) in the sequence din
1 ≤din2 ≤ · · · ≤ d|inV|. LetP(X =d
in
i ) be the in-degree probability
distribution of the graph. The corresponding cumulative distribution function for the in-degree is given by
FX(dini ) =P(X ≤d
in i )
where i= 1,2, . . . ,|V|. This function describes the probability that a given in-degreeX takes on a value less than or equal todin
i .
Quantiles are intervals of equal size over the cumulative distribution function. They divide the ordered data din1 , din2 ,· · · , din|V| into a number of equal-sized data subsets. Since vertex degree is always a non-negative integer, the quantiles can thus be viewed as new quantization of the degree based on its statistical distribution. We define our degree quantiles over the cumulative distribution of degree for the entire sample of graphs under study, and produce requantized versions of the individual entropy histograms for each individual graph. Suppose the number of quantiles in each dimension of the degree distribution is fixed to be m. Then, for example, the m-quantiles of the in-degree distribution can be obtained as follows
Qj = argmin din
i
FQj(d
in i )−
j m
(7)
wherei= 1,2, . . . ,|V|andj= 1,2, . . . , m. It is clear that these degree quantiles satisfyQ1≤Q2≤ · · · ≤Qmand in fact,Qm=din|V|.
With the sample degree quantiles to hand, we assign each vertex degree quantile labels. We first examine the original in-degreedin
u of a vertex u, if dinu
satisfies the condition that Qk−1 < dinu ≤ Qk, then its in-degree quantile is
qin
u =k. The corresponding out-degree quantile labels can also be obtained in
the same manner. Since all the vertices in the graph have in-degree and out-degree quantile labels ranging from 1 to m, we can then simply construct the directed edge entropy histogram whose size in each dimension is fixed tom. The histogram is stored as a four-dimensional array.
To do this, we first construct am×m×m×m array M whose elements represent the histogram bin-contents, and whose indices represent the degree quantile labels of the vertices. For instance, the elementM(1,2,3,4) accumulates the entropy contribution for all the directed edges starting from vertices with out-degree quantile label 1 and in-degree quantile label 2, pointing to vertices with out-degree quantile label 3 and in-degree quantile label 4. We then compute the bin-contents by summing the directed edge entropy contributions over the sample graph. The histogram bins contain all directed edges having the same quantile label combinations. We store the accumulated sum in the corresponding element of arrayM. The elementwise accumulation is formally given as
Mijkl =
X
qoutu =i,quin=j qoutv =k,qvin=l
(u,v)∈E
din
u
2|E||V|din v doutu 2
If the graph contains bidirectional edges, we additionally accumulate the follow-ing quantity
Mijkl′ =
X
qout
u =i,qinu =j
qout
v =k,qinv =l
(u,v)∈Eb
1
2|Eb||V|doutu doutv
(9)
wherei, j, k, l= 1,2, . . . , m. To extract a feature vector fromM, we can simply list all the elements in the array, with the result that
v= (M1111, M1112,· · ·, M111m, M1121, M1122,· · · , Mmmmm)T (10)
Clearly, this feature vector has length m4.
It is worth pausing to consider the case of strongly directed graphs. For such graphs, from Eq.(4) it is clear that directed edge entropy does not depend ondout
v .
As a result the dimensionality of the corresponding histogram can be reduced from four to three by ignoring the third indexkinMijkl (Eq.(8)). This leads to
a new feature vector with length m3. In the following discussion, to distinguish between these two kinds of feature vectors, we name the former full-form (FF) while the latter strongly-directed (SD).
When accumulated in this way we effectively count directed edges with the same configurations of degree quantile labels, and weight them according to their entropy. If the different quantile labels were independent, we would expect a uniform histogram. However, structure in the individual sample graphs due to preferred combinations of vertex in-degree and out-degree will give rise to a non-uniform distribution. To some extent, the quantization of the distribution of entropy with degree according to quantile labels, may dilute this structure due to merging adjacent degree bins. However, the directed edge entropy contribution is based on the original vertex in and out-degree statistics, and them-quantiles play a role in diminishing the bias caused by different populations of directed graphs. Therefore our proposed representation can still be effective in capturing statistical information concerning the local structural properties in the graph. By embedding graphs into a space spanned by feature vectors, it provides a theoretically principled and efficient tool for graph characterization tasks, which captures the graph characteristics at both the statistical and structural levels.
3
Experiments and Evaluations
Entropic Graph Embedding via Multivariate Degree Distributions 7
3.1 Datasets
We commence by giving a brief overview of the datasets used for experiments in this paper. We use three different datasets, the first one is synthetically generated artificial networks, while the other two are extracted from real-world systems.
Artificial Data: Contains a large number of directed graphs which are randomly generated according to a) the classical Erd˝os-R´enyi model, b) the “small-world” model, and c) the “scale-free” model. The different graphs in the database are created using a variety of model parameters, e.g. the graph size and the vertex connection probability in the Erd˝os-R´enyi model, the edge rewiring probability in the “small-world” model and the number of added connections at each time step in the “scale-free” model.
COIL Data: Contains object recognition data collected by Nene et al. [11], in which each 3D object consists of 72 images collected from equally spaced changes in viewing direction over 360 degrees. For each image, we establish a 3-nearest neighbour graph on the extracted feature points, i.e. each feature point have three directed edges going to its nearest neighbour points, thus the graph is directed and the out-degree of all vertices is 3. There are two subsets in this database, one contains the directed graphs extracted from 4 different 3D objects while the other contains graphs from 8 objects.
Protein Data: Is extracted from the protein database previously used by Riesen and Bunke [12]. It consists of over 200 graphs, representing proteins la-belled with their corresponding enzyme class labels from the BRENDA enzyme database. The database consists of six classes (labelled EC 1, . . . ,EC 6), which represent proteins out of the six enzyme commission top level hierarchy (EC classes). The proteins are converted into graphs by first replacing the secondary structure elements of a protein with vertices, and then constructing a 3-nearest neighbour graph for the secondary structure elements. The graphs are thus di-rected.
3.2 Graph Clustering Performance
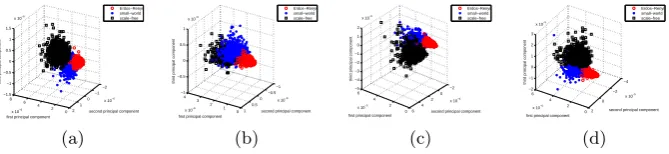
To investigate the clustering performance of our proposed directed graph charac-terization, we perform principle component analysis (PCA) on both FF feature vectors and SD feature vectors extracted from the randomly generated graphs in the Artificial Data. These feature vectors are long-vectors formed by concatenat-ing the elements of the four and three-dimensional histograms respectively. Here we select different parameter settings to generate 500 normal directed graphs and 500 additional strongly directed graphs for each of the three random graph models, with graph size ranged between 100 and 150. Moreover, in all the ex-periments in this section, we choose the number of quantiles m= 3, giving all the FF feature vectors with a constant length m4 = 81, while for SD feature
vectors, the length ism3= 27.
some clear separation between each other. However in Fig.1(b), which is the plot of SD feature vectors extracted from normal directed graphs, the “small-world” graphs and “scale-free” graphs show some overlap. This suggests the FF feature vectors are efficient in distinguishing any normal directed graphs while the SD feature vectors are effective only for strongly directed graphs, which is an expected result. Therefore in the following experiments we use the FF feature vectors in our analysis.
0 2 4 6 8 x 10⁻⁶
−2 −1 0 1 2
x 10−6
−1.5 −1 −0.5 0 0.5 1 1.5 x 10⁻⁶
second principal component first principal component
third principal component
Erdos−Renyi small−world scale−free (a) 0 1 2 3 4 x 10⁻⁶
−1 −0.5 0 0.5 1
x 10−6
−1 −0.5 0 0.5 1 x 10⁻⁶
second principal component first principal component
third principal component
Erdos−Renyi small−world scale−free (b) 0 2 4 6 x 10⁻⁵
−2 0 2 4 6
x 10−5
−5 −4 −3 −2 −1 0 1 2 x 10⁻⁵
second principal component first principal component
third principal component
Erdos−Renyi small−world scale−free (c) 0 2 4 6 x 10⁻⁵
−4 −2 0 2
x 10−5
−2 −1 0 1 2 3 x 10⁻⁵
second principal component first principal component
third principal component
Erdos−Renyi small−world scale−free
[image:9.595.139.474.225.302.2](d)
Fig. 1.Clustering performance for random graphs using PCA: a) FF feature vectors
extracted from normal directed graphs; b) SD feature vectors extracted from normal directed graphs; c) FF feature vectors extracted from SD graphs; d) SD feature vectors
extracted from SD graphs. Red: Erd˝os-R´enyi graphs; blue: “small-world” graphs; black:
“scale-free” graphs.
3.3 Graph Classification Results
To take this analysis one step further, we evaluate the classification performance of our method on the graphs in COIL DATA and Protein Data, using standard vector-based clustering and classification algorithms. In the following evaluation, we perform the 10-fold cross-validation using two classifiers, namely support vec-tor machine (SVM) classifier associated with the sequential minimal optimization (SMO) [13] and the Pearson VII universal kernel (Puk), and k-nearest neighbour (kNN) classifier. All the SMO-SVM and kNN parameters are optimized for each method on a Weka platform, and all experiments are performed on an Intel(R) Core(TM) i7-3770 CPU @ 3.40 GHz processor, with 8 GB memory.
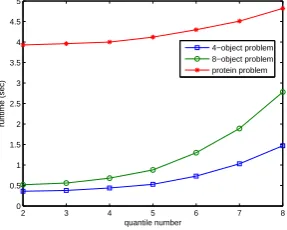
In Fig.2 we report the average classification rates of 10 runs for both SVM and kNN classifiers as a function of quantile numberm on three different datasets, including the 4-object data and 8-object data in COIL Data and Protein Data. Figure 3 gives the relationship between the average runtime and the quantile number of the experiments on these datasets.
Entropic Graph Embedding via Multivariate Degree Distributions 9
2 3 4 5 6 7 8
90 91 92 93 94 95 96 97 98 99
quantile number
classification rate (%)
SVM knn
(a)
2 3 4 5 6 7 8
46 48 50 52 54 56 58 60 62
quantile number
classification rate (%)
SVM knn
(b)
2 3 4 5 6 7 8
20 25 30 35 40 45 50 55 60 65
quantile number
classification rate (%)
SVM knn
[image:10.595.144.472.120.218.2](c)
Fig. 2. Average classification rates for both SVM and kNN classifiers with different
quantile numbers on datasets: a) 4-object data; b) 8-object data and c) Protein Data. Square: SVM classifier; circle: kNN classifier.
2 3 4 5 6 7 8
0 0.5 1 1.5 2 2.5 3 3.5 4 4.5 5
quantile number
runtime (sec)
4−object problem 8−object problem protein problem
Fig. 3.Average experimental runtime with various quantile numbers for different
clas-sification problems. Square: 4-object problem; circle: 8-object problem; star: protein problem.
[image:10.595.234.378.292.407.2]both accurate and computationally efficient in clustering and classifying directed graphs when the appropriate parameters are selected.
4
Conclusion
In this paper we have suggested a novel and effective method for directed graph characterization based on the multivariate distribution of local von Neumann entropy contribution with vertex in-degree and out-degree. This provides a com-plexity level characterization of graph structure based on the statistical infor-mation residing edge degree distribution. By representing graphs using feature vectors that encode the entropy distribution, both clustering and classification can be addressed using standard pattern recognition and machine learning tech-niques. We have undertaken experiments to demonstrate that our method is both accurate and computationally efficient in dealing with both artificial and real-world data. In the future, we intend to explore kernels defined over the inner products of our entropy distribution feature vectors.
References
1. Dehmer, M., Mowshowitz, A., Emmert-Streib, F.: Advances in Network Complex-ity. Wiley-Blackwell. (2013)
2. Han, L., Escolano, F., Hancock, E., Wilson, R.: Graph characterizations from von
neumann entropy. Pattern Recognition Letters33(2012) 1958–1967
3. Berwanger, D., Gradel, E., Kaiser, L., Rabinovich, R.: Entanglement and the
complexity of directed graphs. Theoretical Computer Science.463(2012) 2–25
4. Ren, P., Wilson, R., Hancock, E.: Graph characterization via ihara coefficients.
IEEE Transactions on Neural Networks22(2011) 233–245
5. Bunke, H., Riesen, K.: Improving vector space embedding of graphs through feature
selection algorithms. Pattern Recognition44(2010) 1928–1940
6. Chen, M., Yang, Q., Tang, X.: Directed graph embedding. IJCAI (2007) 2707–2712
7. Perrault-Joncas, D., Meli˘a, M.: Directed graph embedding: an algorithm based
on continuous limits of laplacian-type operators. Advances in Neural Information
Processing Systems24(2011) 990–998
8. Ye, C., Wilson, R., Comin, C., Costa, L.d.F., Hancock, E.: Entropy and hetero-geneity measures for directed graphs. SIMBAD (2013) 219–234
9. Passerini, F., Severini, S.: The von neumann entropy of networks. Inthernational Journal of Agent Technologies and Systems (2008) 58–67
10. Chung, F.: Laplacians and the cheeger inequailty for directed graphs. Annals of
Combinatorics.9(2005) 1–19
11. Nene, A., Nayar, S., Murase, H.: Columbia object image library (coil-20). Technical
ReportFebruary(CUCS-005-96) (1996)
12. Riesen, K., Bunke, H.: Iam graph database repository for graph based pattern recognition and machine learning. In: Structural, Syntactic, and Statistical Pattern Recognition. Volume 5342. (2008) 287–297