White Rose Research Online eprints@whiterose.ac.uk
Universities of Leeds, Sheffield and York
http://eprints.whiterose.ac.uk/
This is an author produced version of a paper published in Cancer Causes Control.
White Rose Research Online URL for this paper:
http://eprints.whiterose.ac.uk/75577/
Published paper:
Aune, D, Chan, DS, Vieira, AR, Navarro Rosenblatt, DA, Vieira, R, Greenwood,
DC, Kampman, E and Norat, T (2013) Red and processed meat intake and risk
of colorectal adenomas: a systematic review and meta-analysis of epidemiological studies. Cancer Causes Control, 24 (4). 611 - 627.
Red and processed meat intake and risk of colorectal adenomas: a
systematic review and meta-analysis of epidemiological studies.
Dagfinn Aune1, Doris S.M. Chan1, Ana Rita Vieira1, Deborah A. Navarro Rosenblatt1, Rui Vieira1, Darren C. Greenwood2, Ellen Kampman3, Teresa Norat1.
Affiliations
1
Department of Epidemiology and Biostatistics, Imperial College, London, United
Kingdom
2
Biostatistics Unit, Centre for Epidemiology and Biostatistics, University of Leeds, Leeds,
United Kingdom
3
Division of Human Nutrition, Wageningen University and Research Centre, Wageningen,
The Netherlands
Correspondence and requests for reprints to: Mr. Dagfinn Aune, Department of
Epidemiology and Biostatistics, School of Public Health, Imperial College London, St.
Mary's Campus, Norfolk Place, Paddington, London W2 1PG, UK.
Telephone: +44 (0) 20 7594 8478
Fax: +44 (0) 20 7594 0768
E-mail: d.aune@imperial.ac.uk
E-mail co-authors:
Doris S.M. Chan d.chan@imperial.ac.uk
Ana Rita Vieira a.vieira@imperial.ac.uk
Deborah A. Navarro Rosenblatt d.navarro-rosenblatt@imperial.ac.uk
Rui Vieira r.vieira@imperial.ac.uk
Darren C. Greenwood D.C.Greenwood@leeds.ac.uk
Ellen Kampman Ellen.Kampman@wur.nl
Abstract
Background: Current evidence indicates that red and processed meat intake increases the
risk of colorectal cancer, however, the association with colorectal adenomas is unclear.
Objective: To conduct a systematic review and meta-analysis of epidemiological studies of
red and processed meat intake and risk of colorectal adenomas.
Design: PubMed and several other databases were searched for relevant studies up to 31st of December 2011. Summary relative risks were estimated using a random effects model.
Results: Nineteen case-control studies and seven prospective studies were included in the
analyses. The summary relative risk (RR) per 100 g/d of red meat was 1.29 (95% CI: 1.18,
1.41, I2=0%, n=16) for all studies combined, 1.20 (95% CI: 1.06-1.36, I2=0%, n=6) for prospective studies and 1.38 (95% CI: 1.18-1.62, I2=18%, n=10) for case-control studies. The summary RR per 50 g/d of processed meat intake was 1.29 (95% CI: 1.09, 1.51, I2=26%, n=10) for all studies combined, 1.45 (95% CI: 1.10-1.90, I2=0%, n=2) for prospective studies and 1.22 (95% CI: 0.99-1.51, I2=35%, n=8) for case-control studies. There was evidence of a nonlinear association between red meat (pnonlinearity<0.001) and processed meat
(pnonlinearity=0.01) intake and colorectal adenoma risk.
Conclusion: These results indicate an elevated risk of colorectal adenomas with intake of red
Key words: Red meat, processed meat, diet, colorectal adenomas, polyps, meta-analysis, the
Continuous Update Project.
Word count abstract: 213
Introduction
Colorectal cancer is the third most common cancer worldwide with 1.2 million new
cases diagnosed in 2008 (1). Colorectal cancer is thought to develop through the
adenoma-carcinoma sequence, with a stepwise progression leading to dysplastic changes in the
epithelium of the colon and rectum (2). The histologic type, size and number of adenomas
determine the risk of developing colorectal cancer (3). Screening for colorectal adenomas and
removal of such adenomas by colonoscopy is an important strategy to reduce colorectal
cancer risk (4). Although lifestyle factors are considered to be of major importance in
colorectal cancer etiology (5-9), less is known about how such factors are related to risk of
colorectal adenomas. Studying risk factors for colorectal adenomas could enhance our
understanding of the early stages of colorectal carcinogenesis.
Red and processed meat intake were judged to be convincing risk factors for
colorectal cancer in the World Cancer Research Fund/American Institute for Cancer Research
(WCRF/AICR) report “Food, Nutrition, Physical Activity and the Prevention of Cancer: A Global Perspective” from 2007 and we recently confirmed a positive association between red
and processed meat intake and colorectal cancer in an updated meta-analysis of the evidence
from prospective studies up to 2011 (9). However, the WCRF/AICR report did not find a
significant association between red or processed meat intake and colorectal adenomas, but the
number of studies assessed was modest (a total of 5 prospective studies, 4 case-control
studies) (5). A number of additional case-control (10-16) and prospective studies (17-22)
have since been published on the subject. We update the evidence as accumulated up to
December 2011 and explore whether the associations reported differed by study design and
other study characteristics. We further investigated if the association between red and
Methods
Search strategy
We updated the systematic literature review published in 2007 (5) by searching the
PubMed database from its inception up to December 2011 for studies of red and processed
meat intake and colorectal adenoma risk. Several reviewers at Wageningen University carried
out the literature search and extracted data up to end of December 2005 during the systematic
literature review for the WCRF/AICR report
(http://www.dietandcancerreport.org/cancer_resource_center/downloads/SLR/Colorectal_pol
yps_SLR.pdf). Initially several databases were used for the searches, including PubMed,
Embase, CAB Abstracts, ISI Web of Science, BIOSIS, Latin American and Caribbean Center
on Health Sciences Information, Cochrane library, Cumulative Index to Nursing and Allied
Health Literature, the Allied and Complementary Medicine Database, National Research
Register, and In Process Medline. However, as all the relevant studies were identified through
PubMed a change was made to the protocol and only PubMed was used for the updated
searches. A predefined protocol was used for the review
(http://www.dietandcancerreport.org/cup/report_overview/index.php), and includes details of
the search terms used. The search from January 2006 and up to end of December 2011 was
conducted by one of the authors (DSMC). Data was extracted by three authors (DSMC,
DANR and ARV). We also reviewed the reference lists of the relevant articles and a
previously published systematic reviews for additional studies (23;24). We followed standard
criteria for conducting and reporting meta-analyses (25).
Studies were eligible for inclusion if they were prospective or case-control studies and
presented estimates of the relative risk (such as hazard ratio, risk ratio or odds ratio) with the
95% confidence intervals. For the dose-response analysis, a quantitative measure of intake
had to be provided. When we identified duplicate publications we selected the publication
with the largest number of cases. In a few cases several papers were published from the same
study, but reported on different meat items or subgroups in the different papers and in this
case several papers from the same study were included, but each publication was only
included once in each analysis. Fifty-seven potentially relevant full text publications
(10-22;26-69) were identified. We excluded eight duplicate publications (21;31;46;49-53).
Additional publications that did not report on red or processed meat intake (54;55;57-65), or
reported only on serrated polyps (66), or a combined adenoma and cancer outcome
(neoplasia) (48) or adenoma recurrence (67-69) were also excluded. For the dose-response
analysis we further excluded three publications because there were only two categories of
exposure (14;37) or intake was not quantified (32). We used data from a previous publication from the Nurses’ Health study (34) in the dose-response analysis because the most recent
publication only provided a high vs. low comparison (18). For the subgroup analysis by
adenoma size we used data from the publication by Gunter et al (30) in the analysis of red
meat because such results were not available in the original publication (26). Authors of 6
papers (10;12;14;26;29;33) were contacted for clarification of the definition of red meat and
sufficient detail was provided by 3 of these (10;29;33).
Data extraction
The following data were extracted from each study: The first author’s last name,
adenoma size when available, follow-up period, sample size, gender, age, number of cases,
dietary assessment method (type, number of food items and whether it had been validated),
meat exposure, quantity of intake, relative risks (RRs) and 95% CIs and variables adjusted for
in the analysis.
Statistical methods
We used random effects models to calculate summary RRs and 95% CIs associated
with red and processed meat intake (70). The natural logarithm of the RR from each study
was weighted by the inverse of its variance and pooled across studies. A two-tailed p<0.05
was considered statistically significant. For studies that reported results stratified by gender
(32;33), adenoma size (38) or other subgroups (10;28) we calculated a combined estimate of
the association by using a fixed effects model before including the study in the overall
analysis.
We used the method described by Greenland and Longnecker (71) to compute
study-specific slopes (linear trends) and 95% CIs from the natural logs of the RRs and CIs across
categories of red and processed meat intake. The method requires that the distribution of
cases and person-years or non-cases and the RRs with the variance estimates for at least three
quantitative exposure categories are known. We estimated the distribution of cases or
person-years in studies that did not report these. The reported median or mean level of red and
processed meat intake in each category of intake was assigned to the corresponding relative
risk for each study. For studies that reported intake by ranges we estimated the midpoint in
each category by calculating the average of the lower and upper bound. When the highest or
lowest category was open-ended it was assumed that the open-ended interval length had the
per day or week, we converted the intakes to grams of intake per day using standard units of
120 g for red meat and 50 g for processed meat (72). Results are presented per 100 g per day
for red meat and 50 g per day for processed meat. A potential nonlinear dose-response
relationship was examined using fractional polynomial models (73). We determined the best
fitting second order fractional polynomial regression model, defined as the one with the
lowest deviance. A likelihood ratio test was used to assess the difference between the
nonlinear and linear models to test for nonlinearity (73).
Statistical heterogeneity among studies was assessed by I2 which is the amount of
total variation that is explained by between-study variation and the Q test (74). We conducted
subgroup and meta-regression analyses by study characteristics to investigate potential
sources of heterogeneity. Small study bias, such as publication bias, was assessed with funnel
plots, Egger’s test (75) and with Begg’ test (76) and the results were considered to indicate
potential small study bias when p<0.10. We used the trim and fill method to assess the
potential influence of small study bias on the results (77). We also excluded small studies
with <100 cases from the analyses to assess whether they explained the small study bias. We
conducted sensitivity analyses excluding one study at a time to explore whether the results
were robust to the influence of single studies. Results from these sensitivity analyses are
presented excluding the two studies with the most positive and negative influence on the
summary estimate.
Stata version 10.1 software (StataCorp, College Station, TX, USA) was used for the
Results
Nineteen case-control studies (24 publications) (10-16;26-30;35-45;56) and seven
cohort studies (9 publications) (17-20;22;32;33) were included in the analyses of red and
processed meat intake and colorectal adenomas (Table 1 and 2). Ten studies were from
Europe, twelve from the US, three from Asia and one from Australia. A summary of the
study characteristics of the included studies is provided in Table 1 and 2.
Red meat
Eleven case-control studies (10-16;26-28;56) and seven cohort studies
(17-20;22;32;33) investigated red meat intake and colorectal adenomas and included 21493 cases
among 234451 participants. Some studies included processed red meat in the red meat
variable (Table 1 and Table 2). The summary RR for high vs. low intake was 1.22 (95% CI:
1.11-1.34), with moderate heterogeneity, I2=46% and pheterogeneity=0.02 (Supplementary Figure
1a). In the dose-response analysis the summary RR was 1.29 (95% CI: 1.18-1.41, I2=0%, pheterogeneity=0.51) per 100 g/d (Figure 1a). The summary RR for prospective studies was 1.20
(95% CI: 1.06-1.36, I2=0%, pheterogeneity=0.97) and it was 1.38 (95% CI: 1.18-1.62, I2=18%,
pheterogeneity=0.28) for case-control studies (Figure 1a), but there was no evidence of
heterogeneity by study design, pheterogeneity=0.17 (Table 3). In sensitivity analyses excluding
the studies with the most influence on the summary estimate the summary RR ranged from
1.22 (95% CI: 1.11-1.35) when the study by Fu et al (16) was excluded to 1.31 (95% CI:
1.19-1.45) when the study by Ferrucci et al (22) was excluded. There was no indication of
between red meat intake and colorectal adenoma risk appeared to be nonlinear,
pnonlinearity<0.001, with the steepest increase in risk at the lower levels of intake (Figure 1b).
Further restricting the analysis to the studies that reported on fresh red meat and colorectal
adenoma risk (10;13;15-17;20;22;28;33;45;56) did not materially alter the results, the
summary RR was 1.35 (1.19-1.53, I2=0%, pheterogeneity=0.48) for all studies combined, 1.20
(95% CI: 1.00-1.44, I2=0%, pheterogeneity=0.94) for cohort studies and 1.50 (95% CI: 1.26-1.78,
I2=1%, pheterogeneity=0.42) for case-control studies.
Processed meat
Nine case-control studies (11;12;16;26;35;37-39;78) and two cohort studies (17;22)
were included in the analysis of processed meat and colorectal adenoma risk and included
5891 cases among 41107 participants. The summary RR for high vs. low intake was 1.29
(95% CI: 1.15, 1.45), with no heterogeneity, I2=18%, pheterogeneity=0.27 (Figure Supplementary
Figure 1b). The summary RR for a 50 g/d increase in the intake was 1.29 (95% CI: 1.09,
1.51), with low heterogeneity, I2=26%, pheterogeneity=0.21 (Figure 2a). The summary RR was
1.45 (95% CI: 1.10-1.90, I2=0%, pheterogeneity=0.41) for prospective studies and 1.22 (95% CI:
0.99-1.51, I2=35%, pheterogeneity=0.15) for case-control studies, with no evidence of
heterogeneity by study design, pheterogeneity=0.44. In sensitivity analyses excluding the studies
with the most influence on the summary estimate the summary RR ranged from 1.23 (95%
CI: 1.02, 1.49) when the study by Fu et al (16) was excluded to 1.37 (95% CI: 1.20, 1.57)
when the study by Benito et al (35) was excluded. There was no indication of small study
effects with Egger’s test, p=0.25, or with Begg’s test, p=0.37. The association between
processed meat intake and colorectal adenoma risk appeared to be nonlinear, pnonlinearity=0.01,
Subgroup, sensitivity and meta-regression analyses
In subgroup analyses of red meat intake and colorectal adenoma, there were positive
associations across all strata and heterogeneity between subgroups was only indicated
between studies that adjusted or not for dairy or calcium intake (pheterogeneity=0.07), with a
slightly weaker, but still significant association with such adjustment (Table 3). When we
further restricted the subgroup analyses to prospective studies the results for red meat
persisted in all strata of subgroups with adjustment for different confounding factors
(Supplementary Table 1 and 2). In the analyses of processed meat and colorectal adenomas
there was significant heterogeneity in subgroups defined by geographic location,
pheterogeneity=0.04, number of cases, pheterogeneity=0.04 and adjustment for energy intake,
pheterogeneity=0.03 (Table 3). The association was restricted to American studies, and was more
pronounced in studies with a large number of cases and in studies that adjusted for energy
intake. Exclusion of one study (37) that reported unadjusted results from the high vs. low
analysis of processed meat intake and colorectal adenoma did not change the conclusions,
summary RR=1.27 (95% CI: 1.14, 1.41, I2=11%, pheterogeneity=0.34) (the study was not
included in the dose-response analysis). We also conducted nonlinear dose-response analyses
stratified by study design (Supplementary Figure 2a and 2b), but the conclusions were
similar, with a weaker effect for red meat in prospective studies and a stronger effect of
processed meat in prospective studies compared with case-control studies.
Because adenomas often develop without symptoms it is possible that some of the
included studies may have included prevalent adenoma cases if no colonoscopy was
conducted at baseline. For this reason we conducted an additional sensitivity analysis among
which included only incident adenoma cases (17;20;22;34). The summary RR for was 1.18
(95% CI: 1.01-1.37, I2=0%, pheterogeneity=0.95), similar to the overall analysis.
For the case-control studies we restricted the analysis to the two studies that reported
that diet was assessed before colonoscopy (before the participants knew their case-control
status) (11;16) and the summary RR was 1.69 (95% CI: 1.34, 2.12).
High vs. low intake of beef (summary RR=1.40 (95% CI: 1.18, 1.67, I2=19%,
pheterogeneity=0.28) (16;26;29;41-44;79), hamburgers (summary RR=1.23, 95% CI: 1.06, 1.43,
I2=0%, pheterogeneity=0.67) (16;17;44;45) and pork (summary RR=1.55, 95% CI: 1.05, 2.30,
I2=37%, pheterogeneity=0.20) (16;44;79), but not bacon (summary RR=1.12, 95% CI: 0.99, 1.27,
I2=0%, pheterogeneity=0.58) (16;39;45), was also associated with significantly increased risk of
colorectal adenomas (Table 3).
High vs. low red meat intake was associated with an increased risk of large adenomas (≥1 cm diameter), summary RR=1.57 (95% CI: 1.12, 2.19, I2
=7%) (17;19;30;31), but not
with small sized adenomas (<1 cm), summary RR=0.97 (95% CI: 0.66, 1.42, I2=0%) (17;19), although there was no heterogeneity between subgroups, pheterogeneity=0.13. The association
was similar for advanced, summary RR=1.38 (95% CI: 1.04, 1.84, I2=0.31) and nonadvanced adenomas, summary RR=1.31 (95% CI: 1.10, 1.57, I2=0.31) (10;16). Because one of the criteria for advanced adenomas is a large adenoma size and because of the limited number of
studies in the analyses by adenoma size and stage we conducted an additional analysis where
we combined studies that reported results for large and advanced adenomas and studies that
reported on small and non-advanced adenomas. The summary RRs were 1.47 (95% CI: 1.18,
1.81) for advanced or large adenomas (10;16;17;19;30;31) and 1.24 (95% CI: 1.05, 1.46) for
subgroups, pheterogeneity=0.26. Similar analyses were not possible for processed meat because
of a lack of studies.
Discussion
In this meta-analysis we found an increased risk of colorectal adenomas with higher
intake of red and processed meat intake and the positive associations appeared to be
consistent across strata in subgroup analyses. Although there was no heterogeneity by study
design, the results for red meat appeared to be stronger in case-control studies than in cohort
studies, while for processed meat the opposite was observed.
The findings of this meta-analysis are consistent with the previously reported
increased risks of colorectal cancer associated with red and processed meat intake (5;9) and
provide further support for an association between red and processed meat intake and
colorectal carcinogenesis. Two previous meta-analyses did not find a significant association
between intake of red and processed meat and colorectal adenomas, but were limited by a low
number of studies included in the analyses (5;23). However, with a total of 26 studies
accumulated up to 2011 we found significant associations between both red and processed
meat and subtypes, such as beef, pork and hamburger and increased risk of colorectal
adenomas. A few additional studies did not find an association between meat intake and
colorectal adenoma recurrence (67;69;80), but it is possible that risk factors differ for
incidence and recurrence of adenomas.
Our meta-analysis may have several limitations that deserve comment. High intake of
red and processed meat is oftentimes associated with other risk factors such as low intake of
fiber, lower physical activity, higher prevalence of obesity, smoking and high alcohol intake
found that the results persisted across subgroups with adjustment for these and other potential
confounders. In addition, there was little evidence that the results differed whether or not
confounding factors had been adjusted for or not. However, we cannot exclude the possibility
that residual confounding could partly explain the results. Small study effects, such as
publication bias can be a problem in meta-analyses of published literature, but we found no
evidence of small study effects in this analysis. Since we included case-control studies there
is a possibility that recall bias and selection bias partly could explain the results in such
studies. However, when we restricted the results to the two studies that assessed diet before
colonoscopy was conducted (before the subjects knew their case-control status) the results
persisted. When we restricted the analysis to prospective studies the results also persisted,
although the results were somewhat weaker for red meat. Because adenomas often develop
without symptoms a potential limitation is that some of the studies may have included
prevalent adenoma cases if a colonoscopy had not been conducted at baseline (in cohort
studies) or previously (in case-control studies). None of the case-control studies conducted
analyses restricted to subjects with a previous colonoscopy. In addition, although most of the
case-control studies asked about diet at least ≥1 year before the adenomas were detected it is
still possible that the adenomas may already have existed at the time point they were asked to
recall their diet for. However, when we restricted the analysis to the four cohort studies with
both a baseline and a follow-up colonoscopy, which included only incident adenoma cases,
the results were similar to the overall results for cohort studies for red meat.
Due to the limited number of studies reporting results for subsites within the
colorectum we did not have adequate power to clarify whether the risk differed between
colon or rectum or proximal and distal colon. Although we found that the results for red meat
did not differ by geographic location or study size, there was heterogeneity between these
colorectal adenomas was observed only in the American studies and not in the European
studies, but it is not clear what the reason for this is. It might be due to differences in the
consumption patterns, additives used for processing or a chance finding because there were
only three European studies in the analysis. The association between processed meat and
adenomas was stronger in the larger studies than in the smaller studies. In addition, we cannot
exclude the possibility that low numbers of observations at the low or high ends of the range
of intakes partly could contribute to the nonlinear observations that we observed.
Measurement error in the dietary assessment is another limitation of our results. None
of the studies included in our analysis made any corrections for measurement error.
Several mechanisms might explain an increased risk of colorectal adenoma with high
red and processed meat intakes. Heterocyclic amines and polycyclic aromatic hydrocarbons,
meat mutagens that are formed during frying and barbecuing of meats, have been shown to be
gastrointestinal carcinogens in experimental animal studies (81). These compounds can form
DNA adducts and induce genetic alterations characteristic of colorectal tumors (82). The
heme-iron content of meats may contribute to colorectal neoplasia by inducing oxidative
DNA damage (83) and by increasing endogenous formation of N-nitroso compounds (84)
which are known to be powerful multisite carcinogens (85). Red meat intake was positively
associated with risk of large adenomas, but not small adenomas, although there were few
studies in these analyses. However, when we grouped large and advanced adenomas and
small and non-advanced adenomas together the association was significant for both types, but
was somewhat stronger for the large and advanced adenomas. Large or advanced adenomas
convey a greater colorectal cancer risk than small or non-advanced adenomas (3), suggesting
that red meat intake might play a role in the progression to malignancy. However, we cannot
exclude the possibility that persons with a high intake of red and processed meat are less
estimate per 100 g/d for red meat and colorectal adenomas among cohort studies, RR=1.20
(95% CI: 1.06, 1.36, n=6) is similar to that of a recent meta-analysis (24) and is also similar
to the summary estimate that we previously reported for colorectal cancer, RR=1.17 (95% CI:
1.05, 1.31), although for processed meat the results for adenomas are stronger, summary
RR=1.45 (1.10, 1.90, n=2) for colorectal adenomas vs. 1.18 (95% CI: 1.10, 1.28, n=9) for
colorectal cancer, however, there were only 2 cohort studies in the analysis of colorectal
adenomas, thus this difference might have been due to chance (9).
Strengths of this meta-analysis include the comprehensive search strategy,
dose-response, subgroup, and sensitivity analyses. With the large number of studies and study
participants we had adequate statistical power to detect significant associations in the main
analyses.
In conclusion, we found a positive association between red and processed meat intake
and risk of colorectal adenomas. Our results provide further support that red and processed
meat intake is implicated in colorectal carcinogenesis, however, further prospective studies
are warranted.
Conflict of interest: The authors have declared no conflicts of interest.
Acknowledgement: We thank the systematic literature review team at Wageningen
University for their contributions to the colorectal adenoma database. We thank Dr. Camilla
Furu Skjelbred, Professor Elin H. Kure, Dr. Chisato Nagata for clarifying definitions of red
meat intake in their studies. The views expressed in this review are the opinions of the
authors. They may not represent the views of WCRF International/AICR and may differ from
risk. The systematic literature review team at the Wageningen University conducted the
search, data selection and data extraction up to December 2005. DSMC did the updated
literature search and study selection. DSMC, DANR and ARV did the updated data
extraction. DA conducted the statistical analyses and wrote the first draft of the original
manuscript. DCG was expert statistical advisor and contributed towards the statistical
analyses. All authors contributed to the revision of the manuscript. DA had primary
responsibility for final content. EK was PI of the SLR at Wageningen University and TN is
the PI of the Continuous Update Project. All authors had full access to all of the data in the
study. The authors declare that there are no conflicts of interest.
Funding: This work was funded by the World Cancer Research Fund (grant number
2007/SP01) as part of the Continuous Update Project (www.dietandcancerreport.org).
Reference List
1. Ferlay J, Shin HR, Bray F, Forman D, Mathers C, Parkin DM. Estimates of worldwide burden of cancer in 2008: GLOBOCAN 2008. Int J Cancer 2010;127:2893-917.
2. Leslie A, Carey FA, Pratt NR, Steele RJ. The colorectal adenoma-carcinoma sequence. Br J Surg 2002;89:845-60.
3. Atkin WS, Morson BC, Cuzick J. Long-term risk of colorectal cancer after excision of rectosigmoid adenomas. N Engl J Med 1992;326:658-62.
4. Atkin WS, Edwards R, Kralj-Hans I et al. Once-only flexible sigmoidoscopy screening in prevention of colorectal cancer: a multicentre randomised controlled trial. Lancet 2010;375:1624-33.
5. World Cancer Research Fund/American Insitute for Cancer Research. Food, Nutrition, Physical Activity and the Prevention of Cancer: a Global Perspective. Washington DC: AICR, 2007.
6. Aune D, Chan DS, Lau R et al. Dietary fibre, whole grains, and risk of colorectal cancer: systematic review and dose-response meta-analysis of prospective studies. BMJ 2011;343:d6617.
7. Aune D, Lau R, Chan DS et al. Nonlinear Reduction in Risk for Colorectal Cancer by Fruit and Vegetable Intake Based on Meta-analysis of Prospective Studies.
Gastroenterology 2011;141:106-18.
8. Aune D, Lau R, Chan DS et al. Dairy products and colorectal cancer risk: a systematic review and meta-analysis of cohort studies. Ann Oncol 2012;23:37-45.
9. Chan DS, Lau R, Aune D et al. Red and processed meat and colorectal cancer incidence: meta-analysis of prospective studies. PLoS One 2011;6:e20456. 10. Saebo M, Skjelbred CF, Brekke LK et al. CYP1A2 164 A-->C polymorphism,
cigarette smoking, consumption of well-done red meat and risk of developing colorectal adenomas and carcinomas. Anticancer Res 2008;28:2289-95.
11. Ferrucci LM, Sinha R, Graubard BI et al. Dietary meat intake in relation to colorectal adenoma in asymptomatic women. Am J Gastroenterol 2009;104:1231-40.
12. Wang H, Yamamoto JF, Caberto C et al. Genetic variation in the bioactivation pathway for polycyclic hydrocarbons and heterocyclic amines in relation to risk of colorectal neoplasia. Carcinogenesis 2011;32:203-9.
13. Northwood EL, Elliott F, Forman D et al. Polymorphisms in xenobiotic metabolizing enzymes and diet influence colorectal adenoma risk. Pharmacogenet Genomics 2010;20:315-26.
14. Ramadas A, Kandiah M. Food intake and colorectal adenomas: a case-control study in Malaysia. Asian Pac J Cancer Prev 2009;10:925-32.
15. Burnett-Hartman AN, Newcomb PA, Mandelson MT et al. Colorectal polyp type and the association with charred meat consumption, smoking, and microsomal epoxide hydrolase polymorphisms. Nutr Cancer 2011;63:583-92.
16. Fu Z, Shrubsole MJ, Smalley WE et al. Association of meat intake and meat-derived mutagen exposure with the risk of colorectal polyps by histologic type. Cancer Prev Res (Phila) 2011;4:1686-97.
17. Wu K, Giovannucci E, Byrne C et al. Meat mutagens and risk of distal colon adenoma in a cohort of U.S. men. Cancer Epidemiol Biomarkers Prev 2006;15:1120-5.
18. Cho E, Willett WC, Colditz GA et al. Dietary choline and betaine and the risk of distal colorectal adenoma in women. J Natl Cancer Inst 2007;99:1224-31.
20. Tantamango YM, Knutsen SF, Beeson WL, Fraser G, Sabate J. Foods and food groups associated with the incidence of colorectal polyps: the adventist health study. Nutr Cancer 2011;63:565-72.
21. Cross AJ, Sinha R, Wood RJ et al. Iron homeostasis and distal colorectal adenoma risk in the prostate, lung, colorectal, and ovarian cancer screening trial. Cancer Prev Res (Phila) 2011;4:1465-75.
22. Ferrucci LM, Sinha R, Huang WY et al. Meat consumption and the risk of incident distal colon and rectal adenoma. Br J Cancer 2012;106:608-16.
23. Yoon H, Benamouzig R, Little J, Francois-Collange M, Tome D. Systematic review of epidemiological studies on meat, dairy products and egg consumption and risk of colorectal adenomas. Eur J Cancer Prev 2000;9:151-64.
24. Xu X, Yu E, Gao X et al. Red and processed meat intake and risk of colorectal adenomas: A meta-analysis of observational studies. Int J Cancer 2012.
25. Stroup DF, Berlin JA, Morton SC et al. Meta-analysis of observational studies in epidemiology: a proposal for reporting. Meta-analysis Of Observational Studies in Epidemiology (MOOSE) group. JAMA 2000;283:2008-12.
26. Haile RW, Witte JS, Longnecker MP et al. A sigmoidoscopy-based case-control study of polyps: macronutrients, fiber and meat consumption. Int J Cancer 1997;73:497-502.
27. Sinha R, Chow WH, Kulldorff M et al. Well-done, grilled red meat increases the risk of colorectal adenomas. Cancer Res 1999;59:4320-4.
28. Voskuil DW, Kampman E, Grubben MJ et al. Meat consumption and meat
preparation in relation to colorectal adenomas among sporadic and HNPCC family patients in The Netherlands. Eur J Cancer 2002;38:2300-8.
29. Tiemersma EW, Voskuil DW, Bunschoten A et al. Risk of colorectal adenomas in relation to meat consumption, meat preparation, and genetic susceptibility in a Dutch population. Cancer Causes Control 2004;15:225-36.
30. Gunter MJ, Probst-Hensch NM, Cortessis VK, Kulldorff M, Haile RW, Sinha R. Meat intake, cooking-related mutagens and risk of colorectal adenoma in a sigmoidoscopy-based case-control study. Carcinogenesis 2005;26:637-42.
31. Shin A, Shrubsole MJ, Ness RM et al. Meat and meat-mutagen intake, doneness preference and the risk of colorectal polyps: the Tennessee Colorectal Polyp Study. Int J Cancer 2007;121:136-42.
32. Kahn HS, Tatham LM, Thun MJ, Heath CW, Jr. Risk factors for self-reported colon polyps. J Gen Intern Med 1998;13:303-10.
34. Chan AT, Ma J, Tranah GJ et al. Hemochromatosis gene mutations, body iron stores, dietary iron, and risk of colorectal adenoma in women. J Natl Cancer Inst
2005;97:917-26.
35. Benito E, Cabeza E, Moreno V, Obrador A, Bosch FX. Diet and colorectal adenomas: a case-control study in Majorca. Int J Cancer 1993;55:213-9.
36. Macquart-Moulin G, Riboli E, Cornee J, Kaaks R, Berthezene P. Colorectal polyps and diet: a case-control study in Marseilles. Int J Cancer 1987;40:179-88.
37. Erhardt JG, Kreichgauer HP, Meisner C, Bode JC, Bode C. Alcohol, cigarette
smoking, dietary factors and the risk of colorectal adenomas and hyperplastic polyps--a cpolyps--ase control study. Eur J Nutr 2002;41:35-43.
38. Senesse P, Boutron-Ruault MC, Faivre J, Chatelain N, Belghiti C, Meance S. Foods as risk factors for colorectal adenomas: a case-control study in Burgundy (France). Nutr Cancer 2002;44:7-15.
39. Ward MH, Cross AJ, Divan H et al. Processed meat intake, CYP2A6 activity and risk of colorectal adenoma. Carcinogenesis 2007;28:1210-6.
40. Kune GA, Kune S, Read A, MacGowan K, Penfold C, Watson LF. Colorectal polyps, diet, alcohol, and family history of colorectal cancer: a case-control study. Nutr Cancer 1991;16:25-30.
41. Sandler RS, Lyles CM, Peipins LA, McAuliffe CA, Woosley JT, Kupper LL. Diet and risk of colorectal adenomas: macronutrients, cholesterol, and fiber. J Natl Cancer Inst 1993;85:884-91.
42. Lubin F, Rozen P, Arieli B et al. Nutritional and lifestyle habits and water-fiber interaction in colorectal adenoma etiology. Cancer Epidemiol Biomarkers Prev 1997;6:79-85.
43. Breuer-Katschinski B, Nemes K, Marr A et al. Colorectal adenomas and diet: a case-control study. Colorectal Adenoma Study Group. Dig Dis Sci 2001;46:86-95. 44. Chiu BC, Gapstur SM. Changes in diet during adult life and risk of colorectal
adenomas. Nutr Cancer 2004;49:49-58.
45. Probst-Hensch NM, Sinha R, Longnecker MP et al. Meat preparation and colorectal adenomas in a large sigmoidoscopy-based case-control study in California (United States). Cancer Causes Control 1997;8:175-83.
46. Shin A, Shrubsole MJ, Rice JM et al. Meat intake, heterocyclic amine exposure, and metabolizing enzyme polymorphisms in relation to colorectal polyp risk. Cancer Epidemiol Biomarkers Prev 2008;17:320-9.
48. Lieberman DA, Prindiville S, Weiss DG, Willett W. Risk factors for advanced colonic neoplasia and hyperplastic polyps in asymptomatic individuals. JAMA
2003;290:2959-67.
49. Wu K, Hu FB, Fuchs C, Rimm EB, Willett WC, Giovannucci E. Dietary patterns and risk of colon cancer and adenoma in a cohort of men (United States). Cancer Causes Control 2004;15:853-62.
50. Sinha R, Peters U, Cross AJ et al. Meat, meat cooking methods and preservation, and risk for colorectal adenoma. Cancer Res 2005;65:8034-41.
51. Sinha R, Kulldorff M, Gunter MJ, Strickland P, Rothman N. Dietary benzo[a]pyrene intake and risk of colorectal adenoma. Cancer Epidemiol Biomarkers Prev
2005;14:2030-4.
52. Sinha R, Kulldorff M, Chow WH, Denobile J, Rothman N. Dietary intake of heterocyclic amines, meat-derived mutagenic activity, and risk of colorectal adenomas. Cancer Epidemiol Biomarkers Prev 2001;10:559-62.
53. Diergaarde B, Tiemersma EW, Braam H et al. Dietary factors and truncating APC mutations in sporadic colorectal adenomas. Int J Cancer 2005;113:126-32.
54. Almendingen K, Hofstad B, Trygg K, Hoff G, Hussain A, Vatn M. Current diet and colorectal adenomas: a case-control study including different sets of traditionally chosen control groups. Eur J Cancer Prev 2001;10:395-406.
55. Almendingen K, Hofstad B, Vatn MH. Dietary habits and growth and recurrence of colorectal adenomas: results from a three-year endoscopic follow-up study. Nutr Cancer 2004;49:131-8.
56. Wark PA, Van der KW, Ploemacher J et al. Diet, lifestyle and risk of K-ras mutation-positive and -negative colorectal adenomas. Int J Cancer 2006;119:398-405.
57. Ferrucci LM, Cross AJ, Gunter MJ et al. Xenobiotic metabolizing genes, meat-related exposures, and risk of advanced colorectal adenoma. World Rev Nutr Diet
2010;101:34-45.
58. Kato I, Tominaga S, Matsuura A, Yoshii Y, Shirai M, Kobayashi S. A comparative case-control study of colorectal cancer and adenoma. Jpn J Cancer Res 1990;81:1101-8.
59. Kono S, Shinchi K, Ikeda N, Yanai F, Imanishi K. Physical activity, dietary habits and adenomatous polyps of the sigmoid colon: a study of self-defense officials in Japan. J Clin Epidemiol 1991;44:1255-61.
60. Kono S, Imanishi K, Shinchi K, Yanai F. Relationship of diet to small and large adenomas of the sigmoid colon. Jpn J Cancer Res 1993;84:13-9.
62. Neugut AI, Garbowski GC, Lee WC et al. Dietary risk factors for the incidence and recurrence of colorectal adenomatous polyps. A case-control study. Ann Intern Med 1993;118:91-5.
63. Faivre J, Boutron MC, Senesse P, Couillault C, Belighiti C, Meny B. Environmental and familial risk factors in relation to the colorectal adenoma--carcinoma sequence: results of a case-control study in Burgundy (France). Eur J Cancer Prev 1997;6:127-31.
64. Hoshiyama Y, Kono S, Sasaba T, Shigematsu T, Kawaguchi T. Relation of Cigarette Smoking, Alcohol Use, and Dietary Habits to Colon Adenomas: A Case-Control Study in Saitama, Japan. Asian Pac J Cancer Prev 2000;1:139-46.
65. Skjelbred CF, Saebo M, Hjartaker A et al. Meat, vegetables and genetic
polymorphisms and the risk of colorectal carcinomas and adenomas. BMC Cancer 2007;7:228.
66. Wallace K, Grau MV, Ahnen D et al. The association of lifestyle and dietary factors with the risk for serrated polyps of the colorectum. Cancer Epidemiol Biomarkers Prev 2009;18:2310-7.
67. Robertson DJ, Sandler RS, Haile R et al. Fat, fiber, meat and the risk of colorectal adenomas. Am J Gastroenterol 2005;100:2789-95.
68. Tseng M, Sandler RS, Greenberg ER, Mandel JS, Haile RW, Baron JA. Dietary iron and recurrence of colorectal adenomas. Cancer Epidemiol Biomarkers Prev
1997;6:1029-32.
69. Mathew A, Sinha R, Burt R et al. Meat intake and the recurrence of colorectal adenomas. Eur J Cancer Prev 2004;13:159-64.
70. DerSimonian R, Kacker R. Random-effects model for meta-analysis of clinical trials: an update. Contemp Clin Trials 2007;28:105-14.
71. Greenland S, Longnecker MP. Methods for trend estimation from summarized dose-response data, with applications to meta-analysis. Am J Epidemiol 1992;135:1301-9. 72. Norat T, Lukanova A, Ferrari P, Riboli E. Meat consumption and colorectal cancer
risk: dose-response meta-analysis of epidemiological studies. Int J Cancer 2002;98:241-56.
73. Royston P. A strategy for modelling the effect of a continuous covariate in medicine and epidemiology. Stat Med 2000;19:1831-47.
74. Higgins JP, Thompson SG. Quantifying heterogeneity in a meta-analysis. Stat Med 2002;21:1539-58.
76. Begg CB, Mazumdar M. Operating characteristics of a rank correlation test for publication bias. Biometrics 1994;50:1088-101.
77. Duval S, Tweedie R. Trim and fill: A simple funnel-plot-based method of testing and adjusting for publication bias in meta-analysis. Biometrics 2000;56:455-63.
78. Maquart-Moulin G, Riboli E, Cornee J, Kaaks R, Berthezene P. Colorectal polyps and diet: a case-control study in Marseilles. Int J Cancer 1987;40:179-88.
79. Kune GA, Kune S, Read A, MacGowan K, Penfold C, Watson LF. Colorectal polyps, diet, alcohol, and family history of colorectal cancer: a case-control study. Nutr Cancer 1991;16:25-30.
80. Martinez ME, Jacobs ET, Ashbeck EL et al. Meat intake, preparation methods, mutagens and colorectal adenoma recurrence. Carcinogenesis 2007;28:2019-27. 81. Ohgaki H, Kusama K, Matsukura N et al. Carcinogenicity in mice of a mutagenic
compound, 2-amino-3-methylimidazo[4,5-f]quinoline, from broiled sardine, cooked beef and beef extract. Carcinogenesis 1984;5:921-4.
82. Dashwood RH, Suzui M, Nakagama H, Sugimura T, Nagao M. High frequency of beta-catenin (ctnnb1) mutations in the colon tumors induced by two heterocyclic amines in the F344 rat. Cancer Res 1998;58:1127-9.
83. Tappel A. Heme of consumed red meat can act as a catalyst of oxidative damage and could initiate colon, breast and prostate cancers, heart disease and other diseases. Med Hypotheses 2007;68:562-4.
84. Cross AJ, Pollock JR, Bingham SA. Haem, not protein or inorganic iron, is
responsible for endogenous intestinal N-nitrosation arising from red meat. Cancer Res 2003;63:2358-60.
Table 1: Case-control studies of red and processed meat intake and colorectal adenoma risk Author, publication year, country Study period
Number of cases and controls, age
Dietary assessment
Exposure Quantity RR (95% CI) Adjustment for confounders
Macquart-Moulin G et al, 1987, France
1980-1985 252 colorectal adenoma cases
238 hospital controls
Age 15-≥80 years
FFQ, 158 food items
Charcuterie ≥42.9 vs. <10 g/d 1.17 (0.71, 1.92) Age, sex, weight, calories
Kune G et al, 1991, Australia
NR 49 colorectal adenoma cases
(>1 cm diameter)
727 population controls
Mean age 68/65 years
Diet history, >300 food items
Beef, men only, large polyps
Pork, large polyps
>360 vs. ≤360 g/wk >15/>27 vs. ≤15/≤27 g/wk
2.42 (1.02, 5.76)
0.69 (0.35, 1.36)
Age, sex
Sandler RS et al, 1993, USA
1988-1990 236 colorectal adenoma cases
409 colonoscopy controls
Age ≥30 years
Validated FFQ, >100 food items
Beef
Beef
≥2.3 vs. <0.5/wk ≥2.6 vs. <0.6/wk
1.59 (0.72, 3.50)
2.07 (0.82, 5.19)
Age, alcohol intake, BMI, calories
Benito E et al, 1993, Spain
1987-1990 101 colorectal adenoma cases
144 population controls
Age ≤80 years
FFQ, 99 food items
Processed meat ≥26 vs. <4/mo 0.56 (0.29, 1.08) Age, sex, physical activity in
longest held job, rural residence
Probst-Hensch NM et al, 1997, USA
1991-1993 488 left-sided colorectal adenoma cases
488 sigmoidoscopy controls
Age 50-74 years
Validated FFQ, 126 food items
Beef, pork, lamb - main dish
Beef, pork, lamb as mixed dish
Hamburger
Bacon
>1/wk vs. <1/mo
>1/wk vs. <1/mo
>1/wk vs. <1/mo
>1/wk vs. <1/mo
1.7 (1.1, 2.5)
1.5 (1.0, 2.4)
1.1 (0.7, 1.7)
1.4 (0.9, 2.2)
Age, calories, smoking
Haile, RW et al, 1997, USA
1991-1993 488 left-sided colorectal adenoma cases
488 sigmoidoscopy controls
Age 50-74 years
Validated FFQ, 126 food items Red meat Beef Processed meat
1083 vs. 78.5 g/wk
930 vs. 42.5 g/wk
175 vs. 0 g/wk
1.62 (1.00, 2.63)
1.83 (1.12, 2.99)
1.48 (0.92, 2.39)
Age, sex, BMI, calories, physical activity, ethnicity
al, 1997,
Israel 196 colonoscopy controls
Age 21-75 years
food items duration of follow-up, energy
intake, physical activity
Sinha, R et al, 1999, USA
1994-1996 146 colorectal adenoma cases
228 colonoscopy controls
Age 18-74 years
Validated FFQ, 100 food items
Red meat (incl. processed meat)
Red meat
Red meat, left-sided adenomas
Red meat, colon adenomas
Per 10 g/d
Quintile 5 vs. 1
Per 10 g/d
Per 10 g/d
1.11 (1.03, 1.19)
2.28 (1.01, 5.16)
1.09 (1.00, 1.22)
1.10 (1.00, 1.22)
Age, sex, total calories, reason for screening, physical activity, pack-years of cigarette smoking, NSAID use Breuer-Katschins ki BB, 2001, Germany
1993-1995 182 colorectal adenoma cases
178 colonoscopy controls
182 population controls
Mean age 63.8/ 63.4/64.2 years
Validated FFQ
Beef, colonoscopy controls Beef, large polyps
Beef, small polyps
Beef, population controls Beef, large polyps
Beef, small polyps
Quartile 4 vs. 1 Quartile 4 vs. 1 Quartile 4 vs. 1 Quartile 4 vs. 1 Quartile 4 vs. 1 Quartile 4 vs. 1
3.10 (1.46, 6.43) 1.36 (0.45, 4.13) 4.24 (1.24, 12.7) 1.29 (0.47, 3.54) 2.05 (0.74, 5.65) 2.08 (0.80, 5.44)
Age, sex, energy, relative weight, social class
Senesse P et al, 2002, France
1985-1990 154/208 small/large
colorectal adenoma cases
427 colonoscopy controls
Age 30-79 years
Validated FFQ, 190 food items Delicatessen, small adenomas Delicatessen, large adenomas
64.2/37.7 vs. 0/0 g/d m/w
64.2/37.7 vs. 0/0 g/d m/w 0.9 (0.5, 1.7) 1.5 (0.9, 2.6)
Age, sex, energy intake, BMI, alcohol, tobacco
Erhardt, JG, 2002, Germany
1995-1997 207 colorectal
adenoma cases 224 colonoscopy controls
Age 39-73 years
Validated dietary history, 300 foods
Ham, sausage, adenomas >15g/day 1.87 (1.12,
3.11) Univariate
DW, 2002, Netherlan ds Sporadic/HNPCC family colorectal adenoma cases 148 colonoscopy controls
Age <75 years
FFQ, 178
food items lamb, game, organs), sporadic cases Red meat, HNPCC cases
7 vs ≤4/wk
23.0)
0.4 (0.1, 2.2)
Tiemersma EW et al, 2004, Netherlands
1997-2000 431 colorectal adenoma cases
433 colonoscopy controls
Age 18-75 years
Validated FFQ, 178 food items
Beef patties ≥1.4 vs. 0.16 1.0 (0.7, 1.4) Age, sex, indication of endoscopy
Chiu BCH et al, 2004, USA
1994-1996 146 colorectal adenoma cases
146 colonoscopy controls
Age 18-74 years
Validated FFQ, 100 food items Beef roasts Beef steaks Hamburgers/Cheeseburgers
Pork chops, ham steaks
≥0.57 vs. <0.11 serv/wk ≥1.00 vs. <0.23 serv/wk ≥0.57 vs. <0.11 serv/wk ≥0.57 vs. <0.11 serv/wk
0.6 (0.2, 1.4)
1.9 (1.0, 3.6)
1.6 (0.8, 3.0)
2.3 (1.1, 5.0)
Age, sex, total energy intake, pack-years of smoking, physical activity, NSAIDS
Gunter MJ et al, 2005, USA
1991-1993 261 left-sided colorectal adenoma cases
304 sigmoidoscopy controls
Age 50-74 years
FFQ Red meat, large (>1 cm) adenomas 28.2-127.3 vs. 0-1.8 g/d 0.85 (0.38, 1.90) Age, sex, energy, center, fruit and
vegetable intake, smoking status, BMI
Wark PA et al, 2006, Netherlands
1997-2000 81 K-ras+ & 453 K-ras -colorectal adenoma cases
709 colonoscopy controls
Age 18-75 years
Validated FFQ, 178 food items
Red meat, K-ras+
Red meat, K-ras
->70.5 vs. ≤38.2 g/d >70.5 vs. ≤38.2 g/d
1.70 (0.94-3.09)
1.00 (0.73-1.39)
Age, sex, total energy
Ward MH et al, 2007, USA
1994-1996 146 colorectal adenoma cases
228 colonoscopy controls
Age 18-74 years
Validated FFQ, 100 food items
Total processed meat
Bacon
Breakfast sausage
Hot dogs, other sausages
Ham steak, pork chops
Ham, bologna, salami, lunchmeats
≥24.0 vs. <3.7 g/d ≥1.85 vs. 0 g/d ≥4.2 vs. 0 g/d ≥6.7 vs. 0 g/d ≥6.3 vs. 0 g/d ≥8.0 vs. 0 g/d
2.0 (1.0, 4.0)
1.2 (0.7, 2.2)
1.6 (0.8, 3.2)
1.9 (1.0, 3.7)
2.2 (1.3, 3.7)
1.2 (0.7, 2.3)
Liverwurst >0 vs. 0 g/d 1.9 (0.8, 4.2) Sæbø M
et al, 2008, Norway
NR 197/194 high/low-risk
colorectal adenoma cases
201 healthy screening controls
Mean age 67.3 yrs
FFQ Red meat (fresh), high-risk adenomas
Red meat, low-risk adenomas
>45.0 vs. ≤22.5 g/d >45.0 vs. ≤22.5 g/d
1.05 (0.57, 1.92) 1.47 (0.75, 2.85)
Age, sex, smoking
Ferrucci LM et al, 2009, USA
2000-2002
158 female colorectal adenoma cases 649 colonoscopy controls
Mean age 60.2/57.2 years Validate d DHQ, 124 food items
Red meat (beef, cheeseburgers, hamburgers, bacon, cold cuts, ham, hot dogs, liver, pork, sausages, veal, venison, red meat from mixed dishes)
Processed meat
111.1 vs. 34.2 g/1000 kcal/d
Per 10 g/1000 kcal/d
15.7 vs. 1.5 g/1000 kcal/d
Per 10 g/1000 kcal/d
2.02 (1.06, 3.83) 1.07 (0.95, 1.21) 1.05 (0.59-1.85) 0.98 (0.78-1.23)
Age, education, race, smoking status, physical activity, BMI, study center, current HRT use, FH – CRA/ CRC, regular NSAID use, alcohol, fiber, dietary calcium, calcium from supplements, total calories
Ramadas A et al, 2009, Malaysia
2005 59 colorectal adenoma
cases
59 colonoscopy controls
Age ≥30 years
FFQ Red meat ≥3 vs. <3/wk 2.51
(1.00-6.28)
Age, sex, ethnicity, physical activity, height, BMI, waist circumference, energy intake, drinking, smoking
Northwood EL et al, 2010, UK
NR 317 colorectal adenoma cases
296 screening controls
Age 50-69 yrs
Validated FFQ
Red meat (beef, pork, lamb, burgers) >19 vs. 6 serv/mo 0.85 (0.53-1.30) Age, sex, smoking
Wang H et al, 2011, USA
1995-2007 914 colorectal adenoma cases
1185 population controls
Mean age 66/67 years
Validated FFQ, >200 food items
Total red meat Processed meat
>89 vs. <42 g/d >27 vs. <11 g/d
1.11 (0.83-1.48) 1.23 (0.94-1.61)
Age, sex, ethnicity, energy intake,
of smoking, aspirin use, years of schooling, calcium, non-starch polysaccharides from vegetables
Burnett, Hartman AN et al, 2011, USA
2004-2007 519 colorectal adenoma cases
227 colorectal adenoma and hyperplastic polyp cases
772 controls
Age 20-74 years
FFQ, Red meat (beef, veal, lamb, mutton,
pork, venison), colorectal adenoma
Red meat, proximal colorectal adenoma
Red meat, distal colorectal adenoma
Red meat, both types of polyps
>3/wk vs. 0/wk
>3/wk vs. 0/wk
>3/wk vs. 0/wk
>3/wk vs. 0/wk
1.19 (0.80, 1.78)
1.10 (0.62, 1.94)
1.49 (0.87, 2.56) 1.31 (0.73, 2.35)
Age, gender, race, education, BMI, alcohol intake, NSAIDs use, hormone therapy use
Fu Z et al, 2011, USA
2003-2010 1881 colorectal adenoma
cases
2503 total polyp cases (includes hyperplastic polyps)
3764 controls
Age 40-75 years
Validated FFQ,
Red meat, all polyps
Red meat, colorectal adenoma
Red meat, nonadvanced
Red meat, advanced
Processed meat, all polyps
Processed meat, CRA
Fast food hamburgers
Non-fast food hamburgers
Beef patties, steaks
Pork chops
Short ribs, spareribs
Bacon
Sausage
Hot dogs, frankfurters
≥51.4 vs. ≤9.5 g/d
≥51.4 vs. ≤9.5 g/d
≥51.4 vs. ≤9.5 g/d
≥51.4 vs. ≤9.5 g/d >22.5 vs. 0 g/d
>22.5 vs. 0 g/d
Quartile 4 vs. 1
Quartile 4 vs. 1
Quartile 4 vs. 1
Quartile 4 vs. 1
Quartile 4 vs. 1
Quartile 4 vs. 1
Quartile 4 vs. 1
Quartile 4 vs. 1
1.4 (1.2, 1.6)
1.4 (1.2, 1.6)
1.3 (1.1, 1.6)
1.5 (1.1, 2.1)
1.3 (1.1, 1.5)
1.3 (1.1, 1.5)
1.2 (1.0, 1.4)
1.2 (1.0, 1.5)
1.3 (1.1, 1.5)
1.4 (1.2, 1.6)
1.1 (0.9, 1.5)
1.1 (1.0, 1.3)
1.3 (1.1, 1.5)
1.2 (1.0, 1.4)
Table 2: Prospective studies of red and processed meat intake and colorectal adenoma risk Author, publication year, country Follow-up period Study size, gender, age, number of cases
Dietary assessment
Exposure Quantity RR (95% CI) Adjustment for confounders
Giovannucci E et al, 1992, USA
1986-1988 7284 men, age
40-75 years: 170 distal colon/ rectum adenoma cases Validated FFQ, 131 food items
Red meat >110 vs. <24 g/d 1.23 (0.70, 2.14) Age, energy
Kahn HS et al, 1998, USA
1982-1992 72868 men and
81356 women, age 40-64 years: 7504/ 5111 colon polyps
FFQ, 28 food items
Red meat, men
Red meat, women
10th vs. 1st decile
10th vs. 1st decile
0.97 (0.85, 1.12)
1.25 (1.06, 1.48)
Age, education, race, BMI, exercise, smoking, alcohol, coffee, aspirin use, multivitamin use, FH – CRC, diet change, women: parity, ERT, menopausal status
Nagata C et al, 2001, Japan
1992 - 1995
12788 men and 15852 women, age 35+ years: 181/98 colorectal adenoma cases
FFQ, 169 food items
Red meat (fresh), men
Red meat (fresh), women
Tertile 3 vs. 1
Tertile 3 vs. 1
1.18 (0.81, 1.72)
0.83 (0.47, 1.43)
Age, total energy, years of smoking, alcohol
Chan AT et al, 2005, USA
1989-90 – 1998
Nested case-control study: 527 female colorectal adenoma cases
527 matched controls
Mean age 57 yrs
Validated FFQ, 131 food items
Red meat (incl. processed meat) 1+/d vs. 1 serv/wk 1.57 (0.93, 2.65) Age, fasting status, date of blood draw, time of
Wu K et al, 2006, USA
1986-2002 14032 men, mean
age ~63 years: 581 distal colon adenomas
Validated FFQ, 131 food items
Total red meat (incl. processed meat)
Total red meat, small adenomas
Total red meat, large adenomas Hamburger
Beef, lamb, pork as main dish
Processed meats
7.2 vs. 1.1 serv/wk
7.2 vs. 1.1 serv/wk
7.2 vs. 1.1 serv/wk
2.5 vs. 0.16 serv/wk
3.3 vs. 0.33 serv/wk
4.5 vs. 0.16 serv/wk
1.18 (0.87, 1.62)
0.96 (0.54, 1.72)
1.95 (0.97, 3.91)
1.24 (0.91, 1.70)
1.26 (0.92, 1.74)
1.52 (1.12, 2.08)
Age, FH – CRC, reason of endoscopy, negative endoscopy before 1986, physical activity, smoking status, race, aspirin, total energy intake, calcium, folate
Cho E, 2007, USA
1984-2002 39246 women,
age 38-63 years: 2408 distal colorectal adenoma cases Validated FFQ, 130 food items
Red meat Quintile 5 vs. 1 1.36 (1.15, 1.60) Age, pack-years of smoking, BMI, physical
activity, FH – CC, history of endoscopic screening, year of endoscopy, aspirin use, menopausal status and postmenopausal hormone use, energy intake, alcohol, folate, total fiber, calcium
Rohrmann S et al, 2009, Germany
1994-98 – 2007
4215 men and women, age 35-65 years: 516 colorectal adenoma cases Validated FFQ, 146 food items
Red and processed meat, colorectal adenomas
Red and processed meat, colon adenomas
Red and processed meat, proximal colon adenomas
Red and processed meat, distal colon adenomas
Red and processed meat, rectal adenomas
Red and processed meat, small adenomas
Red and processed meat, large adenomas
Quartile 4 vs. 1
Quartile 4 vs. 1
Quartile 4 vs. 1
Quartile 4 vs. 1
Quartile 4 vs. 1
Quartile 4 vs. 1
Quartile 4 vs. 1
1.33 (0.95, 1.85)
1.53 (1.01, 2.30)
1.63 (0.87, 3.05)
1.50 (0.87, 2.59)
0.85 (0.42, 1.74)
0.97 (0.58, 1.62)
1.98 (1.09, 3.58)
Tantaman go YM et al, 2011, USA
1976-2002-2005 2818 men and
women: 441 colorectal polyp cases Mean age 73.4/71.2 years FFQ, 55
food items Red meat (beef, pork)
Beef
≥1/wk vs. never
≥1/wk vs. never
1.08 (0.84, 1.41)
1.09 (0.84, 1.41)
Age, sex, BMI
Ferrucci LM et al, 2012, USA
1993/2001
- 2006 17072 men
and women, age 55-74 years: 1008 distal colorectal adenoma cases FFQ, 137
food items Red meat (beef, pork, lamb),
distal colorectal adenoma
Red meat, distal colon adenoma
Red meat, rectal adenoma
Processed meat, distal colorectal adenoma
Processed meat, distal colon adenoma
Processed meat, rectal adenoma
60.1 vs. 13.5 g/1000 kcal/d
60.1 vs. 13.5 g/1000 kcal/d
60.1 vs. 13.5 g/1000 kcal/d
15.5 vs. 1.5 g/1000 kcal/d
15.5 vs. 1.5 g/1000 kcal/d
15.5 vs. 1.5 g/1000 kcal/d 1.22 (0.98, 1.52) 1.22 (0.95, 1.56) 1.33 (0.87, 2.04) 1.23 (0.99, 1.54) 1.24 (0.99, 1.59) 1.08 (0.71, 1.65)
Age, study centre, gender, ethnicity, education, FH – CRC, BMI, NSAIDs use, physical activity, smoking status, alcohol intake, dietary calcium,
BMI=Body Mass Index, CC=colon cancer, CRC=colorectal cancer, d=day, ERT=estrogen replacement therapy, FFQ=food frequency questionnaire, FH=Family history, g=grams, mo= month, NR = Not reported, NSAID=non-steroidal anti-inflammatory drugs, serv = servings, wk=week,
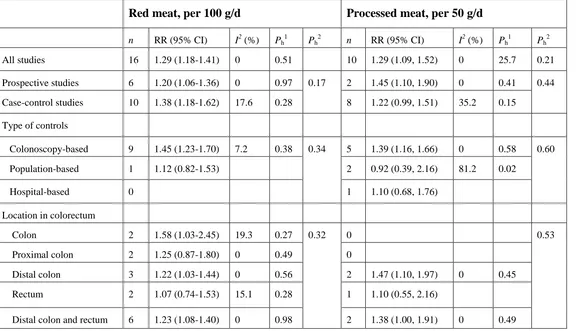
Table 3: Subgroup analyses of red and processed meat intake and colorectal adenomas, dose-response
Red meat, per 100 g/d Processed meat, per 50 g/d
n RR (95% CI) I2 (%) Ph1 Ph2 n RR (95% CI) I2 (%) Ph1 Ph2
All studies 16 1.29 (1.18-1.41) 0 0.51 10 1.29 (1.09, 1.52) 0 25.7 0.21
Prospective studies 6 1.20 (1.06-1.36) 0 0.97 0.17 2 1.45 (1.10, 1.90) 0 0.41 0.44
Case-control studies 10 1.38 (1.18-1.62) 17.6 0.28 8 1.22 (0.99, 1.51) 35.2 0.15
Type of controls
Colonoscopy-based 9 1.45 (1.23-1.70) 7.2 0.38 0.34 5 1.39 (1.16, 1.66) 0 0.58 0.60
Population-based 1 1.12 (0.82-1.53) 2 0.92 (0.39, 2.16) 81.2 0.02
Hospital-based 0 1 1.10 (0.68, 1.76)
Location in colorectum
Colon 2 1.58 (1.03-2.45) 19.3 0.27 0.32 0 0.53
Proximal colon 2 1.25 (0.87-1.80) 0 0.49 0
Distal colon 3 1.22 (1.03-1.44) 0 0.56 2 1.47 (1.10, 1.97) 0 0.45
Rectum 2 1.07 (0.74-1.53) 15.1 0.28 1 1.10 (0.55, 2.16)
Geographic location
Europe 5 1.31 (1.07-1.61) 0 0.98 0.71 3 0.95 (0.65, 1.40) 49.3 0.14 0.04
America 10 1.29 (1.13-1.48) 33.1 0.14 7 1.45 (1.24, 1.69) 0 0.87
Asia 1 1.11 (0.64-1.91) 0
Number of cases
Cases <250 3 2.05 (1.18-3.57) 0 0.38 0.23 3 0.92 (0.53, 1.62) 55.6 0.11 0.045
Cases 250-<500 6 1.30 (1.03-1.63) 0 0.94 3 1.20 (0.91, 1.58) 0 0.57
Cases ≥500 7 1.26 (1.11-1.43) 31.0 0.19 4 1.47 (1.24, 1.73) 0 0.85
Adjustment for confounders
Alcohol Yes 6 1.31 (1.13-1.52) 27.1 0.23 0.64 4 1.35 (1.14-1.60) 0 0.49 0.84
No 10 1.25 (1.08-1.45) 0 0.62 6 1.25 (0.92-1.69) 47.6 0.09
Smoking Yes 10 1.32 (1.15-1.51) 30.4 0.17 0.49 7 1.39 (1.20-1.61) 0 0.78 0.10
No 6 1.21 (1.00-1.46) 0 0.98 3 1.00 (0.56-1.79) 62.0 0.07
Body mass index, weight
Yes 9 1.29 (1.17-1.44) 0 0.44 0.98 7 1.34 (1.15-1.55) 0 0.73 0.72
No 7 1.27 (1.04-1.56) 4.3 0.39 3 1.14 (0.60-2.17) 75.9 0.02
Physical activity Yes 9 1.31 (1.15-1.49) 36.5 0.13 0.62 7 1.30 (1.04-1.64) 44.4 0.10 0.52
No 7 1.21 (0.96-1.52) 0 0.97 3 1.19 (0.91-1.55) 0 0.75
NSAID, aspirin use Yes 8 1.30 (1.11-1.53) 47.2 0.07 0.84 5 1.43 (1.22-1.69) 0 0.70 0.13
No 8 1.26 (1.06-1.50) 0 1.00 5 1.11 (0.81-1.52) 40.3 0.15
Fiber Yes 4 1.21 (1.04-1.39) 0 0.89 0.35 3 1.28 (0.99-1.66) 0 0.66 0.93
No 12 1.34 (1.18-1.52) 10.4 0.34 7 1.27 (1.01-1.61) 46.5 0.08
No 10 1.43 (1.23-1.66) 5.5 0.39 6 1.21 (0.92-1.58) 50.0 0.08
Energy intake Yes 11 1.30 (1.15-1.46) 22.3 0.23 0.74 9 1.37 (1.20-1.57) 0 0.80 0.03
No 5 1.23 (0.97-1.55) 0 0.88 1 0.58 (0.31-1.05)
Meat subtypes3
Beef 8 1.40 (1.18-1.67) 18.8 0.28
Hamburger 4 1.23 (1.06-1.43) 0 0.67
Pork 2 1.55 (1.05-2.30) 37.3 0.20
Bacon 3 1.12 (0.99-1.27) 0 0.58
Figure legends
Figure 1. Red meat and colorectal adenomas
.8
1
1
.2
1
.4
1
.6
Es
ti
ma
te
d
R
R
0 20 40 60 80 100 120 140 160
Red meat (g/day)
Best fitting fractional polynomial 95% confidence interval
Relative Risk
.25 .5 .75 1 1.5 2 3 5 7
Study Relative Risk (95% CI)
Cohort studies
Ferrucci, 2012 1.18 ( 0.95, 1.47)
Tantamango, 2011 1.43 ( 0.65, 3.13)
Rohrmann, 2009 1.30 ( 1.01, 1.67)
Wu, 2006 1.13 ( 0.86, 1.48)
Chan, 2005 1.21 ( 0.85, 1.72)
Nagata, 2001 1.11 ( 0.64, 1.91)
Subtotal 1.20 ( 1.06, 1.36)
Case-control studies
Burnett-Hartman, 2011 1.08 ( 0.72, 1.62)
Fu, 2011 1.71 ( 1.35, 2.16)
Wang, 2011 1.12 ( 0.82, 1.53)
Northwood, 2010 1.54 ( 0.71, 3.36)
Ferrucci, 2009 1.32 ( 0.48, 3.65)
Saebo, 2007 1.62 ( 0.60, 4.33)
Wark, 2006 1.22 ( 0.79, 1.90)
Voskuil, 2002 1.19 ( 0.23, 6.18)
Sinha, 1999 2.84 ( 1.38, 5.84)
Haile, 1997 1.28 ( 0.95, 1.73)
Subtotal 1.38 ( 1.18, 1.62)
Overall 1.29 ( 1.18, 1.41)
Red meat, linear dose-response analysis, per 100 g/d
A
Red meat, nonlinear dose-response analysis
.8
1
1
.2
1
.4
1
.6
Es
ti
ma
te
d
R
R
0 10 20 30 40
Processed meat (g/day)
Best fitting fractional polynomial 95% confidence interval
Processed meat, nonlinear dose-response analysis
B
Relative Risk
.25 .5 .75 1 1.5 2 3 5 7
Study Relative Risk (95% CI)
Cohort studies
Ferrucci, 2012 1.32 ( 0.93, 1.87)
Wu, 2006 1.66 ( 1.09, 2.54)
Subtotal 1.45 ( 1.10, 1.90)
Case-control studies
Fu, 2011 1.51 ( 1.19, 1.91)
Wang, 2011 1.38 ( 0.90, 2.13)
Ferrucci, 2009 0.94 ( 0.45, 1.95)
Ward, 2007 1.47 ( 0.79, 2.73)
Senesse, 2002 1.16 ( 0.80, 1.69)
Haile, 1997 1.82 ( 0.79, 4.19)
Benito, 1993 0.58 ( 0.31, 1.05)
Macquart-Moulin, 1987 1.10 ( 0.68, 1.76)
Subtotal 1.22 ( 0.99, 1.51)
Overall 1.29 ( 1.09, 1.52)
Processed meat, linear dose-response analysis, per 50 g/d
Supplementary Table 1: Subgroup analyses of red meat intake and colorectal adenomas overall and stratified by study design, dose-response
Red meat, per 100 g/d, all studies Red meat, per 100 g/d, case-control studies
Red meat, per 100 g/d, cohorts
n RR (95% CI) I2 (%) Ph1 Ph2 N RR (95% CI) I2 (%) Ph1 Ph2 n RR (95% CI) I2 (%) Ph1 Ph2
Geographic location
Europe 5 1.31 (1.07-1.61) 0 0.98 0.71 4 1.33 (0.94-1.88) 0 0.93 0.90 1 1.30 (1.01-1.67) 0.51
America 10 1.29 (1.13-1.48) 33.1 0.14 6 1.39 (1.10-1.75) 51.9 0.07 4 1.18 (1.01-1.37) 0 0.95
Asia 1 1.11 (0.64-1.91) 0 1 1.11 (0.64, 1.91)
Number of cases
Cases <250 3 2.05 (1.18-3.57) 0 0.38 0.23 3 2.05 (1.18-3.57) 0 0.38 0.29 1.00
Cases 250-<500 6 1.30 (1.03-1.63) 0 0.94 3 1.33 (1.02-1.74) 0 0.84 2 1.20 (0.77-1.88) 0 0.60
Cases ≥500 7 1.26 (1.11-1.43) 31.0 0.19 4 1.30 (1.01-1.67) 54.8 0.09 4 1.20 (1.06-1.37) 0 0.89
Adjustment for confounding factors
Alcohol Yes 6 1.31 (1.13-1.52) 27.1 0.23 0.64 3 1.41 (1.00-2.00) 47.0 0.15 0.73 3 1.23 (1.06-1.42) 0 0.85 0.66
No 10 1.25 (1.08-1.45) 0 0.62 7 1.30 (1.09-1.55) 0 0.44 3 1.15 (0.91-1.45) 0 0.84
Smoking Yes 10 1.32 (1.15-1.51) 30.4 0.17 0.49 6 1.54 (1.19-2.00) 34.9 0.17 0.21 4 1.20 (1.06-1.37) 0 0.89 1.00
No 6 1.21 (1.00-1.46) 0 0.98 4 1.21 (0.98-1.49) 0 0.93 2 1.20 (0.77-1.88) 0 0.60
Body mass index, weight
Yes 9 1.29 (1.17-1.44) 0 0.44 0.98 5 1.32 (1.08-1.62) 39.1 0.16 0.43 4 1.23 (1.07-1.43) 0 0.93 0.55
No 7 1.27 (1.04-1.56) 4.3 0.39 5 1.53 (1.12-2.10) 0 0.42 2 1.12 (0.88-1.43) 0 0.95
Physical activity Yes 9 1.31 (1.15-1.49) 36.5 0.13 0.62 5 1.47 (1.13-1.90) 53.4 0.07 0.41 4 1.20 (1.06-1.37) 0 0.89 1.00
n denotes the number of studies. 1 P for heterogeneity within each subgroup, 2 P for heterogeneity between subgroups with meta-regression analysis
Supplementary table 2: Subgroup analyses of processed meat intake and colorectal adenomas overall and stratified by study design, dose-response
NSAID, aspirin use Yes 8 1.30 (1.11-1.53) 47.2 0.07 0.84 5 1.43 (1.06-1.94) 59.9 0.04 0.71 3 1.20 (1.04-1.38) 0 0.74 0.97
No 8 1.26 (1.06-1.50) 0 1.00 5 1.30 (1.04-1.63) 0 0.98 3 1.21 (0.92-1.59) 0 0.87
Fiber Yes 4 1.21 (1.04-1.39) 0 0.89 0.35 2 1.13 (0.84-1.53) 0 0.76 0.30 2 1.23 (1.04-1.45) 0 0.57 0.71
No 12 1.34 (1.18-1.52) 10.4 0.34 8 1.45 (1.21-1.73) 18.5 0.28 4 1.17 (0.96-1.42) 0 0.94
Dairy, calcium Yes 6 1.19 (1.06-1.34) 0 0.97 0.07 2 1.13 (0.84-1.53) 0 0.76 0.30 4 1.20 (1.06-1.37) 0 0.89 1.00
No 10 1.43 (1.23-1.66) 5.5 0.39 8 1.45 (1.21-1.73) 18.5 0.28 2 1.20 (0.77-1.88) 0 0.60
Energy intake Yes 11 1.30 (1.15-1.46) 22.3 0.23 0.74 7 1.41 (1.16-1.73) 34.4 0.17 0.58 4 1.19 (1.04-1.37) 0 0.87 0.82
No 5 1.23 (0.97-1.55) 0 0.88 3 1.21 (0.86-1.70) 0 0.60 2 1.25 (0.91-1.72) 0 0.71
Processed meat, per 50 g/d Processed meat, case-control studies Processed meat, cohort studies
n RR (95% CI) I2 (%) Ph1 Ph2 n RR (95% CI) I2 (%) Ph1 Ph2 n RR (95% CI) I2 (%) Ph1 Ph2