L E T T E R
Higher resources decrease fluctuating selection during
host
–
parasite coevolution
Laura Lopez Pascua,1*,†Alex R. Hall,2,†Alex Best,3Andrew D.
Morgan,4Mike Boots5and Angus
Buckling5
Abstract
We still know very little about how the environment influences coevolutionary dynamics. Here, we investigated both theoretically and empirically how nutrient availability affects the relative extent of escalation of resistance and infectivity (arms race dynamic; ARD) and fluctuating selec-tion (fluctuating selecselec-tion dynamic; FSD) in experimentally coevolving populaselec-tions of bacteria and viruses. By comparing interactions between clones of bacteria and viruses both within- and between-time points, we show that increasing nutrient availability resulted in coevolution shifting from FSD, with fluctuations in average infectivity and resistance ranges over time, to ARD. Our model shows that range fluctuations with lower nutrient availability can be explained both by ele-vated costs of resistance (a direct effect of nutrient availability), and reduced benefits of resistance when population sizes of hosts and parasites are lower (an indirect effect). Nutrient availability can therefore predictably and generally affect qualitative coevolutionary dynamics by both direct and indirect (mediated through ecological feedbacks) effects on costs of resistance.
Keywords
Adaptive dynamics, bacteria, experimental evolution, virus.
Ecology Letters(2014)17: 1380–1388
INTRODUCTION
Antagonistic coevolution between hosts and parasites, the reciprocal evolution of host defence and parasite counter-defence, has far-reaching consequences for the evolution of genetic and ecological diversity (Thompson 2005), parasite vir-ulence (Anderson & May 1982), sexual reproduction (Hamil-ton et al. 1990), mutation rates (Pal et al. 2007) and population dynamics (Buckling & Hodgson 2007). Crucial to the impact of coevolution is the extent to which selection on infectivity and resistance traits fluctuates through time, since a fluctuating selection dynamic (FSD) plays a key role in the maintenance of diversity and the persistence of coevolution (Hamilton et al. 1990; Sasaki 2000; Agrawal & Lively 2002). It is well known that the extent of FSD is in part determined by the genetic specificity between host and parasite. At one extreme (high and equal specificity), each parasite genotype can only infect a single host genotype, hence genotypes are highly specialised (matching alleles model; MAM) (Frank 1993), and their frequencies will fluctuate through time. At the other extreme (variable specificity), parasites can evolve to be generalists, infecting all host genotypes, as well as special-ists, and, likewise, hosts can evolve to be both generalists and specialists. This is traditionally modelled as a Gene for Gene model (GFGM) (Flor 1956; Sasaki 2000; Thrall & Burdon 2003), but can also be captured by a continuous ‘Range’ phe-notypic model (Bestet al.2010). In the absence of costs asso-ciated with generalism, there will be selection for increasing
resistance and infectivity ranges, resulting in arms race dynamics (ARD). However, if there are costs associated with generalism, range evolution will be constrained and FSD becomes possible.
The FSD in gene-for-gene type models can be of two types. First, fluctuations in the frequencies of genotypes with similar ranges, but able to infect/resist different enemy genotypes (specialism FSD); analogous to FSD resulting from MAM specificity (Agrawal & Lively 2002). Second, fluctuations in the magnitude of infectivity and resistance ranges (Sasaki 2000; Best et al. 2010) (range FSD). Costs may also lead to the stable persistence of a number of hosts and parasites with different ranges (Best et al. 2010): static rather than fluctuat-ing diversity. There is a general perception that environmental conditions will influence the outcome of coevolution between hosts and parasites but we have little understanding of how different environmental factors impact on the likelihood of FSD versus ARD. Here, we investigate the impact of nutrient availability, which can affect costs and benefits of resistance (Hochberg & van Baalen 1998; Lopez-Pascua & Buckling 2008) on the extent of ARD versus FSD in coevolving popu-lations of bacteria and viruses.
Recent work using coevolving populations of bacteria and viruses (bacteriophage; phage) is supportive of the role of costs in determining the relative importance of ARD versus FSD. For example, the early stages of coevolution between the bacterium Pseudomonas fluorescens SBW25 and phage SBW25/2 in nutrient-rich media are characterised by ARD,
1Oxford Regional Molecular Genetics Laboratory, Oxford University Hospitals
NHS Trust, Oxford, UK
2
Institute of Integrative Biology, ETH Z€urich, 8092, Zurich, Switzerland€
3School of Mathematics and Statistics, University of Sheffield, Sheffield, S3
7RH, UK,
4Institute of Evolutionary Biology, The University of Edinburgh, Edinburgh,
EH9 3JT, UK
5
Biosciences, University of Exeter, Penryn, Cornwall, TR10 9EZ, UK *Correspondence: E-mail: [email protected] †Equal contribution.
with FSD becoming increasingly important through time (Hall et al. 2011). This increase in FSD correlates with increased costs associated with increased bacterial resistance ranges (Hallet al. 2011). Moreover, coevolution between the same bacteria and phage in soil microcosms is characterised by FSD rather than ARD even at early stages, and costs asso-ciated with increased resistance range are greatly elevated in soil compared to nutrient-rich laboratory media (Gomez & Buckling 2011).
Costs of resistance have the potential to be affected by a wide range of environmental conditions, including nutrient availability. Theoretical and empirical studies suggest complex effects of nutrient availability on host–parasite antagonistic coevolution, but a general finding is that increased nutrients tend to result in the evolution of elevated resistance (Hochberg & van Baalen 1998; Bohannan & Lenski 2000a,b; Fordeet al.2004, 2007, 2008; Lopez-Pascua & Buckling 2008; Lopez-Pascua et al. 2010; Boots 2011; Harrison et al. 2013). There are two general reasons for this, which have proved hard to tease apart (Lopez-Pascua & Buckling 2008). First, costs of resistance can be reduced when there is less competi-tion for resources. Second, increased nutrient availability increases host population sizes, and hence host–parasite encounter rates, increasing selection for resistance. As a conse-quence of increased host resistance with increased nutrient availability, selection for elevated parasite infectivity is likely to increase in turn (Hochberg & van Baalen 1998; Lopez-Pascua & Buckling 2008). An intriguing possibility is that increasing nutrient availability has the potential to shift a dynamic from FSD to ARD.
Here, we provide the first empirical and theoretical tests of this hypothesis. We measured the extent of ARD and the dif-ferent FSDs betweenP. fluorescensSBW25 and /2 coevolved under high and low nutrient conditions by measuring interac-tions between multiple bacteria and phage clones within and between time points, within communities. We carried out these assays for communities in which coevolution had previ-ously been determined by measuring resistance and infectivity at the population level only (Lopez-Pascua & Buckling 2008). This distinction between population level assays and clonal level assays (this study) is crucial, because only clonal level assays can ensure discrimination between different coevolu-tionary dynamics. We then build a mathematical model of the coevolution of host and parasite range that explicitly includes the ecological dynamics of the system. With this we examine the impacts of both the direct effects of changes in costs and the indirect effects of nutrient supply on population size on FSD versus ARD.
MATERIALS AND METHODS
Selection experiment
We used bacteria and phage that had been coevolved for a previous study (Lopez-Pascua & Buckling 2008). Selection lines were initiated by inoculating 6 mL high (or low) nutrient M9KB medium (M9 salt solution supplemented with 10 (1) gL1 glycerol and 20 (2) gL1 proteose peptone) with ~108 cells of P. fluorescens SBW25 and ~105 particles of
SBW25Φ2. Six replicate selection lines per nutrient treatment were maintained by serial transfer, with a 100-fold dilution every 48 h. Tubes were incubated at 28°C static, and vor-texed for 1 min to homogenise the culture prior to each trans-fer to fresh media. Each selection line was maintained for 12 transfers, and a sample of each was frozen at 80°C in 20% v : v glycerol every two transfers.
Isolating coevolved bacteria and phage
To measure changes in infectivity and resistance over time, we isolated 20 independent phage plaques and bacterial colonies (clonal isolates) from the frozen populations at transfers 2, 4, 6, 8, 10 and 12 for each of the 12 replicates. Bacteria were iso-lated by plating samples onto M9KB agar plates following overnight growth in liquid M9KB media at 28°C, which were then incubated overnight at 28 °C. Colonies were then inocu-lated into liquid M9KB overnight for subsequent resistance assays. A sample of each culture was also frozen at80°C in 25% v : v glycerol. Phages were extracted from the same fro-zen samples by adding 10% chloroform to the reconditioned culture, vortexing and centrifuging at 13 000 rpm (13800 g) for 2 min, serially diluting and spotting onto M9KB agar (6%) containing exponentially growing ancestral bacteria, prior to overnight incubation and picking independent pla-ques. Each plaque was then amplified on ancestral bacteria before storage at 4 °C. While this method of phage isolation will bias against phage clones that are unable to grow on ancestral bacteria, a previous study showed such phage phe-notypes to be at low frequencies (Hallet al.2011). This proce-dure yielded a total of 120 host and 120 phage clonal isolates for each of the 12 coevolving communities.
Infectivity and resistance assays
We tested for infectivity/resistance in every phage/bacteria combination within each of the twelve replicate populations (120 phages9120 bacteria=14 400 assays per population). For each assay, 1 lL of phage stock was added to a lawn of the relevant host bacteria growing on soft M9KB agar. Phages were scored as infective if plaques were visible after incubation at 28°C for 24 h. Infectivity at each combination of phage time (the transfer that phages were isolated from) and bacteria time (the transfer that bacteria were isolated from) was calculated as the proportion of successful infections (n=400).
Statistical methods
communities that coevolved in different environmental condi-tions (Fig. S1).
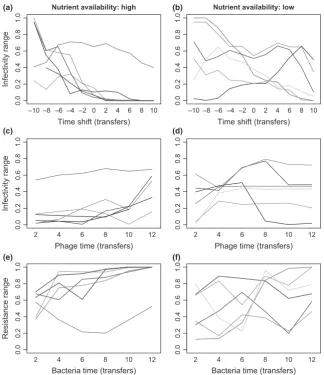
Arms race dynamics are characterised by increasing resis-tance and infectivity ranges through time, such that parasite infectivity to contemporary hosts should increase from past to future parasite populations, and host resistance to contempo-rary parasites should increase from past to future host popu-lations. This can be inferred across the entire time series for a given population from the association between phage infectiv-ity and time shift, where time shift is the difference between the transfer that bacteria and phages were sampled from (Rodeet al. 2011; Blanquart & Gandon 2013). For example, when phage particles from transfer 4 are tested against bacte-ria from transfer 10, time shift= 10–4=6. Under ARD, we expect a negative slope of average infectivity against time shift. We tested this association in high and low nutrient treatments by taking the average infectivity at each combina-tion of phage time, bacteria time and populacombina-tion, before fit-ting a linear model with infectivity against phage time and time shift, plus population (random) and its interactions with both fixed effects, thereby fitting six independent estimates for the slope of infectivity against time shift, one for each popula-tion.
Range FSD implies that infectivity/resistance ranges both increase and decrease through time. This results in a main effect of phage time or bacteria time fitted as categorical pre-dictors of average infectivity in interactions between phages and bacteria across the time series. In our data set, the main effects varied among populations in both nutrient treatments (population9phage time or bacteria time effects). We, there-fore, tested for range FSD within each population by fitting a model of phage infectivity against phage time, bacteria time and their interaction, taking the mean square for each main effect as an estimate of the strength of range FSD for infectiv-ity and resistance, before testing for an average effect of nutri-ent supply by a t-test. Because significant main effects of phage time and bacteria time can also result from ARD, range FSD is only clearly demonstrated in a given population by a main effect of phage time or bacteria time in the absence of directional changes as inferred from the time shift effect described above.
Specialism FSD results in phages and hosts from different time points being specialised to infect/resist different sets of hosts/phages, and a significant phage time9bacteria time interaction in determining population-level infectivity. Because this can also stem from random processes such as sampling error or genetic drift, specialism FSD can only be unambiguo-suly shown if parasites (or hosts) are best adapted to their contemporary enemies relative to past and future enemies. In the absence of this pattern (as was the case for this data set), specialism FSD, which is ultimately driven by negative fre-quency-dependent selection, could still be manifest at the level of individual clones if, in a given population at a single time point, there is variation among clones in their ability to infect/resist hosts/phages from the past and the future. By contrast, under ARD or range FSD, the relative susceptibil-ity/infectivity of hosts/phages from different time points would not vary qualitatively among clones. To test this, for five time points (4, 6, 8, 10), we took the average infectivity of
each of the 20 phage clones against hosts from the past, pres-ent and future. We then calculated the inconsistency compo-nent of the phage clone 9time (past/present/future bacteria) interaction, calculated asΣ(re1re2(1 1qe1e2)), wherere1and re2 are the standard deviations of infectivity across time points for two clones, and qe1e2is the correlation between the two clones across time points (Bell 1990; Venail et al. 2008). A similar calculation was carried out for resistance inconsis-tency, where the resistance of each clone from a time point was calculated against past, present and future phages.
Modelling
We build on the modelling framework presented in Bestet al.
(2010) which developed an ecologically explicit coevolutionary model where host resistance and parasite infectivity range coe-volve as continuous traits. The model includes both epidemio-logical and ecological dynamics and is therefore an appropriate framework to examine the role that variation in costs associated with increased resistance range for hosts or infectivity for parasites plays in the prevalence of FSD relative to ARD. Since the model has intrinsic ecological dynamics with an emergent carrying capacity and disease equilibrium dynamics, we can also independently examine the influence of reduced intra-specific competition and higher population sizes associated with increased nutrient concentrations. The focus of Best et al. (2010) was how and when ‘static’ genetic varia-tion is generated by epidemiological feedbacks while here our focus is on how changes in costs and population size influence the chance of cycles in range (range FSD) or the fixation of maximal range (ARD). Note that this modelling framework does not allow specialism FSD, but we consider this an acceptable limitation, given that specialism FSD played a very minor role in the empirical coevolutionary dynamics.
Following Bestet al. (2010), we use a standard Susceptible-Infected (SI) framework (Anderson & May 1981), with the ecological dynamics of susceptible hosts (X) and infected hosts (Y) governed by the following equations,
dX
dt ¼aXqXðXþYÞ bXbXY dY
dt ¼bXY ðaþbÞY:
ð1Þ
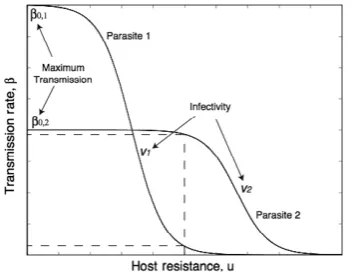
Uninfected hosts reproduce at rate a, which is reduced due to crowding by a factorq, and have natural death rateb. The transmission coefficient of the infection is b, and infected hosts have an additional mortality rate due to infection, a. We assume an infection function such that there is a continu-ous smooth range of hosts that can be infected by a particular parasite strain and that the narrower the range, the higher the transmission rate of the parasite strain. There is, therefore, the phenotypic assumption of a continuous gene-for-gene model with costs (high range leads to lower infectivity in any particular host). The function is given by
b¼b0ðvÞð1e2ðuvÞÞ1: ð2Þ
parasite with infectivity range v can achieve. A host with a higher u is able to prevent infection from stronger parasites (corresponding to resistance to a broader range of potential parasite types), and similarly a parasite with a highervis able to infect stronger hosts (similarly, corresponding to an ability to infect a broader range of host types). The final assumptions are that hosts that have high resistance to a large range of parasites pay a cost in terms of their birth rate,a, and para-sites with a broad infectivity range have reduced maximum transmission,b0(v).
We analyse the model within an evolutionary invasion (‘adaptive dynamics’) framework (Dieckmann & Law 1996; Geritz et al. 1998) where we assume that a rare mutant host (um) or parasite strain (vm) with a small phenotypic difference attempts to invade a system with resident host and parasite strains (uandv) which are at an equilibrium of their epidemi-ological dynamics in (1). The success of these mutants are given by their invasion fitnesses that are found to be as follows:
s¼aðumÞ qðXþYÞ bbðum;vÞY
r¼bðu;vmÞX ðaþbÞ
ð3Þ
for the host and parasite respectively, where X and Y are the resident equilibria found from solving (1). If s >0 (r >0), then the mutant host (parasite) will successfully invade and potentially replace the resident. Through a series of mutations and substitutions, the resistance and infectivity ranges will coevolve until a (potentially temporary) stopping point, or ‘evolutionarily singular point’ is reached when the fitness gra-dients are simultaneously zero. Here the coevolutionary behaviour depends on a number of second-order terms (Geritz
et al. 1998). Our focus here is on ‘convergence stability’, i.e. whether the singular point is a coevolutionary attractor but in particular we will look for ‘Hopf bifurcations’ where a singu-lar point loses convergence stability in such a way that coevo-lutionary cycles are generated: this is the criteria for range FSD.
Convergence stable singular points are found through math-ematical analysis of the model (see Best et al. 2010 for more
details). The behaviour of this point, as a particular parameter is varied, is investigated using the AUTO continuation soft-ware (Doedel et al. 2008). The software studies the conver-gence stability of any singular points as small perturbations are made to a chosen parameter, in particular identifying the location and stability of the singular points and any bifurca-tions. For illustration, we also run numerical simulations of the coevolutionary process for chosen parameter values in the C programming language. N potential host and parasite strains are initiated with the densities of all but one of each population is initially set to zero. The epidemiological dynam-ics of (1) are run for sufficient time such that the system will be approaching its equilibrium. A host or parasite strain is then selected (weighted by population size and subject to demographic stochasticity (Dieckmann & Law 1996)) to pro-duce a mutant one strain ‘up’ or ‘down’ at low density. The epidemiological dynamics are then run again for sufficient time and a new mutant is selected. Before each mutation, any strains whose density is below some low threshold are assumed to be extinct.
RESULTS
Bacteria-phage coevolution
There was a strong tendency for phages to be more infective against bacteria from the past than the future on average in communities evolved in our high-nutrient treatment (linear time shift effect: F1,5=22.29, P =0.002; Fig. 2a), but not in the low-nutrient treatment (F1,5=3.59, P= 0.11; Fig. 2b). This association, indicating ARD, held for five out of six high-nutrient communities but only two out of six low-nutri-ent communities (P< a=0.05 after sequential Bonferroni correction). Although the average linear effect of the time shift was stronger at high nutrient supply, infectivity and resistance varied across time points to a similar extent in both treatments on average (categorical effects of phage time and bacteria time in communities from high vs low nutrient supply – phage time: Welch’s t10=0.58, P=0.58; bacteria time: t5.74=0.89, P =0.41; Fig. 2c–f). Indeed, three out of six low-nutrient communities showed significant variation in both phage infectivity and bacterial resistance across time points but no significant effect of time shift (Table S1). This indicates range FSD: average host range of phages or resis-tance range of bacteria varied significantly but non-direction-ally over the time series in these populations. By contrast, there was only one high-nutrient community where bacteria time had a significant but non-directional effect (‘U’-shaped in Fig. 2e).
[image:4.595.69.247.55.193.2]We next asked whether greater range FSD at low nutrient supply was associated with a stronger tendency for phages or bacteria to be specialised to enemies from particular time points. This would result in a stronger phage time 9bacteria time interaction, but the mean square for this term in high-and low-nutrient populations was no different on average (Welch’s t6.45=0.50, P=0.64). Although this does not exclude the possibility of specialism FSD, it does not support a difference in the degree of specialisation between high- and low-nutrient supply treatments.
Specialism FSD can still be manifest at the level of individual clonal isolates even if it is not detectable at the population level. For example, a lack of significant variation of popula-tion-level performance across past, present and future enemies does not exclude the possibility that different genotypes within the population show qualitatively different reaction norms across enemies from different time points. Therefore, we tested for variation among clonal isolates within time points in their ability to infect/resist hosts from the past, present and future by calculating inconsistency; a measure of within-population specialisation of phage and bacteria clonal isolates to each other. Resistance inconsistency was significantly higher in the low nutrient treatment (P< 0.03), but infectivity inconsistency did not differ between treatments (P= 0.09). Note that levels of inconsistency represented a tiny fraction of the total explained variance in the data set (less than 1%), suggesting that specialism FSD played a small role in observed changes. Nevertheless, the data are consistent with both greater range and specialism FSD for bacteria under low nutrient conditions. To more clearly visualise these results, we quantified the fre-quency of individual bacteria and phage phenotypes through
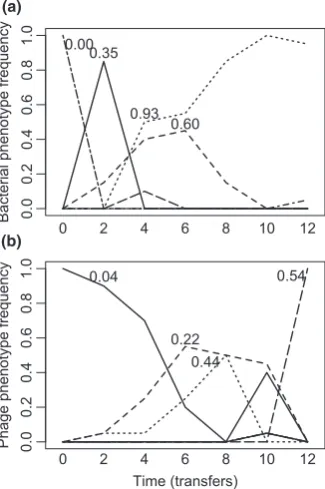
time in each population by clustering bacteria and phage clo-nal isolates into discrete phenotypic complexes (using a squared Euclidean similarity of 80%). The clearest examples from each of the high and low nutrient treatments are shown in Figs 3 and 4. In high nutrient media, we typically observed time-lagged directional coevolution towards generalism. The ancestral bacterium, which was sensitive to the ancestral phage, was rapidly replaced by a mutant resistant to the ancestral phage. A phage that could infect this mutant subse-quently evolved. This process occurred repeatedly throughout the short experiment. By contrast, although generalists readily evolved in the low nutrient media, they were frequently replaced by phenotypes with narrower resistance and infectiv-ity ranges.
Modelling
For clarity, we model the effect of resource on the carrying capacity and costs independently. The degree of costs has important implications to the qualitative outcome of the coevolutionary dynamics between the host and the parasite.
0.0
0.2
0.4
0.6
0.8
1.0
Nutrient availability: high
Time shift (transfers)
Infectivity range
–10 –8 –6 –4 –2 0 2 4 6 8 10 0.0
0.2
0.4
0.6
0.8
1.0
Nutrient availability: low
Time shift (transfers)
–10 –8 –6 –4 –2 0 2 4 6 8 10
0.0
0.2
0.4
0.6
0.8
1.0
Phage time (transfers)
Infectivity range
2 4 6 8 10 12 0.0
0.2
0.4
0.6
0.8
1.0
Phage time (transfers)
2 4 6 8 10 12
0.0
0.2
0.4
0.6
0.8
1.0
Bacteria time (transfers)
Resistance range
2 4 6 8 10 12 0.0
0.2
0.4
0.6
0.8
1.0
Bacteria time (transfers)
2 4 6 8 10 12
(a) (b)
(c) (d)
[image:5.595.135.460.54.430.2](e) (f)
At high costs, range in both the host and parasite is minimised (region 1 in Fig. 5). As the costs reduce, there is the potential for stable investment at intermediate range or
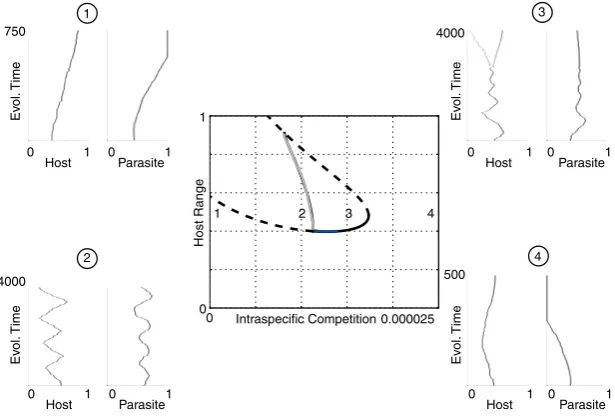
diversification to the stable coexistence of hosts and parasites with multiple ranges (region 2). Then we find cyclic changes in range characteristic of range FSD (region 3), followed by low costs with fixation of maximal host and parasite range (ARD) (region 4). When we model the effect of nutrient sup-ply on population size through a reduction in intra-specific competition leading to a higher carrying capacity, there is fix-ation of the maximum range (ARD) at the highest populfix-ation size (region 1 in Fig. 6). This is followed by cycles in range (region 2), diversification in range and intermediate invest-ment as competition increases (region 3). Finally, as popula-tion sizes fall beyond this, both host and parasite range are minimised (region 4). Therefore, it is clear from our modelling that high nutrient supply will select for ARD through its effects on reducing costs of resistance and increasing popula-tion size.
DISCUSSION
We measured interactions between clones of bacteria and viruses coevolved under high and low nutrient conditions and developed a general mathematical model. This allowed us to test the novel hypothesis that increasing nutrients shift host– parasite coevolutionary dynamics away from fluctuating selec-tion dynamics to arms race dynamics (FSD and ARD respec-tively). Both our model and the empirical results support this hypothesis. Our empirical results also suggest greater special-ism FSD with lower nutrient availability, although specialspecial-ism FSD explained a tiny amount of the variation in coevolution-ary dynamics, and hence this outcome was not addressed using our modelling framework. The modelling emphasises that range fluctuations with lower nutrient availability can be explained both by elevated costs of resistance, as well as reduced benefits of resistance when population sizes of hosts and parasites are lower. Furthermore, other outcomes than the two dynamics seen in our experiments (i.e. ARD and range FSD) are predicted in the theoretical model when nutri-ent availability is reduced further, including static range poly-morphisms and parasite extinction. Therefore, our key result is that nutrient availability impacts qualitatively on coevolu-tionary host–parasite dynamics through a direct effect on costs of resistance and an indirect effect through ecological feedback on the benefits of resistance.
Nutrient availability is likely to have complex effects on coevolutionary dynamics, but previous work has identified two effects that are likely to play an important role: lower costs of resistance and increased host–parasite encounter rates with increasing nutrients (Hochberg & van Baalen 1998; Lopez-Pascua & Buckling 2008; Boots 2011). In order to understand their impacts in detail, we therefore modelled these effects independently. Previous theoretical work has investigated the impact of costs of increasing resistance (and infectivity) ranges on coevolutionary dynamics and found, as we have, that increasing costs can shift coevolution from an ARD to a range FSD (Sasaki 2000). This occurs because low costs of resistance resulting from high nutrient availability result in resistance and infectivity reciprocally increasing until maximal investment is reached. However, under lower nutri-ent availability and hence higher costs of resistance, resistance
0.0
0.2
0.4
0.6
0.8
1.0
Bacterial phenotype frequency 0 2 4 6 8 10 12 0.03 0.98
0.65
0.44
0.0
0.2
0.4
0.6
0.8
1.0
Phage phenotype frequency
0 2 4 6 8 10 12
0.43
0.75
0.77 0.47
Time (transfers)
(a)
[image:6.595.73.243.58.296.2](b)
Figure 3Temporal dynamics of different bacteria (a) and phage (b) phenotypes (based on cluster analyses with 80% similarity) of a single community evolved under low nutrient conditions. Numbers associated with the dominant phenotypes indicate their resistance/infectivity ranges (i.e. proportion of clonal isolates bacteria could resist/phage could infect).
0.0
0.2
0.4
0.6
0.8
1.0
Bacterial phenotype frequency
0 2 4 6 8 10 12 0.000.35
0.93 0.60
0.0
0.2
0.4
0.6
0.8
1.0
Time (transfers)
Phage phenotype frequency
0 2 4 6 8 10 12 0.04
0.22 0.44
0.54
(a)
(b)
[image:6.595.76.239.378.623.2]0 1 0 1 0 1 0 1
Host Parasite Host Parasite
0 1 0 1 0 1 0 1
Host Parasite Host Parasite
Ev
ol.
Time
Ev
ol.
Time
Ev
ol.
Time
Ev
ol.
Time
750
600 2000
4000
Min. Birth Rate
30 80
Host Range
0 1
1 2 3 4
1
2
3
[image:7.595.120.479.55.296.2]4
Figure 5Bifurcation diagram showing the location and stability of host resistance range as the minimum birth rate is varied. Solid black lines denote convergence stable ‘ESS’ points, dashed lines unstable points, blue lines convergence stable but evolutionarily unstable ‘branching’ points and grey lines maximum limit of cycles. Example coevolutionary simulations are also shown for four scenarios (host range on the left, parasite range on the right). In region 1 there is no singular point and both host and parasite minimise their ranges. To the right, stable and unstable intermediate singular points emerge. The stable singular point is initially an ESS but then becomes a branching point in region 2, producing coexisting host (then parasite) strains. A Hopf bifurcation and cycles emerge in region 3. Cycles stop and ranges are maximised in region 4.
q¼1:2105;b¼1;a¼9;aðuÞ ¼aminþ ð100aminÞð1uÞ=ð1þ0:1uÞ;b0ðvÞ ¼105½3þ5ð1vÞ=ð1þ1:5vÞ
0 1 0 1 0 1 0 1
Host Parasite Host Parasite
0 1 0 1 0 1 0 1
Host Parasite Host Parasite
Ev
ol.
Time
Ev
ol.
Time
Ev
ol.
Time
Ev
ol.
Time
750
500 4000
4000
Intraspecific Competition
0 0.000025
Host Range
0 1
1 2 3 4
1
2
3
4
Figure 6Bifurcation diagram showing the location and stability of host resistance range as competition is varied. Solid black lines denote convergence stable ‘ESS’ points, dashed lines unstable points, blue lines convergence stable but evolutionarily unstable ‘branching’ points and grey lines maximum limit of cycles. Examples of coevolutionary simulations are also shown for four scenarios (host range on the left, parasite range on the right). In region 1 there is no singular point and both host and parasite minimise their range. To the left stable and unstable intermediate singular points emerge. The stable singular point is initially an ESS but becomes a branching point in region 2, producing coexisting host (then parasite) strains. A Hopf bifurcation then occurs and cycles emerge in region 3. These cycles continue until a ‘homoclinic’ orbit where the cycles intersect the unstable singular point. There is no stable singular point in region 4 and ranges are maximised.
[image:7.595.146.454.416.626.2]and infectivity increase until the cost of resistance outweigh the benefits. This results in selection for lower resistance, and in turn, given that there are also costs associated with increas-ing infectivity, lower infectivity ranges. The cycle is then repeated. The effect of reduced density on the transition from FSD to ARD has not previously been investigated, and we modelled this by assuming higher nutrient availability reduced intraspecific competition and hence equilibrium population densities. The effect of increasing density also shifted dynam-ics from range FSD to ARD for the same qualitative reasons as above: high density increased encounter rates and hence reduced the costs, relative to the benefits, of resistance. In this experimental system, we have observed that increasing nutri-ents both reduces costs of resistance and increases density (Lopez-Pascua & Buckling 2008), hence both processes are likely to have contributed to a shift from range FSD to ARD in our experiment. Although not seen in our experimental populations, this same process can result in static diversity where there are multiple phenotypes of hosts and parasites with different resistance and infectivity ranges coexisting (Best
et al.2010; Bootset al.2014).
Our empirical results highlight the benefits of assaying resis-tance/infectivity at the level of individuals in order to under-stand coevolutionary dynamics. In a previous study, the same populations were assayed for resistance/infectivity at the level of whole populations, but we were only able to detect that nutrients increased the rate of ARD coevolution (Lopez-Pascua & Buckling 2008). While our analyses of clonal data are consistent with this view (the extent of ARD was reduced under low nutrient conditions), we were also able to detect both range and specialism FSD. In the absence of consistently greater performance of hosts or parasites on contemporary, rather than past or future, enemies (Gomez & Buckling 2011), specialism FSD can only be detected with clonal rather than population level data. However, it is important to note that range FSD was obscured with the population-level data because broad infectivity ranges in a population can be achieved by a relatively low frequency of generalist clones. Population level assays can therefore obscure fluctuations in selection for generalism.
One inherent problem with disentangling coevolutionary dynamics using time shift experiments is ruling out the effects of sampling error and genetic drift (Bell 2010). For example, it could be argued that some of the range FSD we observed in communities from our low-nutrient treatment is explained by random sampling of clonal isolates with higher or lower resis-tance and infectivity ranges at different time points. Two lines of evidence suggest that non-directional changes in average infectivity and resistance in this experimental system reflect range FSD rather than error or drift. First, a previous study employed DNA sequencing to demonstrate that changes in the frequencies of phage genotypes over time are consistent with positive selection for non-synonymous mutations (Hall et al.
2011). Second, if variation in average infectivity and resistance ranges over time reflected error in our sampling of clonal iso-lates from different time points, and not changes in their fre-quency in the population according to selection, individual phenotypes would appear and disappear in our samples across time randomly, rather than increasing and decreasing in
fre-quency gradually, which was more typical in our data set (e.g. Fig. 5). Finally, drift and stochastic effects on the likelihood of cycles (Black & McKane 2012) could only explain the different coevolutionary dynamics between nutrient supply treatments if these processes had a greater effect in low nutrient treatments. This is highly unlikely, given the massive population sizes (in excess of 108bacteria) under both treatments, as well as in our model (~105). However, in the many host–parasite systems where population sizes are smaller than here, stochastic effects may well become relatively more important under low versus high nutrient conditions. This in turn is likely to further increase the difference in the extent of ARD between high and low nutrient conditions, as non-ARD dynamics will be driven by both selection (i.e. range FSD and specialism FSD) and increased stochasticity under low nutrient conditions.
In this study, coevolving communities were only exposed to a single type of nutrient environment (either high or low), yet environmental heterogeneity can play a crucial role in coevo-lutionary dynamics (Thompson 2005). Increased nutrient availability increases population size (Rosenzweig 1995), hence gene flow across environments that vary in nutrient supply is likely to result in populations from high nutrient environ-ments (i.e. populations experiencing ARD) dominating the population as a whole (Hochberg & van Baalen 1998; Forde
et al.2004, 2007; Lopez-Pascuaet al.2010). By contrast, tem-poral variation in nutrient availability, particularly if fast, has recently been shown to impede ARD by constraining selective sweeps (Harrisonet al.2013). It is therefore possible that tem-poral variation in nutrient availability may shift coevolution-ary dynamics towards FSD, while spatial variation shifts dynamics towards ARD.
In conclusion, change in a ubiquitous environmental vari-able, nutrient availability, predictability affect qualitative coevolutionary dynamics and hence the impact of coevolution on other evolutionary and ecological processes. For example, specialism (Hamilton et al. 1990) and potentially range FSD (Sasaki 2000) can favour the evolutionary maintenance of sex-ual reproduction, while ARD probably cannot (Parker 1994). These findings are likely to hold for a range of host–parasite systems in which increased infectivity and resistance ranges can evolve, as is the case for many plant–pathogen (Thomp-son & Burdon 1992) and bacteria–virus interactions (Flores
et al. 2011). From an applied perspective, our results may have important implications for disease emergence. The evolu-tion of parasites with broad genotypic host range are more likely to cause epidemics in new host populations, and poten-tially even adapt more readily to new species (Marston et al.
2012; Poullain & Nuismer 2012) but see Scanlanet al.(2013).
ACKNOWLEDGEMENTS
This work was funded by NERC (UK). ABu was supported by the Royal Society and ABe by a the Leverhulme Trust Early Career Fellowship.
AUTHORSHIP
AH & ABu analysed data; LLP, AH, ABe, MB & ABu wrote the manuscript.
REFERENCES
Agrawal, A. & Lively, C.M. (2002). Infection genetics: gene-for-gene versus matching-alleles models and all points in between. Evol. Ecol. Res., 4, 79–90.
Anderson, R.M. & May, R.M. (1981). The population dynamics of microparasites and their invertebrate hosts.Philos. Trans. R. Soc. Lond. B Biol. Sci., 291, 451–524.
Anderson, R.M. & May, R.M. (1982). Coevolution of hosts and parasites.Parasitology, 85, 411–426.
Bell, G. (1990). The ecology and genetics of fitness in chlamydomonas.1. Genotype-by-environment interaction among pure strains.Proc. R. Soc. Lond. B, 240, 295–321.
Bell, G. (2010). Fluctuating selection: the perpetual renewal of adaptation in variable environments.Philos. Trans. R. Soc. Lond. B Biol. Sci., 365, 87–97.
Best, A., White, A., Kisdi, E., Antonovics, J., Brockhurst, M.A. & Boots, M. (2010). The evolution of host-parasite range.Am. Nat., 176, 63–71. Black, A.J. & McKane, A.J. (2012). Stochastic formulation of ecological
models and their applications.Trends Ecol. Evol., 27, 337–345. Blanquart, F. & Gandon, S. (2013). Time-shift experiments and patterns
of adaptation across time and space.Ecol. Lett., 16, 31–38.
Bohannan, B.J.M. & Lenski, R.E. (2000a). Linking genetic change to community evolution: insights from studies of bacteria and bacteriophage.Ecol. Lett., 3, 362–377.
Bohannan, B.J.M. & Lenski, R.E. (2000b). The relative importance of competition and predation varies with productivity in a model community.Am. Nat., 156, 329–340.
Boots, M. (2011). The evolution of resistance to a parasite is determined by resources.Am. Nat., 178, 214–220.
Boots, M., White, A., Best, A. & Bowers, R. (2014). How specificity and epidemiology drive the coevolution of static trait diversity in hosts and parasites.Evolution, doi:10.1111/evo.12393.
Buckling, A. & Hodgson, D.J. (2007). Short-term rates of parasite evolution predict the evolution of host diversity. J. Evol. Biol., 20, 1682–1688.
Dieckmann, U. & Law, R. (1996). The dynamical theory of coevolution: a derivation from stochastic ecological processes. J. Math. Biol., 34, 579–612.
Doedel, E.J., Champneys, A.R., Dercole, F. (2008) AUTO-07P: Continuation and Bifurcation Software for Ordinary Differential Equations. Available at: http://sourceforge.net/projects/auto-07p/. Last accessed 23 March 2014.
Flor, H.H. (1956). The complementary genetic system in flax and flax rust.Adv. Genet., 8, 29–54.
Flores, C.O., Meyer, J.R., Valverde, S., Farr, L. & Weitz, J.S. (2011) Statistical structure of host-phage interactions.Proc. Natl. Acad. Sci. USA, 108, E288–E297
Forde, S.E., Thompson, J.N. & Bohannan, B.J.M. (2004). Adaptation varies through space and time in a coevolving host-parasitoid interaction.Nature, 431, 841–844.
Forde, S.E., Thompson, J.N. & Bohannan, B.J.M. (2007). Gene flow reverses an adaptive cline in a coevolving host-parasitoid interaction. Am. Nat., 169, 794–801.
Forde, S.E., Thompson, J.N., Holt, R.D. & Bohannan, B.J.M. (2008). Coevolution drives temporal changes in fitness and diversity across environments in a bacteria-bacteriophage interaction. Evolution, 62, 1830–1839.
Frank, S.A. (1993). Specificity versus detectable polymorphism in host-parasite genetics.Proc. R. Soc. Lond. B, 254, 191–197.
Geritz, S.A.H., Kisdi, E., Meszena, G. & Metz, J.A.J. (1998). Evolutionarily singular strategies and the adaptive growth and branching of the evolutionary tree.Evol. Ecol., 12, 35–57
Gomez, P. & Buckling, A. (2011). Bacteria-phage antagonistic coevolution in soil.Science, 332, 106–109.
Hall, A., Scanlan, P.D., Morgan, A.D. & Buckling, A. (2011). Host-parasite coevolutionary arms races give way to flcutuating selection. Ecol. Lett., 14, 635–642.
Hamilton, W.D., Axelrod, R. & Tanese, R. (1990). Sexual reproduction as an adaptation to resist parasites (a review). Proc. Natl. Acad. Sci. USA, 87, 3566–3573.
Harrison, E., Laine, A.L., Hietala, M. & Brockhurst, M.A. (2013). Rapidly fluctuating environments constrain coevolutionary arms races by impeding selective sweeps.Proc. Biol. Sci., 280, 20130937.
Hochberg, M.E. & van Baalen, M. (1998). Antagonistic coevolution over productivity gradients.Am. Nat., 152, 620–634.
Lopez-Pascua, L.D.C. & Buckling, A. (2008). Increasing productivity accelerates host-parasite coevolution.J. Evol. Biol., 21, 853–860. Lopez-Pascua, L.D.C., Brockhurst, M.A. & Buckling, A. (2010).
Antagonistic coevolution across productivity gradients: an experimental test of the effects of dispersal.J. Evol. Biol., 23, 207–211.
Marston, M.F., Pierciey, F.J. Jr, Shepard, A., Gearin, G., Qi, J., Yandava, C. et al. (2012). Rapid diversification of coevolving marine Synechococcus and a virus. Proc. Natl. Acad. Sci. USA, 109, 4544– 4549.
Pal, C., Macia, M.D., Oliver, A., Schachar, I. & Buckling, A. (2007). Coevolution with viruses drives the evolution of bacterial mutation rates.Nature, 450, 1079–1081.
Parker, M.A. (1994). Pathogens and sex in plants.Evol. Ecol., 8, 560–584. Poullain, V. & Nuismer, S.L. (2012). Infection genetics and the likelihood of host shifts in coevolving host-parasite interactions. Am. Nat., 180, 618–628.
Rode, N.O., Charmantier, A. & Lenormand, T. (2011). Male-female coevolution in the wild: evidence from a time series in Artemia franciscana.Evolution, 65, 2881–2892.
Rosenzweig, M.L. (1995).Species Diversity in Space and Time. Cambridge University Press, Cambridge.
Sasaki, A. (2000). Host-parasite coevolution in a multilocus gene-for-gene system.Proc. R. Soc. Lond. B, 267, 2183–2188.
Scanlan, P.D., Hall, A.R., Burlinson, P., Preston, G. & Buckling, A. (2013). No effect of host-parasite co-evolution on host range expansion. J. Evol. Biol., 26, 205–209.
Thompson, J.N. (2005).The Geographic Mosaic of Coevolution. University of Chicago Press, Chicago.
Thompson, J.N. & Burdon, J.J. (1992). Gene-for-gene coevolution between plants and parasites.Nature, 360, 121–125.
Thrall, P.H. & Burdon, J.J. (2003). Evolution of virulence in a plant host-pathogen metapopulation.Science, 299, 1735–1737.
Venail, P.A., MacLean, R.C., Bouvier, T., Brockhurst, M.A., Hochberg, M.E. & Mouquet, N. (2008). Diversity and productivity peak at intermediate dispersal rate in evolving metacommunities. Nature, 452, 210–214.
SUPPORTING INFORMATION
Additional Supporting Information may be downloaded via the online version of this article at Wiley Online Library (www.ecologyletters.com).
Editor, Tadashi Fukami