Infant mortality in the hierarchical merging scenario: dependence on gas
expulsion time-scales
R. Smith,
1‹S. Goodwin,
2M. Fellhauer
1and P. Assmann
11Departamento de Astronomia, Universidad de Concepcion, Casilla 160-C, Concepcion, Chile
2Department of Physics and Astronomy, University of Sheffield, Hicks Building, Hounsfield Road, Sheffield, S3 7RH
Accepted 2012 October 1. Received 2012 August 27; in original form 2011 October 13
A B S T R A C T
We examine the effects of gas expulsion on initially substructured and out-of-equilibrium star clusters. We performN-body simulations of the evolution of star clusters in a static background potential before adjusting that potential to model gas expulsion. We investigate the impact of varying the rate at which the gas is removed, and the instant at which gas removal begins.
Reducing the rate at which the gas is expelled results in an increase in cluster survival. Quantitatively, this dependence is approximately in agreement with previous studies, despite their use of smooth and virialized initial stellar distributions.
However, the instant at which gas expulsion occurs is found to have a strong effect on cluster response to gas removal. We find if gas expulsion occurs prior to one crossing time, cluster response is poorly described byanyglobal parameters. Furthermore, in real clusters the instant of gas expulsion is poorly constrained. Therefore, our results emphasize the highly stochastic and variable response of star clusters to gas expulsion.
Key words: methods: numerical – stars: formation – galaxies: star clusters: general.
1 I N T R O D U C T I O N
Many young stars are found in clusters. The fraction which are found in clusters depends on ones definition of a cluster (see Lada & Lada 2003; Bressert et al. 2010), and how exactly a cluster is defined (bound versus unbound; see e.g. Gieles & Portegies Zwart 2011). However, one looks at it though star ‘clusters’ are clearly an important mode of star formation, if not the dominant mode.
Most stars appear to form in groups of tens to thousands of mem-bers embedded in molecular clouds. The initial distribution of stars follows the complex clumpy and filamentary structure of the under-lying gas (see e.g. Kirk, Johnstone & Tafalla 2007; Gutermuth et al. 2009; Peretto & Fuller 2009; Bressert et al. 2010; di Francesco et al. 2010; Maury et al. 2011). Simulations of initially smooth clouds of molecular gas, which are seeded with supersonic turbulence, frag-ment into filafrag-mentary structures (Bonnell, Bate & Vine 2003; Bate & Bonnell 2004; Bate 2009; Girichidis et al. 2011). These structures may collapse to form stars if they become self-gravitating. It has been argued that clusters form as entities within this complex distri-bution (e.g. Marks & Kroupa 2011) or that they can form afterwards by mergers of stars and stellar groups from this complex distribution (Allison et al. 2009, 2010). Clearly, the initial dynamical state of the young stars will play a crucial role in forming bound clusters or unbound associations (Allison et al. 2009; Gieles & Portegies Zwart 2011).
E-mail: [email protected]
In this paper, we will take the view that clusters form within the hierarchical merging scenario (Allison et al. 2009, 2010) and, together with gas not used in star formation, they form bound ob-jects. Observations show very few young clusters associated with natal gas older than∼5 Myr (Lada & Lada 2003; Lada 2010). It is assumed that feedback from massive stars removes residual gas in a gas expulsion phase. This gas expulsion will significantly alter the potential felt by the stars and can result in the destruction of the cluster (e.g. Tutukov 1978; Hills 1980; Goodwin & Bastian 2006; Baumgardt & Kroupa 2007; Goodwin 2009). This is often cited as the cause of ‘infant mortality’: the apparently high destruction rate of young clusters1(e.g. Lada & Lada 2003).
Previous work on gas expulsion has tended to concentrate on clusters in which the gas and stars are in virial and dynamical equi-librium (but see Verschueren & David 1989; Goodwin 2009). The assumption of virial and dynamical equilibrium for young clusters can be used to infer the initial cluster population and properties from present-day populations (e.g. Parmentier & Gilmore 2007; Baumgardt, Kroupa & Parmentier 2008; Parmentier et al. 2008). However, the assumption of equilibrium initial conditions means that there is a one-to-one correlation between survivability and the initial conditions.
This paper is part of a series in which we examine gas expulsion in the context of the hierarchical merging scenario in which the initial
1Although it should be noted that the importance of infant mortality depends
on one’s definition of a cluster.
C
2012 The Authors
distributions of the stars and gas are not in dynamical equilibrium. Specifically, they have an initial distribution which will cause them to collapse and form a bound cluster within the gas potential (Allison et al. 2009, 2010; Smith et al. 2011a,b).
In this paper, we present a simple numerical experiment exam-ining the evolution of non-equilibrium smallNclusters within a smooth background potential which models the gas. Whilst this is clearly not realistic (at birth stars follow a gas distribution which is extremely complex, see above) we wish to examine the stochas-ticity which complex stellar distributions introduce. As we shall see, statistically identical non-equilibrium clusters can evolve in
verydifferent ways even in our very simple numerical experiments2
and this stochasticity removes the simple correlation between initial conditions and survivability that is so often assumed.
In this paper, we examine theN-body evolution of highly non-equilibrium star clusters in background potentials designed to model the residual gas in young star clusters. Here, we adjust the back-ground potential to model the effects of gas expulsion on different time-scales, starting at different times. We describe our initial con-ditions in Section 2, our results in Section 3, and then discuss the potential consequences in Section 4 before drawing our conclusions in Section 5.
2 I N I T I A L C O N D I T I O N S
In this paper, we present a very simple numerical experiment: a clumpy distribution of equal-mass stars moving in a smooth (Plum-mer) background potential which is then removed to simulate gas expulsion. This experiment isnotmeant to accurately reflect real-ity, rather it is meant to concentrate on a new important variable: complex initial stellar distributions which can introduce (very sig-nificant) stochasticity to the problem of gas expulsion. As we will discuss in Section 4, we feel it emphasizes some crucial physi-cal parameters that would be important in any more sophisticated simulations and, most importantly, in reality.
We perform our N-body simulations using the NBODY6 code
(Aarseth 2003). In our simulations, there are two separate mass distributions which we wish to model: the stars and the background gas potential.
2.1 Initial distributions
In all cases, we model the stellar distribution asN=1000 particles with equal masses of 0.5 Mresulting in a total stellar mass of 500 M. We choose equal-mass particles in order to avoid complex two-body interactions and mass segregation. Allison et al. (2009, 2010) showed that both of these effects can be extremely important in the violent collapse of cool, clumpy regions. However, we wish to avoid complicating our simulations with these effects as we are interested in the effects of gas expulsion.
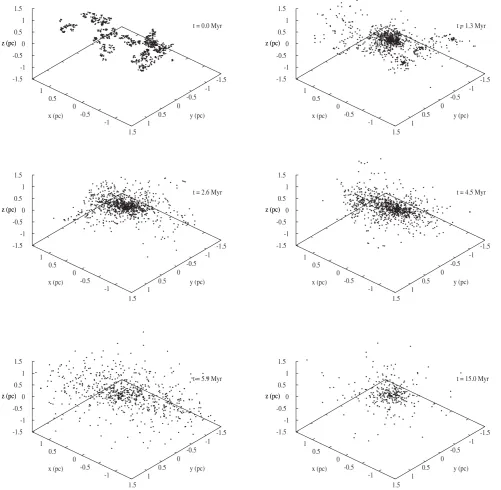
We distribute the stars within a radius of 1.5 pc with a fractal distribution. We choose the fractal dimensionDto be D= 1.6. The fractal is constructed using the box fractal method described in detail in Goodwin & Whitworth (2004, see also Allison et al. 2010). A fractal with D= 1.6 corresponds to a highly clumpy initial distribution (see upper-left panel of Fig. 2). It should be noted that clumpy fractal clusters can vary considerably in appearance depending on the random realization used and their subsequent
2And it is difficult to see how the addition of more realistic physics can
make the problem less stochastic rather than more.
evolution can be highly stochastic (see Allison et al. 2010; Smith et al. 2011a). When investigating their response to varying gas expulsion time-scales, we therefore conduct a minimum of five realizations of any cluster.
The gas within the star-forming region is modelled as a back-ground Plummer potential with a massMg=3450 Mand scale
radiusrg=1.0 pc. The crossing time of the region istcr∼1.3 Myr.
We emphasize that the gas potential does not follow the initial stellar distribution, nor does it react to changes in the stellar dis-tribution as it evolves (it is not live). These are obviously extreme simplifications but, as we will discuss later, we feel that we capture the essence of the basic physics using such a simple model.
We set the initial velocity dispersion of the stars relative to the total potential (gas & stars) with initial stellar virial ratios, Qi,
of 0.2 (subvirial), or 0.5 (virialized). Note that a clumpy stel-lar distribution withQi= 0.5 isnotinitially in dynamical
equi-librium. Thus, the cluster will evolve significantly due to violent relaxation.
2.2 Star formation efficiency
The choice of the initial mass (Mg) and Plummer radius (rg) of
the (Plummer) gas potential sets thetruestar formation efficiency (SFE), i.e. initial fraction of gas that has been turned into stars. For a gas mass ofMg=3450 Mand scale radiusrg=1.0 pc, within
1.5 pc the enclosed gas mass is 2000 M. The stars are distributed out to 1.5 pc, with a total stellar mass ofMs= 500 M. Thus,
within a radius of 1.5 pc the true SFE is 20 per cent.
We note that this is below the critical SFE for the survival of a bound core from an initially virialized star–gas distribution with instantaneous gas expulsion (∼30 per cent; Goodwin & Bastian 2006; Baumgardt & Kroupa 2007), and at the lower bound for the survival of a bound core for adiabatic gas expulsion (Baumgardt & Kroupa 2007).
2.3 Gas expulsion
Although young star clusters form embedded within the molecular gas from which they are formed, few star clusters over∼5 Myr old remain associated with their gas (Lada & Lada 2003; Proszkow & Adams 2009). This is likely as a result of a number of mechanisms including radiative feedback from massive stars, stellar winds from young stars and eventually the first supernova(e). The time at which gas removal begins to occur and the duration of the gas removal process is uncertain, and dependent on the particular gas removal mechanism in operation.
One of the main aims of our simulations is to examine the de-coupling of the gas and starsbeforegas expulsion. If the gas and/or stars are not in equilibrium either as a whole, or with each other, then the relative distributions of the gas and stars will change. As shown in our previous papers, (Smith et al. 2011a,b) if the stars can collapse relative to the gas distribution then the effect of gas expulsion is less important (see also Goodwin 2009, and references therein).
To simulate gas expulsion, we parametrize the time evolution of the mass of the gas potential as
Mg(t)=
Mg(0)
1+M˙(t−texp)
, (1)
wheretexpis the time at which gas expulsion begins and ˙Mcontrols
0 1 2 3 4 5 6 7 8 9 10 11
Crossing times tcr
0 0.1 0.2 0.3 0.4 0.5 0.6 0.7 0.8 0.9 1
Gas mass (normalised)
t
dur= 0.01 myr
tdur= 5 myr t
dur= 50 myr
BK07 τm=0.1 tcr
BK07 τm=1.0 tcr
[image:3.595.48.288.57.232.2]BK07 τm=2.0 tcr
Figure 1. Plot of evolution of gas mass with time using equation (1) (black curves), assumingtcr=1.3 Myr.tduris the length of time required for the
gas mass to be reduced to 99 per cent of its initial value. Whentduris short,
gas loss occurs over a short duration. Our slowest gas mass-loss is when tdur=50 Myr. For comparison, we include curves of the evolution of gas
mass from Baumgardt & Kroupa (2007) (red curves).τmis the parameter
from Baumgardt & Kroupa (2007) controlling the rate of gas loss. We see thattdur=50 Myr results in similar gas mass-loss to whenτm=1–2 crossing
times.
We choose ˙Msuch that the gas massMg(t) is reduced to 1 per
cent of its initial valueMg(0) over a specified duration of timetdur.
For example, iftexp=1 Myr andtdur=5 Myr, then gas expulsion
begins 1 Myr after the beginning of the simulation, and 99 per cent of the gas will be gone 5 Myr later.
We test the response of a cluster to four values when gas expulsion begins (texp: 0.1, 1, 5 and 9 Myr), and four values for how fast
gas expulsion occurs (tdur: 0.01, 1.0, 5.0 and 50.0 Myr). These
time-scales of gas expulsion cover the reasonable range of possible gas expulsion time-scales from instantaneous to extremely slow (adiabatic) compared to the crossing time. It is unclear what the typical gas expulsion time-scales are, and they may depend on cluster mass (Kroupa & Boily 2002). For example, the relatively late supernovae of a low-mass O star might result in a delayed start to gas expulsion.
In Fig. 1, we illustrate the reduction in gas mass for gas expulsion that begins effectively immediately (texp: 0.1 Myr) and occurs over
a durationtdur: 0.01, 1.0, 5.0 and 50.0 Myr (black curves). We note
that Baumgardt & Kroupa (2007) use an exponential form for the evolution of the gas mass that differs from ours in detail, but not in essence.
The Baumgardt & Kroupa (2007) form is shown in Fig. 1 as red curves (labelled BK07). We see that our slowest gas mass reduction (tdur = 50 Myr) can be considered approximately equivalent to
the gas mass-loss in Baumgardt & Kroupa (2007) whenτm=1–2
crossing times. We emphasize that while a 50 Myr duration (i.e. until 99 per cent gas loss) for gas expulsion may sound unrealistically lengthy, this is merely a result of the analytical form that we have used to model gas expulsion.
2.4 Cluster properties at time of gas expulsion
For a star–gas cluster which is initially smooth and in virial equi-librium (i.e. in dynamical equiequi-librium) and is no longer forming
stars, its response to gas expulsion can be characterized by two pa-rameters. First, the true SFE, the relative gas mass to stellar mass (which does not change as the cluster is in equilibrium). Secondly, the time-scale of gas expulsion from instantaneous (in less than a crossing time) to adiabatic (in several crossing times). See e.g. Baumgardt & Kroupa (2007).
However, Goodwin (2009) points out that the important variables are actually the virial state of the stars at the onset of gas expulsion and the time-scale of gas expulsion. In an initially virialized cluster the virial state of the stars can be found directly from the true SFE. However, if the cluster is not in equilibrium initially, then the virial state of the stars corresponds to aneffectiveSFE which can be very different from the true SFE (see also Verschueren & David 1989; Goodwin & Bastian 2006).
In Smith et al. (2011a), we parametrize the effective SFE using two more physically meaningful quantities. The local stellar fraction (LSF) is a measure of the mass of gas in the region where the stars are found (a form of evolving effective SFE). We also define the virial ratioof the starsat the moment of gas expulsionQge.
The LSF is defined as
LSF= M(r < rh(s))
M(r < rh(s))+Mg(r < rh(s))
, (2)
whererh(s)is the half-mass radius of the stars, andM andMgare
the mass of stars and gas, respectively.
The key aspects of the LSF andQge are that they evolve with
the dynamical evolution of the cluster. In Smith et al. (2011a) we found the LSF andQge(measured when gas expulsion begins) to be
effective predictors of the response of an initially out-of-equilibrium cluster toinstantaneousgas expulsion after a few crossing times (in their case 2.5 initial crossing times).
We measure the survival of clusters to gas expulsion by measuring the fraction of stars that are bound to the cluster att= 15 Myr. Where substructure remains following gas expulsion, we choose the most massive subclump to be the main cluster. We measure the number of stars that are bound to the cluster within the inertial frame of the cluster. This is because some clusters have a net velocity though simulation space is following gas expulsion. To calculate the average velocity, we use only stars within a specific radius of the cluster centre. We vary the radius to ensure that our final bound fraction is not sensitive to the radius we choose. When measuring the bound fraction we only include stars that are bound to the main cluster, and exclude stars that are bound to small subclumps in any remaining substructure.
2.5 Summary
We set-up clumpy 500 M star clusters with N= 1000 equal-mass particles within a static background gas potential. The initial dynamical state of the stars varies from cool and subvirial (Qi=
0.2) to virialized (Qi=0.5). We then allow the stars to dynamically
evolve within the gas potential. Gas expulsion begins at a timet= texp. We varytexpfrom 0.1 Myr (essentially immediate gas expulsion)
to 9 Myr (∼7 crossing times). At thestartof gas expulsion, we measure the LSF of the cluster and stellar virial ratio (Qge). We
also vary the rate at which gas expulsion occurs by setting the parametertdur(the amount of time required for 99 per cent of the
gas to be expelled). We consider four values:tdur=0.01, 1.0, 5.0,
-1 -0.5 0 0.5 1
-1.5 -1 -0.5 0 0.5 1 1.5 -1.5
-1 -0.5
0 0.5
1 1.5
z (pc)
t = 0.0 Myr
x (pc) y (pc)
z (pc)
-1 -0.5 0 0.5 1
-1.5 -1 -0.5 0 0.5 1 1.5 -1.5
-1 -0.5
0 0.5
1 1.5
z (pc)
t = 1.3 Myr
x (pc) y (pc)
z (pc)
-1 -0.5 0 0.5 1
-1.5 -1 -0.5 0 0.5 1 1.5 -1.5
-1 -0.5
0 0.5
1 1.5
z (pc)
t = 2.6 Myr
x (pc) y (pc)
z (pc)
-1 -0.5 0 0.5 1
-1.5 -1 -0.5 0 0.5 1 1.5 -1.5
-1 -0.5
0 0.5
1 1.5
z (pc)
t = 4.5 Myr
x (pc) y (pc)
z (pc)
-1 -0.5 0 0.5 1
-1.5 -1 -0.5 0 0.5 1 1.5 -1.5
-1 -0.5
0 0.5
1 1.5
z (pc)
t = 5.9 Myr
x (pc) y (pc)
z (pc)
-1 -0.5 0 0.5 1
-1.5 -1 -0.5 0 0.5 1 1.5 -1.5
-1 -0.5
0 0.5
1 1.5
z (pc)
t = 15.0 Myr
x (pc) y (pc)
[image:4.595.42.544.59.549.2]z (pc)
Figure 2. The evolution of an initially fractal (D=1.6) stellar distribution in anrg=1 pc,Mg=3450 Mgas potential. The initial virial ratio of the stellar
distribution within the gas background potential isQi=0.2. The time of each snapshot is indicated in the top-right-hand corner of each panel. Initial clumpy
substructure is erased with time. Instantaneous gas expulsion occurs at 5 Myr, resulting in unbound stars. By 15 Myr the final cluster is settled.
3 R E S U LT S
3.1 A representative example
We will first present a representative example, before focusing on the impact of the gas expulsion time-scales. In Fig. 2 we present an example of the evolution of an initially fractalD=1.6 stellar distribution with an initial virial ratio ofQi=0.2 in the gas potential.
The true SFE of this system is=0.2. In this particular example, gas expulsion begins at 5 Myr and then the gas is removed effectively instantaneously. The crossing time of the region is∼1.3 Myr.
0 0.2 0.4 0.6 0.8
LSF
0 0.2 0.4 0.6 0.8
fbo
u
nd
texp=4-7 tcr t
dur=0.01 myr
t
dur=5 myr
[image:5.595.50.288.56.227.2]tdur=50 myr
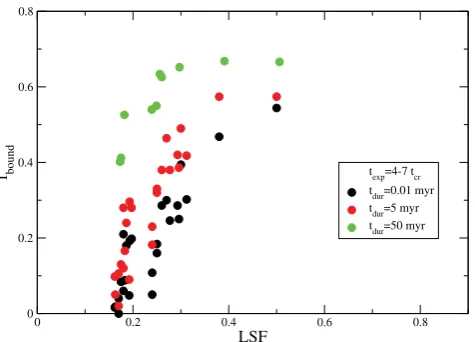
Figure 3. Final bound fraction of starsfboundversus LSF for clusters where texp=4–7tcr. Symbol colour denotes the duration over which gas expulsion
occurs (see legend). A trend for increasingfboundwith increasing LSF can
be seen. If gas expulsion occurs more slowly, this trend shifts vertically upwards in the diagram. By eye, our slowest gas removal rate appears to result in an approximate increase infboundof∼0.3.
of these escaping stars are still associated with the cluster, but by 15 Myr (last panel) only a virialized bound core of stars remain.
The cool, clumpy initial distribution of the stars in this simulation cause them to collapse towards the centre of the gas potential. This causes the stars to virialize (i.e.Qgeto approach 0.5), but it also
causes the LSF to increase significantly as the stars are concentrated in the centre of the gas potential. For example, in Fig. 2, the initial distribution of stars has an LSF=0.24 (close to the true SFE), but the final LSF at the time of gas expulsion has increased to 0.41.
3.2 Effects of varying the rate of gas expulsion
In all simulations, we evolve our stellar initial conditions in the gas potential until gas expulsion begins. At the start of gas expulsion we measure the LSF (see equation 2) and the virial ratioQge.
We simulate the evolution of 10 different realizations. For each ensemble we model gas expulsion occurring attexp=0.1, 1.0, 5.0
and 9.0 Myr. For each chosentexp, we model four durations over
which the gas is expelled:tdur=0.01, 1.0, 5.0 and 50 Myr. We use Qi=0.2 and 0.5. In total, we conduct 90 simulations. All
simu-lations are conducted for 15 Myr in total (∼11.5initialcrossing times), when the final bound fractionfbound of the cluster is
mea-sured.
The results of thetexp=5.0–9.0 Myr (texp=4–7 crossing times)
simulations are shown in Fig. 3 (we turn later to the effects of differ-enttexp). We plot the final bound fractionfboundof the cluster against
the LSF at the start of gas expulsion. The colour of the filled circle symbols denotes the duration over which their gas was removed. For clarity in Fig. 3, we exclude thetdur=1 Myr points, this gas
removal time-scale is effectively instantaneous and the results are indistinguishable from thetdur=0.01 Myr points. The black
sym-bols have almost instantaneous gas expulsion (tdur=0.01 Myr). The
red symbols lose their gas marginally more slowly (tdur=5 Myr)
and the green symbols lose their gas the most slowly of all (tdur=
50 Myr). (For reference see Fig. 1.)
A trend can be seen in the relation betweenfboundand the LSF
in Fig. 3. First, as expected, lower LSFs tend to result in lower bound fractions. Also, as expected, slower gas removal (tending to
0 0.5 1 1.5 2 2.5 3 3.5 4 4.5 5 5.5 6 6.5
Crossing-times (t/tcr)
0 0.2 0.4 0.6 0.8 1
Q(t)
Figure 4. Evolution of the stellar virial ratio of five different fractal clusters. All start with a total virial ratio ofQi=0.5.
adiabatic) tends to result in higher bound fractions (cf. Baumgardt & Kroupa 2007).
However, for low LSFs there is a wide spread in the final bound fractions. For LSFs of∼0.2 (similar to the initial, true SFE), the bound fractions vary between zero and over half. The largest bound fractions (all>0.4) occur for adiabatic gas loss which is far less destructive (see above), but for an intermediate gas loss time-scale of 5 Myr the spread is between 0 and 0.3. We will return to this in the next section.
We do find broad agreement with the results of Baumgardt & Kroupa (2007) once the differences in our parametrization of the gas expulsion time-scale and our use of the LSF rather than true SFE are taken into account. Our LSF values are typically between 0.2 and 0.4. We therefore compare with the Baumgardt & Kroupa (2007) results for true SFEs in the same range. The upper-left panel of fig. 2 of Baumgardt & Kroupa (2007) shows that their bound fraction also increases by 20–40 per cent between their effectively instantaneous and their adiabatic gas expulsion time-scales. Inspection of Fig. 3 shows a similar relationship, albeit withmuchmore scatter.
3.3 The evolution of the dynamical state of the stars
The scatter we find in the LSF–fboundrelationship for a given gas
expulsion onset and duration comes from two sources. It is due to differences in the dynamical state of the stars at the onset of gas expulsion which, in turn, is due to the stochastic evolution of the initially non-equilibrium stellar distribution.
Fig. 4 shows the evolution of thestellar virial ratios for five different fractals that initially have a total virial ratio ofQi=0.5. The
stellar virial ratio is the virial ratio of the stars alone. We note that the potential of any individual star has a component from surrounding stars and another component from the surrounding gas potential. Both components are included in the virial ratio calculation.
[image:5.595.312.549.57.231.2]0 1 2 3 4 5 6 7 Crossing times (t/t
cr) 0
0.05 0.1 0.15 0.2 0.25 0.3 0.35 0.4 0.45 0.5
P
eak val
u
es of |(Q(t)-0.5)|
Q
i=0.5
Q
[image:6.595.45.284.58.227.2]i=0.2
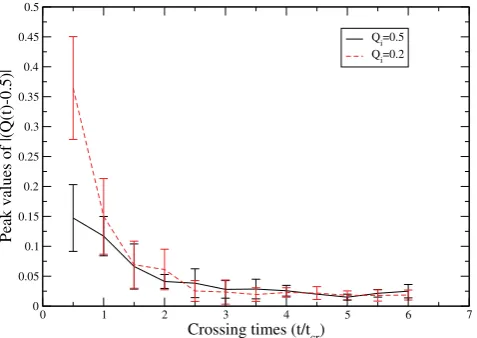
Figure 5. Evolution of peak values of|(Q(t)−0.5)|for 10 different initially virialized (Qi=0.5) fractals and 10 different cool (Qi=0.2) fractals. The
average (and standard deviation) of the peak values are binned into half crossing-time time-bins. The peak values are initially larger, then reduce in size as the clusters attempt to virialize. Initially,Qi=0.2 fractals have larger
deviations from virialized. After∼1.5 crossing times,Qevolution ofQi=
0.2 and 0.5 are similar. After 4–5 crossing times, fractals have settled close to virialized.
Smith et al. (2011a) found that the stellar virial ratio at the onset of gas expulsion is important to the cluster’s response to gas expul-sion (see also Goodwin 2009). If the stellar virial ratio is slightly supervirial (Qge>0.5), then the cluster will loose more stars (lower fbound), whilst if they are slightly subvirial (Qge <0.5), then the
cluster will retain more stars (higherfbound). However, Smith et al.
(2011a) only examined instantaneous gas expulsion after 2.5 cross-ing times.
To investigate the effects ofQgewith different starting times and
durations of gas expulsion we record the peak values of the deviation of the stellar distribution from virial equilibrium (|(Q−0.5)|) and the time at which these maximum deviations occur. We conduct this test both for 10 different clusters that are initially globally virialized (Qi=0.5) and 10 different clusters that are initially globally cool
(Qi=0.2). We calculate the mean and standard deviation of the
peak values of|(Q−0.5)|in bins of half an initial crossing time. The results are presented in Fig. 5.
Fig. 5 quantifies what is visible in Fig. 4. Deviations from virialized clusters are greater at early times as the stellar com-ponent relaxes. They are also greater in initially globally cool clusters (Qi = 0.2) as they have to relax more to reach (rough)
equilibrium.
We can predict that the stellar virial ratio will be an important factor in that it will vary more and be more stochastic, at early times. First, the further clusters start away from equilibrium (dynamical or virial), the greater the initial variations can be. Secondly, the shorter the amount of time clusters have had to relax, the greater the variations can be.
3.4 The survival of clusters
From the above results and discussions, we can see that the response of a cluster to gas expulsion and the possible survival of a bound core as a remnant cluster depend on several factors.
The relative importance of the gas potential to the stars (as mea-sured by the LSF) is clearly very important. This, however, depends on the way in which the stellar distribution has relaxed relative to
the gas and depends on the initial distribution (in this case highly clumpy) and initial velocity dispersion (measured by the total initial virial ratioQi) of the stars. It also depends on the exact dynamical
state of the stars at the moment when gas expulsion occurs (Qge).
And both the LSF andQgedepend to some extent on the stochastic
details of the relaxation of each particular realization (see Allison et al. 2010). The reaction of the cluster to gas expulsion also depends on the time-scale of gas expulsion, with long (adiabatic) time-scales being much less destructive.
In addition, as we will explore in this section, both the LSF and especiallyQgeevolve rapidly, especially in the first 1–2 crossing
times and so the effect of gas expulsion will depend strongly on the time of the onset of gas expulsion.
We have already investigated the effect of varying the rate of gas expulsion in Section 3.2. We now focus on the effect of varying the instant at which gas expulsion occurs, and fix the rate of gas expulsion to be effectively instantaneous.
Fig. 6 shows the LSF-fboundrelationships for early gas expulsion
(top panel,texp <1tcr), intermediate gas expulsion (middle panel,
texp=1.5–2.0tcr) and late gas expulsion (bottom panel,texp=4−
7tcr). For all data points shown, when gas expulsion begins, the gas
is removed instantaneously. Plotted on each panel in light crosses are the results from Smith et al. (2011a) instantaneous gas expulsion attexp=2.5tcrfor reference. We combine the results forQi=0.5
and 0.2 star clusters in Fig. 6.
The points marked with blue filled circles have a low stellar virial ratio at the moment of the onset of gas expulsion (Qge<0.46), the
open circles are roughly virialized (0.46<Qge< 0.54) and red
squares are supervirial (Qge>0.54).
The top panel shows the results for the early onset of gas expul-sion. Early gas expulsion results in gas expulsion occurring whilst the stars are still relaxing. They tend to have a low virial ratio (Qge <0.46) as they are still collapsing into a new equilibrium,
and their LSF tends to be low (close to the true SFE) as they are still fairly widely distributed in the gas potential. The huge scatter in this top panel is due to the highly stochastic nature of the early dynamics of the clusters. Many of these clusters will still contain subclumps (see Fig. 2) and the bulk dynamics of these subclumps is important. At these stagesQgeis not a good indicator of survival
as much of the stellar kinetic energy can be contained in bound clumps. If these clumps escape due to gas expulsionfboundwill be
low (or even zero); however, retaining one or two subclumps can result in a very highfbound. Clumps also raise the stellar-to-gas
frac-tion very locally at their centres. The LSF is insensitive to this as it measures the stellar-to-gas fraction on scales that are typically much larger than individual clumps (i.e. the half-mass radius of the stars).
For intermediate gas expulsion time-scales (middle panel) the LSF becomes more important as the clusters tend to have had the time to relax into a smooth central cluster. More clusters are roughly virialized and there is a trend offbounddecreasing with lower LSF
as would be expected. As clusters are oscillating around virial equi-librium within the gas potential, the spread infboundfor a given LSF
is wide. At a fixed LSF, subvirial clusters tend to higherfboundthan
supervirial clusters. Therefore, at intermediate gas expulsion time-scales, a combination ofQgeand LSF determine the response to gas
expulsion.
For long gas expulsion time-scales (bottom panel) the clusters have had a chance to virialize within the gas potential and so the relationship between the LSF andfboundbecomes much tighter with
0 0.2 0.4 0.6 0.8
LSF
0 0.2 0.4 0.6 0.8
fbo
u
nd
t
exp <1 tcr
Qf<=0.46 Qf>=0.54 0.46<Q
f<0.54
old data (2.5 t
cr)
0 0.2 0.4 0.6 0.8
LSF
0 0.2 0.4 0.6 0.8
fbo
u
nd
0 0.2 0.4 0.6 0.8
0 0.2 0.4 0.6 0.8
t
exp=1.5-2 tcr
Qf<=0.46 Q
f>=0.54
0.46<Q
f<0.54
old set (2.5 t
cr)
0 0.2 0.4 0.6 0.8
LSF
0 0.2 0.4 0.6 0.8
fbo
u
nd
t
exp=4-7 tcr
Qf<=0.46 Qf>=0.54 0.46<Qf<0.54 old set (2.5 t
[image:7.595.49.288.53.598.2]cr)
Figure 6. Final bound fraction of starsfboundversus LSF for clusters with
early gas removal (texp<1tcr, upper panel), intermediate gas removal time
(texp=1.5–2.0tcr, middle panel), and late gas removal (texp =4–7tcr,
lower panel). In these models, when gas expulsion begins, it is effectively instantaneous (tdur=0.01 Myr). Clusters withQi =0.5 result in lower
LSF values, whereasQi =0.2 clusters result in higher LSF values. The
stellar virial ratio at the onset of gas expulsionQge is either low (blue
circles,Qge<0.46), roughly virialized (open circles, 0.46<Qge<0.54),
or high (red circles,Qge > 0.54). Light crosses show the results from
Smith et al. (2011a) for instantaneous gas expulsion attexp =2.5tcrfor
reference.
0 0.2 0.4 0.6 0.8
LSF
0 0.2 0.4 0.6 0.8
f bou
nd
[image:7.595.311.549.59.228.2]plummer fractal sfe=60%
Figure 7. Final bound fraction of starsfboundversus LSF for clusters with
instantaneous gas expulsion attexp=2.5tcr. Results from Smith et al. (2011a)
where the SFE is 20 per cent, and using an initial distribution of stars that is ‘Plummer-like’ (black circles), and fractal (red triangles). New results are shown for clusters with matching properties to the fractals (red triangles), but a much higher SFE of 60 per cent (green squares). The scatter in the bound fraction is not highly sensitive to the form of the initial clumpy stellar morphology we choose, nor to the SFE.
3.5 Dependence on initial stellar morphology and star formation efficiency
First, we wish to test how sensitive our results are to the mathemat-ical form of the initial clumpy distribution of stars we have chosen. To do this, we use models from Smith et al. (2011a) where we con-sidered two types of clumpy distributions (or stellar morphologies) for the initial positions of our stars; fractal (like those modelled in this paper) and ‘Plummer-like’. In the ‘Plummer-like’ distribution there are 16 clumps of stars in total, and each clump is modelled as an individual Plummer sphere of mass∼30 Mand Plummer scalelength∼0.05 pc. The clumps themselves are distributed ac-cording to a Plummer distribution with a Plummer scalelength of 1–1.5 pc). Further details can be found in Smith et al. (2011a).
In Fig. 7 we show the final bound fraction of starsfboundversus
LSF for clusters from Smith et al. (2011a), but split into ‘Plummer-like’ (black circles) and fractal (red triangles). We recall that both groups have equal SFE of 20 per cent, and both undergo instanta-neous gas expulsion after 2.5 crossing times – they differ only in their initial stellar morphology. We find that the trend, and its scatter in bound fraction, is not highly sensitive to which form of clumpy stellar morphology we choose. Two apparently separated groups of Plummer-like models are seen at high and low LSF. However, this is mainly just a result of low numbers of Plummer-like models with
Qi=0.2–0.4, whose presence would fill the gap between the two
groups.
Secondly, we wish to test if our results differ when we consider clusters whose mass is dominated by stars, as we have so far only considered clusters that are heavily dominated by gas. Therefore, we model 20 clusters with a much higher SFE of 60 per cent (green squares). These differ from the fractals in Fig. 7 in their SFE only. As expected, these clusters fall in the high LSF range. More im-portantly, we find that there is still a similar amount of scatter at higher SFE – despite the fact that the stars now dominate the mass of the cluster. In fact, the virial state at the time of gas expulsion
Qgecontinues to play the same role, broadening the trend, as when
In summary, the trend and its scatter is not very sensitive to the form of the initial clumpy stellar morphology we choose, nor to the SFE (i.e. the strength of the rigid background potential).
4 D I S C U S S I O N
We have examined the response of young clusters to gas expulsion as measured by their ability to retain a bound core of stars and avoid complete destruction: their survivability.
Clusters older than∼5 Myr are not seen to be associated with the gas from which they formed. There are two possibilities for the fate of this gas. First, that all of the gas was used in star formation (100 per cent efficiency). However, this is unlikely as shortly after a massive (O or B) star forms it will heat the gas and remove it from the site of star formation (through winds, ionizing radiation or supernovae). The removal of a (very significant) fraction of the (gas) mass in a region will have a (very significant) effect on the potential felt by the stars that remain. If the stars are unbound or very loosely bound at formation they will be dispersed, and gas expulsion merely speeds this process somewhat. However, if the stars are bound then gas expulsion can completely destroy the cluster, or leave a bound core which will be seen as a naked cluster. It must happen that bound cores are left after gas expulsion as many old, bound clusters are seen (most strikingly, globular clusters).
A key question to address is what can be said about the initial conditions of old, bound clusters? What must be true is that they have survived gas expulsion and therefore they must have been bound at the onset of gas expulsion.
Most previous work on gas expulsion has concentrated on clusters that are in virial and dynamical equilibrium at the onset of gas expulsion (see e.g. Tutukov 1978; Hills 1980; Goodwin & Bastian 2006; Baumgardt & Kroupa 2007). In such a situation the primary factor controlling the survival of a cluster is the true SFE, secondary factors are the time-scale of gas expulsion (adiabatic gas expulsion is less destructive) and the tidal radius (expansion over the tidal radius can rapidly destroy a cluster), as shown in detail by Baumgardt & Kroupa (2007).
However, observations of star formation lead us to believe that stars do not form in equilibrium. They certainly seem to form in a complex distribution that follows the gas (e.g. Larson 1995; Testi et al. 2000; Cartwright & Whitworth 2004; Gutermuth et al. 2005, 2009; Allen et al. 2007; Kirk et al. 2007; Schmeja, Kumar & Ferreira 2008; Peretto & Fuller 2009; Bressert et al. 2010; di Francesco et al. 2010; Maury et al. 2011), they seem to form with a lower velocity dispersion than the gas (Andr´e 2002; Walsh, Myers & Burton 2004; Adams et al. 2006; Peretto, Andr´e & Belloche 2006; Kirk et al. 2007; Proszkow & Adams 2009) and their early evolution appears to be dramatic (e.g. Bastian et al. 2008; Allison et al. 2009, 2010).
In this paper, we have shown that if the initialstellardistribution is out-of-equilibrium then the effect of gas expulsion can be very stochastic (see also Smith et al. 2011a,b). In particular, there are several key factors.
(i) The effective SFE (measured by us as the LSF): the relative stellar and gas masses at the onset of gas expulsion (see also Ver-schueren & David 1989; Goodwin 2009). The higher the effective SFE, the greater the survivability.
(ii) The stellar virial ratio (Qge): the virial state of thestarsalone
at the onset of gas expulsion. The lower the stellar virial ratio, the greater the survivability.
(iii) The time of the onset of gas expulsion: this effects to what extent the stars and gas can relax and/or decouple and so changes
the effective SFE and stellar virial ratio. From our simulations, the earlier the onset of gas expulsion the greater the stochasticity in survivability.
(iv) The time-scale of gas expulsion: instantaneous gas expulsion is more destructive than adiabatic (see also Baumgardt & Kroupa 2007).
(v) Tidal radius: whilst we have not simulated this, there is no reason to think it should not have the same effect as that found by Baumgardt & Kroupa (2007).
The first four of these factors are all stochastic and depend on the details of the initial conditions.
We reiterate here that our initial conditions are not realistic. We evolve equal-mass stars in a static background potential which we then remove in a simplistic way. However, we find it impossible to see how more realism could possibly produceless stochastic-ity. Indeed, more realistic initial conditions should introduce vast quantities of variables that are potentially important.
For example, a realistic clumpy, live gas potential could react in very different ways. Depending on the details of the gas it could couple well to the stars (i.e. lower the LSF by moving with the stars), or couple badly (by being accreted or removed from sub-clumps; e.g. Kruijssen et al. 2012). Depending on the structure of the gas, feedback could be less efficient, possibly escaping through bubbles (e.g. Dale & Bonnell 2011), changing the onset of signifi-cant gas expulsion and/or its time-scale. In addition, realistic small
Nsubclumps would contain a mass spectrum of stars, include bi-naries and have a wealth of possibleN-body interactions that are extremely stochastic on their own (Allison et al. 2010).
In summary, there is no reason to think that if one cluster survives and another does not, they had very different initial conditions. Two sets ofstatisticallyidentical initial conditions can produce a cluster that retains most of its stars or one that is completely destroyed. The final outcome depends on a wealth of different variables (only a handful of which we have rather simplistically modelled here), as well as the details of the initial conditions.
5 S U M M A RY A N D C O N C L U S I O N S
We performN-body simulations of substructured, non-equilibrium 2500 Mclusters with 500 Mof stars inN=1000 equal-mass particles. A static background potential provides a gas mass of 2000 M surrounding the stars. The initial true SFE is fixed at 20 per cent. Gas expulsion is modelled as a reduction in the mass of the background potential over time. We allow the instant that gas expulsion begins, and the duration over which gas expulsion occurs, to vary.
We use two parameters to characterize the state of the cluster at the moment of gas expulsion. The LSF is a measure of the relative contribution of gas and stars to the potential felt by the stars. The stellar virial ratio is a measure of how relaxed the stellar component is.
Our key results may be summarized as follows.
(i) In initially clumpy and non-equilibrium clusters, a slower rate of gas loss increases the survival of the cluster (in keeping with previous results).
(ii) If gas is expelled within an initial crossing time the effect of gas expulsion is completely stochastic and there are no good global indicators of its effects.
to the stars) and stellar virial ratio is required to parametrize cluster survival, although it is still rather stochastic.
(iv) If gas is expelled after several crossing times the stellar com-ponent is generally relaxed and the LSF alone is a good indicator of the effects of gas expulsion. However, the LSF can substantially differ from the true SFE due to the decoupling of the gas and stars. Our simulations have been very simple numerical experiments. However, we feel they do capture some important physics.
First, the coupling of the stars and gas is crucial to the survival of a cluster. If the stars are able to relax to a more concentrated distribution than the gas (or conversely, if the gas is able to expand relative to the stars), then the dramatic effects of gas expulsion are reduced.
Stochasticity is important: the exact level of decoupling from the gas, and the details of the stellar phase space distribution are also crucial. Gas expulsion whilst the stars are still ‘clumpy’ can com-pletely destroy one cluster, whilst leaving another – statistically identical – cluster with most of its stars in a bound cluster. This depends on the bulk virial ratio of the stars, and also the details of the clump velocities. It is only after several initial crossing times – after a cluster has relaxed into a rough equilibrium – that ticity reduces in importance. However, even at this point, stochas-ticity in the earlier evolution can still influence the final equilibrium configuration.
We would argue that more realistic initial conditions and physics (e.g. a mass spectrum of stars, a clumpy live gas potential, feedback, etc.) can only work to make the problemmore stochastic, rather than less. Therefore, we contend that it is impossible to give a ‘standard’ outcome for any statistically identical clusters: some will be destroyed, while others will survive with different mass and structure. For this reason, it is impossible to go backwards from an observed surviving cluster to its initial conditions except in a very broad statistical sense. Therefore, we urge caution in deriving the initial cluster population from an observed naked cluster population.
AC K N OW L E D G M E N T S
MF acknowledges support through FONDECYT grant 1095092, RS was financed through a combination of FONDECYT grant 3120135 and a COMITE MIXTO grant, and PA was financed through a CONCICYT PhD Scholarship.
R E F E R E N C E S
Aarseth S. J., 2003, GravitationalN-Body Simulations. Cambridge Univ. Press, Cambridge
Adams F. C., Proszkow E. M., Fatuzzo M., Myers P. C., 2006, ApJ, 641, 504
Allen L. et al., 2007, in Reipurth B., Jewitt D., Keil K., eds, Protostars and Planets V. Univ. of Arizona Press, Tucson, p. 361
Allison R. J., Goodwin S. P., Parker R. J., de Grijs R., Portegies Zwart S. F., Kouwenhoven M. B. N., 2009, ApJ, 700, L99
Allison R. J., Goodwin S. P., Parker R. J., Portegies Zwart S. F., de Grijs R., 2010, MNRAS, 407, 1098
Andr´e P., 2002, Ap&SS, 281, 51
Bastian N., Gieles M., Goodwin S. P., Trancho G., Smith L. J., Konstan-topoulos I., Efremov Y., 2008, MNRAS, 389, 223
Bate M. R., 2009, MNRAS, 397, 232
Bate M. R., Bonnell I. A., 2004, in Lamers H. J. G. L. M., Smith L. J., Nota A., eds, ASP Conf. Ser. Vol. 322, Computer Simulations of Star Cluster Formation via Turbulent Fragmentation. Astron. Soc. Pac., San Francisco, p. 289
Baumgardt H., Kroupa P., 2007, MNRAS, 380, 1589
Baumgardt H., Kroupa P., Parmentier G., 2008, MNRAS, 384, 1231 Bonnell I. A., Bate M. R., Vine S. G., 2003, MNRAS, 343, 413 Bressert E. et al., 2010, MNRAS, 409, L54
Cartwright A., Whitworth A. P., 2004, MNRAS, 348, 589 Dale J. E., Bonnell I., 2011, MNRAS, 414, 321 di Francesco J. et al., 2010, A&A, 518, L91
Gieles M., Portegies Zwart S. F., 2011, MNRAS, 410, L6
Girichidis P., Federrath C., Banerjee R., Klessen R. S., 2011, MNRAS, 413, 2741
Goodwin S. P., 2009, Ap&SS, 324, 259
Goodwin S. P., Bastian N., 2006, MNRAS, 373, 752 Goodwin S. P., Whitworth A. P., 2004, A&A, 413, 929
Gutermuth R. A., Megeath S. T., Pipher J. L., Williams J. P., Allen L. E., Myers P. C., Raines S. N., 2005, ApJ, 632, 397
Gutermuth R. A., Megeath S. T., Myers P. C., Allen L. E., Pipher J. L., Fazio G. G., 2009, ApJS, 184, 18
Hills J. G., 1980, ApJ, 235, 986
Kirk H., Johnstone D., Tafalla M., 2007, ApJ, 668, 1042 Kroupa P., Boily C. M., 2002, MNRAS, 336, 1188
Kruijssen J. M. D., Maschberger T., Moeckel N., Clarke C. J., Bastian N., Bonnell I. A., 2012, MNRAS, 419, 841
Lada C. J., 2010, R. Soc. Lond. Philos. Trans. Ser. A, 368, 713 Lada C. J., Lada E. A., 2003, ARA&A, 41, 57
Larson R. B., 1995, MNRAS, 272, 213 Marks M., Kroupa P., 2011, MNRAS, 417, 1702
Maury A. J., Andr´e P., Men’shchikov A., K¨onyves V., Bontemps S., 2011, A&A, 535, A77
Parmentier G., Gilmore G., 2007, MNRAS, 377, 352
Parmentier G., Goodwin S. P., Kroupa P., Baumgardt H., 2008, ApJ, 678, 347
Peretto N., Fuller G. A., 2009, A&A, 505, 405 Peretto N., Andr´e P., Belloche A., 2006, A&A, 445, 979 Proszkow E., Adams F. C., 2009, ApJS, 185, 486
Schmeja S., Kumar M. S. N., Ferreira B., 2008, MNRAS, 389, 1209 Smith R., Fellhauer M., Goodwin S., Assmann P., 2011a, MNRAS, 414,
3036
Smith R., Slater R., Fellhauer M., Goodwin S., Assmann P., 2011b, MNRAS, 416, 383
Testi L., Sargent A. I., Olmi L., Onello J. S., 2000, ApJ, 540, L53 Tutukov A. V., 1978, A&A, 70, 57
Verschueren W., David M., 1989, A&A, 219, 105
Walsh A. J., Myers P. C., Burton M. G., 2004, ApJ, 614, 194