Rochester Institute of Technology
RIT Scholar Works
Theses Thesis/Dissertation Collections
9-13-2016
An environmental lifecycle comparison of road
deicers using hybrid modeling techniques to
capture effects during early processing stages
Mary Elizabeth WarnerFollow this and additional works at:http://scholarworks.rit.edu/theses
This Thesis is brought to you for free and open access by the Thesis/Dissertation Collections at RIT Scholar Works. It has been accepted for inclusion in Theses by an authorized administrator of RIT Scholar Works. For more information, please [email protected].
Recommended Citation
An environmental lifecycle comparison of road deicers
using hybrid modeling techniques to capture effects
during early processing stages
by
Mary Elizabeth Warner
A Thesis Submitted in Partial Fulfillment
of the Requirements for the Degree of
Master of Science in Sustainable Engineering
Department of Industrial and Systems Engineering
Kate Gleason College of Engineering
Committee Members
Brian Thorn, Ph.D
Advisor
Professor
Industrial and Systems Engineering Department
Kate Gleason College of Engineering
Rochester Institute of Technology
Scott Grasman, Ph.D
Department Head, Professor
Industrial and Systems Engineering Department
Kate Gleason College of Engineering
Rochester Institute of Technology
Scott Wolcott, P.E
Professor
Civil Engineering Technology, Environmental Management and Safety
College of Applied Science and Technology
Department of Industrial and Systems Engineering
Kate Gleason College of Engineering
Rochester Institute of Technology
Rochester, NY
CERTIFICATE OF APPROVAL
M.S. Degree Thesis
The M.S. Degree thesis of Mary E. Warner
has been examined and approved by the thesis
committee as satisfactory for the thesis
requirements for the Master of Science degree
Approved by:
Brian Thorn, Ph.D.
Scott Grasman, Ph.D.
Table of Contents
Table of Contents ... iv
List of Figures ... vii
List of Tables ... viii
List of Nomenclature ... x
Abstract ... xii
1. Introduction ... 1
1.1 Global Thermohaline Circulation ... 1
1.2 Goldilocks Range: Clausius-Clapeyron Relation ... 2
1.3 Current Weather Patterns ... 3
1.4 Current Snow Removal ... 4
2. Background ... 5
2.1 Current Road Deicers Use ... 5
2.2 Deicer Impacts ... 6
2.2.1 Impacts to Soil ... 7
2.2.2 Impacts to Water ... 7
2.2.3 Impacts to Vegetation ... 8
2.3 Usefulness of Lifecycle Assessment ... 9
3. Methodology ... 11
3.1 Problem Statement ... 11
3.2 LCA Framework ... 12
3.2.1 Scope ... 13
3.2.2 Functional Unit ... 14
3.2.3 Impact Categories ... 15
3.2.4 System Boundaries... 15
3.2.5 Additional Considerations ... 18
3.2.6 Lifecycle Inventory ... 18
3.2.8 Interpretation ... 20
3.3 Post-Application Model ... 20
3.3.1 Measuring Waterway Impacts ... 21
3.3.2 Measuring Soil Structure Impact ... 22
3.3.3 Measuring Human and Aquatic Health Impact ... 23
3.3.4 Environmental Impact Model ... 23
4. Data Collection ... 25
4.1 Libraries and Databases ... 25
4.2 Data Organization ... 26
4.3 Case Study ... 26
4.4 Processes Creation ... 27
5. SimaPro Model ... 27
5.1 NaCl Inputs ... 29
5.1.1 NaCl Material Creation ... 30
5.1.2 NaCl Application ... 39
5.1.3 NaCl Transportation... 42
5.2 CaCl2 Inputs ... 43
5.2.1 CaCl2 Material Creation ... 43
5.2.2 CaCl2 Application ... 44
5.2.3 CaCl2 Transportation ... 46
5.3 CMA Inputs ... 47
5.3.1 CMA Material Creation ... 47
5.3.2 CMA Application... 51
5.3.3 CMA Transportation ... 53
5.4 OBPE Inputs ... 54
5.4.1 OBPE Material Creation ... 55
5.4.2 OBPE Application ... 55
5.4.3 OBPE Transportation ... 59
5.5 Environmental Impact Inputs ... 59
6. Results ... 63
6.2 Post-Application Results ... 70
6.3 Results Overview ... 72
6.4 Sensitivity Analysis ... 73
6.4.1 Flat Rate Deicer Application Effects ... 74
6.4.2 Varied Weight Scales ... 85
6.4.3 Sensitivity Analysis Results Summary ... 89
7. Discussion ... 90
7.1 Results Analysis and Interpretation ... 90
7.2 Quantifying Results ... 93
7.3 Impact of Post-Application Model ... 94
7.4 Relevance of Temperature ... 96
7.5 Considerations Out of Scope ... 97
8. Significance... 98
8.1 Significance of Results ... 99
8.2 Significance of Model ... 100
9. Future Work ... 101
10. Conclusion ... 102
11. References ... 104
12. Appendices ... 113
APPENDIX A: Weather Data ... 114
APPENDIX B: CaCl2 Calculations ... 119
APPENDIX C: Process Contributions ... 121
APPENDIX D: NaCl Process Tree ... 124
APPENDIX E: CaCl2 Process Tree ... 126
List of Figures
Equation 1: August-Roche-Magnus Formula………..3
Equation 2: CMA Chemical Equation……….. 48
Figure 1: Lifecycle Assessment Framework………..12
Figure 2: NaCl System Boundaries………16
Figure 3: CaCl2 System Boundaries………...16
Figure 4: CMA System Boundaries………...17
Figure 5: OBPE System Boundaries………..17
Figure 6: Inputs in SimaPro 8 to Create Dolomitic Lime Process……….49
Figure 7: Total Ecopoints for Each Deicer………66
Figure 8: Relative Percentage of Impact………67
Figure 9: Normalized Results of Climate Change Impacts from SimaPro 8……….68
Figure 10: Normalized Results of Ozone Depletion Contributions from SimaPro 8………69
Figure 11: Post-Application Environmental Impact Scores………..71
Figure 12: Inputs for the Product Stages of Four Deicers for Flat Rate Sensitivity Analysis…...75
Figure 13: Total Ecopoints for Deicers with Flat Rate Quantity Applied……….78
Figure 14: Relative Percentage of Impact from Ecopoints for Flat Rate Quantity of Deicer……79
Figure 15: Normalized Impacts to Climate Change Using Flat Rate Quantity of Deicer……….80
Figure 16: Normalized Impacts to Ozone Depletion Using Flat Rate Quantity of Deicer……...80
Figure 17: Total Environmental Impact Score for Flat Rate Deicer Quantity………...84
Figure 18: Graphical Display of Impacts from Equal Weights in Post-Application Model……..86
Figure 19: Graphical Display of Impacts from 1, 3, 5 Weights in Post-Application Model…….88
List of Tables
Table 1: Cost and use information for common deicers in the U.S………...10
Table 2: NaCl Underground Mine Input Data………...31
Table 3: NaCl Deicer Input………35
Table 4: Inputs to Coal and Uranium for NaCl Deicer………..38
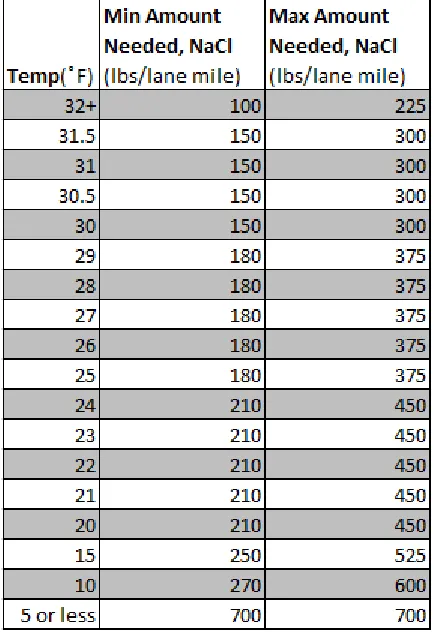
Table 5: Suggested NaCl Application Rates………..40
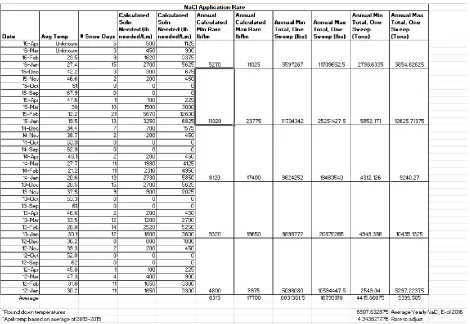
Table 6: Application of NaCl in Rochester………42
Table 7: Application of CaCl2 Deicer in Rochester………...46
Table 8: Material Examples Used from SimaPro 8 to Create Laboratory Process of CMA…….50
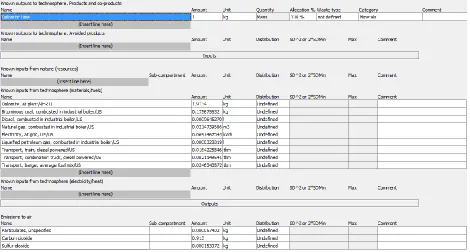
Table 9: Application of CMA in Rochester………...53
Table 10: Ice Melting Capacity of OBPE Deicer Relative to NaCl Deicer………...56
Table 11: Application of OBPE Deicer in Rochester………58
Table 12: Element Quantities Per Deicer………...60
Table 13: Impairment Weighting and Score………..62
Table 14: Total Ecopoint Scores Received………66
Table 15: Relative Total Ecopoints………66
Table 16: Individual Ecopoint Category Data………...67
Table 17: Relative Impacts for Individual Ecopoint Category Data………..67
Table 18: Impact to Climate Change and Ozone Depletion………..69
Table 19: Relative Impact of Climate Change and Ozone Depletion………70
Table 20: Post-Application Environmental Impact Calculations………..70
Table 22: Element Quantities Adjusted for 30,000 Tons of Deicer for All Deicers……….76
Table 23: Total Ecopoint Scores for Flat Rate Quantity of Deicer………78
Table 24: Relative Magnitude of Impact of Flat Rate Quantity of Deicers………...78
Table 25: Data per Ecopoint Category for Flat Rate Quantity of Deicer………..79
Table 26: Relative Impact of Deicer per Ecopoint Category Using Flat Rate Quantity…………79
Table 27: Impacts to Climate Change and Ozone Depletion from Flat Rate Deicer Quantity…..81
Table 28: Relative Impacts to Climate Change and Ozone Depletion from Flat Rate Deicer Quantity………..81
Table 29: Post-Application Calculations for Flat Rate Deicer Quantity………...83
Table 10: Weighting Sensitivity Analysis Using Equal Weights for All Factors………..86
Table 31: Weighting Sensitivity Analysis Using 1, 3, 5 Scale………..87
Table 32: Relative Environmental Impact Scores Compared to Standard Weight of 1…………89
Table 33: Relative Environmental Impact Scores Compared to 1, 3, 5 Weights………..89
List of Nomenclature
' Feet
" Inches
$ US Dollars
ARS American Rock Salt
BOM Bill of Material
Ca Calcium
CaCl2 Calcium Chloride
CaMg2(CH3COO)6 Calcium Magnesium Acetate
CH3CO2K Potassium Acetate
Cl Chloride
CMA Calcium Magnesium Acetate
CO2 Carbon Dioxide
DALY Disability-adjusted life year
DO Dissolved Oxygen
DOT Department of Transportation
EOL End of Life
EPA Environmental Protection Agency
Eq Equivalent
ft Feet
gal Gallons
GHG Greenhouse Gas
HCOONa Sodium Formate
in Inches
ISO International Organization for Standardization
kg Kilograms
kW Kilowatts
kWh Kilowatt-hours
lb Pounds
LCI Lifecycle Inventory
LM Lane-miles
m Meters
m2 Square meters
m2a Square meter-years
m3 Cubic meters
Mg Magnesium
MPtMegapoint
MJ Megajoules
Na Sodium
NaCl Sodium Chloride
NOx Nitrogen Oxides
NOAA National Oceanic and Atmospheric Association
NYC New York City
OBPE Organic Based Performance Enhancer
P Unit
SO2 Sulfur Dioxide
ROC Rochester
SOx Sulfur Oxides
t Tons
TDS Total Dissolved Solids
tkm Tonne-kilometers
US United States
USD U.S. Dollars
Abstract
For decades the United States has relied on application of road deicers for the purpose of winter
road maintenance to provide safe transportation for the majority of U.S. commuters in northern
states. Road deicers are a necessity but are linked to contamination of surrounding environments,
including effects on water systems, vegetation, and soil quality. While sodium chloride is the
most common road deicer, a variety of alternatives have been implemented. Each deicer
alternative has different deicing abilities and a range of environmental impacts that, thus far,
have primarily been compared during their application phase. This research conducts an
environmental lifecycle analysis of four road deicers in order to incorporate the manufacturing,
processing, transportation, and distribution phases along with the effects associated with the
product’s end-of-life application. The four road deicers that are investigated include sodium
chloride, calcium chloride, magnesium chloride acetate, and beet juice molasses (OBPE). They
are evaluated based on a case study performed in Rochester, New York. This case study is used
to represent population densities and environmental composition in regions where this research
would be most applicable. This paper offers a framework to holistically compare environmental
effects of road deicers pre- and post- application.
Keywords
1
1. Introduction
Climate change trends and effects have been widely observed on a global scale, but the ways in
which climate change manifests itself varies regionally. Temperatures have been rising globally,
but within the contiguous United States the land area receiving what is defined as “unusually light snowfall” has remained relatively constant since the mid-1970’s (Kunkel et al., 2013).
Within the past 50 years the United States has, in fact, seen more than twice the number of
extreme snowstorms observed in the preceding 60 years. Of these extreme snowstorms in the
U.S., over one third have been in winter seasons with warmer-than-average temperatures and
approximately 30% have been during winter seasons with lower-than-average precipitation
(Kunkel et al., 2013).
1.1 Global Thermohaline Circulation
It is believed that some regions, both globally and within the United States, may experience
cooler than average temperatures due to slowing of the Global Thermohaline Circulation and the
weakened Gulf Stream (Wursch, 2002). Global Thermohaline Circulation refers to the way in
which ocean water is transported throughout the globe and the “overturning” effect in which
warm water and cool water travel and displace each other. Although there are many components
to determine oceanic movements, the transportation of heat and salinity are the key components
to what define Global Thermohaline Circulation (Tyrell, 2011). When temperatures warm,
average surface water temperature increases and therefore is less dense than the deeper, cooler
waters. In areas where those warm surface waters may begin to cool and sink, an increase of
fresh water has entered the oceans from the melting of ice caps and glaciers; this prevents the
surface waters from sinking. Therefore, the process in which the ocean waters overturn and are
What becomes problematic is that the slower rates of overturned water result in decreased rates
of warmer surface water being brought north. Water that is brought north in this process serves
to replace the colder North Atlantic waters. Because water temperatures are highly correlated
with air temperatures, it is predicted that Western Europe and land masses located in or adjacent
to the North Atlantic region could see cooler temperatures by several degrees dependent on the
rate of slowed Global Thermohaline circulation (Tyrell, 2011). In its current state, the
overturning and circulation has slowed by 15-20% over the twentieth century and therefore may
contribute further to seeing cooler temperatures in some regions despite overall global warming
(Rahmstorf et al., 2015).
1.2 Goldilocks Range: Clausius-Clapeyron Relation
At the same time, many more areas are seeing warmer temperatures as a result of human-induced
climate change. Although it is often assumed that warmer temperatures result in a decrease of
snow, this is not true for many regions, especially within the United States (IPCC, 2007a). The
ideal temperature for snowfall typically lies somewhere in the range of 28°F and 32°F. This
temperature range is colloquially referred to as the “Goldilocks Range,” because temperatures
too high (above 32°F) produce precipitation as rain, but when temperatures are just below
freezing the atmosphere can still hold higher concentrations of moisture and is therefore more
likely to produce snowfall (Lawrence, 2005).
This “Goldilocks” phenomenon is a product of the August-Roche-Magnus formula (in some
cases known as the Magnus Formula) and Clausius-Clapeyron relation. The
August-Roche-Magnus formula (Equation 1) provides the equation indicating that saturation vapor pressure is
dependent on temperature. From this formula can be derived the Clausius-Clapeyron relation,
which uses the relationship between pressure and temperature to determine vapor pressure in the
Equation 1
These equations are important to understanding snowfall patterns because it can be derived that,
with approximately 1°C (1.8°F) increase in temperature, the atmosphere’s water-holding
capacity increases by approximately 5%-7% (IPCC, 2007a; Lawrence, 2005). With many places
seeing average temperatures increasing incrementally, it can be inferred that there is an increased
potential for historically-colder regions to experience greater snowfall in winter months due to
the ability of the atmosphere to hold more water. A decrease in snowfall is seen at the beginning
and end of winter months, when human-induced climate change will result in increased
temperatures that are above freezing when they historically otherwise may not be. We will also
see a decrease in snowfall in regions that are more south, because with increasing temperatures
these warmer regions are even less likely to reach subfreezing points (IPCC, 2007a).
In addition to impacts from northern regions reaching temperatures in the “Goldilocks Range,”
increased snowfall is also found in regions surrounding the Great Lakes due to decreased ice
cover on the lakes. With less ice cover on the Great Lakes (especially Lake Ontario and Lake
Erie), but freezing ambient temperatures in surrounding states, there has been an observable
increase in lake effect snow throughout the 20th century (IPCC, 2007b). While the Great Lakes
are a specific example, there has been less ice cover in open bodies of water in general. It is
believed that this is the cause for regions in the middle-latitudes of the globe to have seen some
unusually snowy or cold winter months throughout recent years (Walsh and Wuebbles, 2014).
The slowing of the Global Thermohaline has caused some northern regions adjacent to the North
Atlantic to experience more severe winter weather conditions. Additionally, other northern
regions throughout the globe are seeing temperatures more ideal for holding water in the
atmosphere. Therefore we have many reasons to believe that fluctuations in snowfall will
continue to impact our daily lives.
Increased rates of urbanization and a continuously growing population mean that, specifically
within the U.S., we are increasingly in demand of efficient snow-removal methods to assure safe
commutes (Morgan, 2014). Within the last two years many major metropolitan areas have been
faced with extreme snowfalls and blizzards, and snow removal has been critical in returning
cities like these to normal operations. Examples include the blizzard, entitled Winter Storm
Jonas, which hit the east coast on January 23, 2016. This blizzard caused 11 states to declare
states of emergency due to the high volumes of snowfall, ranging from 18 to 48 inches of
accumulation throughout the affected areas (Osborne, 2016). In a similar fashion, the winter
storms that hit Boston in January and February of 2015 resulted in breaking the record for the
most snow in a 30-day period as well as the record for 2014-2015 being the snowiest winter
season in history (NOAA, 2016). While these may seem like isolated events, it is important to
note that Boston has seen four of its five snowiest winter seasons within the last 22 years
(NOAA, 2016).
There is now evidence that indicates the Great Lakes and Great Plains regions in the U.S have
seen an increase in total seasonal snowfall, and the Midwest and Northeast have seen heavier
snowfalls in the past 10-20 years (Walsh and Wuebbles, 2014). If we continue to see extreme
winter events occurring, such as these, it only increases the importance of evaluating
snow-removal procedures.
1.4 Current Snow Removal
Deicing of roads has been the primary method for maintaining safe and clear winter roadways
since the early 20th century, but recent research indicates a wide range of environmental effects
deicers has been increasing since the 1950’s, it is important to take a holistic approach to
analyzing long-term environmental impacts of commercially-available road deicers, particularly
in the face of changing climate (Warner and Ayotte, 2014). The efficiencies of deicers will vary
based upon changes in climate, including factors such as how frequently deicer will need to be
applied, the depth and severity of snowfall events, ambient temperatures during snowfall, and
other factors that have changed since the 1950’s even though road salt remains our primary
deicer. In order to make a recommendation on the least environmentally impactful deicer these
factors need to be considered.
2. Background
Although many road deicers have been studied, still many research gaps exist. Providing
comprehensive information on snow removal processes is essential for the purpose of safety,
efficiency, and protection of surrounding environments. In order to evaluate and understand what
research areas have been filled and where the research gaps lie, background information has been
compiled and the literature has been reviewed.
A lifecycle analysis is the suggested method with which to conduct research on road deicers. A
lifecycle analysis provides comprehensive and comparable results on impacts to the environment
by analyzing inputs and impacts during all lifecycle stages. The compiled information in this
section is critical to understanding and creating a thorough lifecycle analysis because lifecycle
analyses require large datasets.
2.1 Current Road Deicers Use
Sodium chloride (NaCl) is the most common road deicer in the United States with application
rates of approximately 15 million tons per year nationwide (USEPA, 2010). Road deicing has
since the 1970’s (Warner and Ayotte, 2014). Highway deicing consumes 43% of the total salt in
use in the U.S. (Kostick, 2010). The northeastern United States is one of the largest consumers of
road salt due to its weather conditions and concentrated populations, with New York State being
the largest consumer of NaCl for winter maintenance throughout the United States. New York,
alone, applies 836,020 tons of untreated NaCl to public roads annually (Lashmet and Thompson,
2012).
Factors such as urbanization have also increased the amount of deicing substances found in the
environment. Urbanization increases the demand for paved roadways and, as a result, also
increases the demand for deicers. An increase of approximately 2.5 to 2.9 times the amount of
deicer is found in surrounding environments after urban development begins (Kelting, Laxson, &
Yerger, 2012). These surrounding environments can be significantly impacted because
approximately 55% of chloride ions from deicers are transported directly to waterways and the
remaining 45% infiltrate soils (Fishel, 2001).
In recent years some states and regions have begun to experiment with using alternative road
deicers to mitigate impacts and demand for NaCl. Common alternatives include, but are not
limited to, CaCl2 (Calcium Chloride), MgCl2 (Magnesium Chloride), CaMg2 (CH3COO)6
(Calcium Magnesium Acetate), CH3CO2K (Potassium Acetate), HCOONa (Sodium Formate),
and byproduct additives (Robidoux and Delisle, 2001; Fu et al., 2012). In most cases, these
alternative deicers are used as a secondary or temporary option and therefore widespread concern
over their environmental impacts has not yet occurred.
2.2 Deicer Impacts
The intention for seeking an alternative deicer is to reduce the environmental impacts from the
application of NaCl. The intended goal is to reduce NaCl impacts to the environment either
through the increased effectiveness of the alternative deicer products or by the reduction of
harmful molecules and ions to the environment. For example, even at very high concentrations,
the acetate deicers are not known to cause osmotic stress and have decreased impacts to soils and
therefore reduce the need for the base substance to which they are being applied (Fu et al., 2012).
There are many known harmful impacts to the environment as a result of NaCl application, yet
high costs and lower availability of alternative deicers have been the primary inhibitors to their
widespread use. The increase in research and concern over deicer use has the potential to impact
these inhibiting factors (USEPA, 2010; Robidoux and Delisle, 2001; Fu et al., 2012).
2.2.1 Impacts to Soil
Deicing has been linked to many negative environmental impacts as a result of runoff and/or
bouncing off the pavement during the application process. Chloride-based deicers, which are
currently the most common deicers in the U.S., have been linked to increasing the infiltration of
heavy metals in soil (Kelting and Laxson, 2010). Initial introduction of heavy metals to the
environment is often from fuels, traveling vehicles, and surrounding road infrastructure. These
metal pollutants remain as one of the greatest concerns to the environment due to their long-term
toxicity (Kelting, Laxson, & Yerger, 2012).
Soils closest to roadways have indicated metal concentrations—including Cd, Cr, Cu, Pb, Ni,
and Zn—up to 30 times greater than the reference point (Mayer, Rochfort, Borgman, &
Snodgrass, 2007). Detected metals are most concentrated within the top five centimeters of soil
(USEPA, 2006). Chloride-based deicers not only permeate the soil themselves, but also risk
contributing to the leaching of these heavy metals to further depths in the soils (Klufe,
Werkenthin, & Wessolek, 2014).
2.2.2 Impacts to Water
Water is also impacted by deicers, with most current research emphasizing the impacts of NaCl
and other chloride-based deicers. Chloride levels can increase up to 66 times in small,
low-flowing waterways within 300 feet of highways that have recently been deiced. These high levels
Road deicing remains one of the primary sources of NaCl to watersheds. Although sewage and
water softeners are often cited as potential contributors, it has been found that these two sources
only account for 4% and 3% of NaCl loads in watersheds, respectively (Kelting, Laxson, &
Yerger, 2012). Agricultural practices have also been linked to runoff to the environment but their
primary contribution to the environment is nitrates (Warner and Ayotte, 2014).
Dilution of accumulated deicer may occur during spring seasons and times in which more
freshwater melt occurs (USEPA, 2006). Although it is rare for ions from road deicers to be
present in water at acute toxicity levels, there is a growing concern for small, freshwater ponds
and streams that may meet the aquatic chronic toxicity level standards. The standards, as set by
the US Environmental Protection Agency (EPA), correlate to 860 mg/L over one hour
(chloride-based) for acute toxicity and 230 mg/L over four days for chronic toxicity (Fishel, 2001).
Continued exposure of a water system to elevated chloride levels can lead to eutrophication,
anoxia, and osmotic stress on ecosystems (Kelting and Laxson, 2010).
Alternative deicers have the potential to impact waterways, but the EPA is currently most
concerned with chloride levels. The EPA has set specific human and aquatic health standards for
chloride. Current deicers and their alternatives have the greatest potential to impact turbidity,
total dissolved solids (TDS) or specific conductance, and dissolved oxygen content. (USGS, n.d.)
2.2.3 Impacts to Vegetation
Impacts of deicers on soil and water quality will also affect surrounding flora and fauna. It is
estimated that 5-10% of trees within 100ft of roadways die as a direct result of chloride exposure
(Fishel, 2001). Concentrations of 70-140 ppm of chloride in water or soil will result in damage to
sensitive roadside flora and concentrations of 140-350 will damage tolerant species (Warner and
Ayotte, 2014; Kelting and Laxson, 2010). This indicates that road deicing may encourage growth
of invasive, more salt tolerant species and reduce biodiversity (Kelting, Laxson, and Yerger,
2012). In addition, it is estimated that as much as 10% of all aquatic species in surrounding
ponds and streams are adversely affected by chronic exposure to chloride toxicity (Gardner and
Impacts to flora and fauna may occur from non-chloride based deicers as well, but these impacts
have not been extensively studied as a direct result of deicing. Input of solids to the environment
has the ability to vary levels of dissolved oxygen (D.O.), change pH, and increase concentrations
of total dissolved solids (T.D.S.), which could impact flora and fauna (Warner and Ayotte,
2014).
2.3 Usefulness of Lifecycle Assessment
Concerns associated with use of alternative deicers include the environmental impacts from
material inputs and manufacturing processes associated with each product. Little quantitative and
comparable research has been done to analyze the environmental impacts associated with
laboratory work, mining, agricultural production, etc. to create alternative deicers. Although
research is extensive with regards to environmental impacts once deicers have been applied to
roadways (application and post-application phase), environmental impacts such as emissions and
resource depletion associated with earlier lifecycle phases of deicers have yet to be
comprehensively explored nor compared alongside application effects.
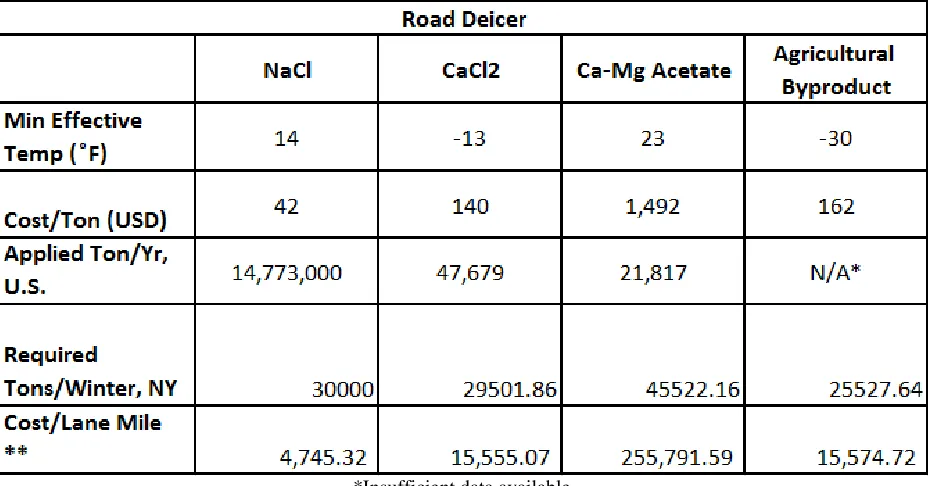
Common road deicers vary in their effectiveness, with each deicer being optimally effective at
different temperatures and under different conditions (Table 1). A lifecycle analysis can
equitably capture the environmental impacts associated with all lifecycle phases by using a
functional unit that reflects the differences in deicer effectiveness. For example, the use of a
functional unit would capture the difference between a deicer that is 100% effective at 20̊ F
Table 1: Cost (USD) and use information for common deicers in the U.S. All information obtained from (Kelting and Laxson, 2010; Shi, Fortune, Smithlin, Akin, & Fay, 2012)
*Insufficient data available
** Cost per lane mile based on average application rates throughout a winter season in NY. Application rates found in Sections 5.1.2, 5.2.2, 5.3.2, and 5.4.2
A lifecycle analysis (LCA) can be performed on a wide range of systems and processes to
compare all phases of a product’s life. For the sake of this research, using lifecycle methodology
would ultimately serve two functions. First, performing an LCA would provide a holistic
environmental impact analysis from cradle-to-grave of deicing products. This serves to assist
planners and developers with making informed deicing and environmental decisions. Secondly,
using a lifecycle methodology to analyze deicers promotes the development of a method in
which lifecycle analyses can be conducted despite two primary phases of the LCA overlapping.
For example, in the case of road deicers, a primary limiting factor to the usefulness of a standard
LCA is the inability to accurately account for the application process because the use phase of
3. Methodology
In order to perform a lifecycle analysis comparing various road deicers, multiple tools must be
used to conduct and organize research. Microsoft Excel will be used as a platform to which data
can be exported and organized and will provide visual graphics and information displays. A
standard lifecycle analysis will be conducted using SimaPro 8 for all pre-application deicer
processes. Results from SimaPro 8 will be exported to Excel, in which the data can be compared
and analyzed alongside the impacts from the post-application phases. Post-application processes
will be determined based upon calculated rates at which deicers enter the environment, and
quantifiable measures of impact. Data from all lifecycle phases will be manipulated in Excel in
order to compare and contrast the potential effects of each deicer.
3.1 Problem Statement
The goal of this study is to account for all lifecycle phases of road deicers by using lifecycle
assessment methodology. Deicers are a necessity in clearing roadways and maintaining
transportation safety in the winter. Because the application of deicers is necessary, it is important
to have a holistic understanding of their impacts to the environment and the ability to make
informed decisions. Due to changing global temperatures and weather patterns, impacts to the
environment from deicer choices are of increasing concern.
Most research on deicing has been done with respect to the impacts on the environment once a
deicer has been applied, but many environmental impacts are associated with the production,
transportation, and earlier processing. As a result, pre-application impacts of deicers cannot be
ignored when making an informed, environmentally-conscious decision. Therefore, unlike
previous research that focuses on environmental effects of deicers once applied to roadways, this
research aims to quantify impacts of deicers at all lifecycle stages. The goal is to create a
methodology based on lifecycle assessment framework in order to compare the environmental
impacts at all stages and determine which road deicer is the least environmentally impactful
deicers to the environment—pre- and post-application—and the secondary purpose of this
research is to serve as a model for similar products in which the use phase and disposal phase of
an LCA overlap.
The research questions can be posed as: (1) which road deicer is least environmentally impactful
throughout its entire lifecycle? and (2) how can we accurately capture the impacts at all stages?
3.2 LCA Framework
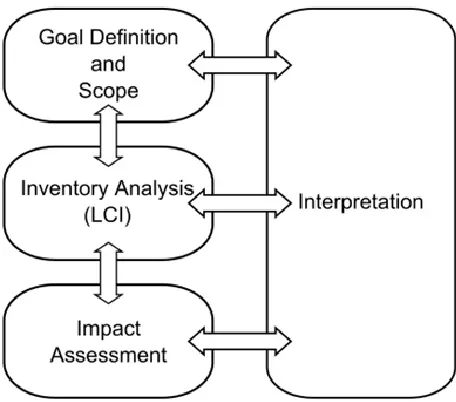
Standard lifecycle analyses are based upon the framework and standards of ISO 14040:2006
“Environmental management - Life cycle assessment - Principles and framework” and ISO 14044:2006 “Environmental management - Life cycle assessment - Requirements and guidelines” which are outlined in Figure 1 (International Organization of Standardization, n.d.).
This framework is used to guide this research and establish system boundaries. The LCA
framework, as outlined by these standards, will be adhered to as closely as possible. This
research, though, will not be referred to as a “Lifecycle assessment” because it does not undergo
the ISO requirement of review by LCA practitioners. Instead, the methodology in this research
will be referred to as a lifecycle analysis. From this point forward an LCA will refer solely to the
[image:25.612.192.420.480.681.2]lifecycle analysis being performed in this paper.
3.2.1 Scope
The first step in performing an LCA is to create a specific goal and scope. This process includes
outlining what will be modeled, defining the functional unit, determining impact categories and
methods, and defining system boundaries and data quality (Baumann and Tillman, 2004).
This analysis will attempt to gather the environmental effects of four primary road deicers using
a cradle-to-grave methodology. The four road deicers that are being studied include sodium
chloride (NaCl), calcium chloride (CaCl2), calcium magnesium acetate (CMA), and an
agricultural byproduct of sugar beets known as an organic-based performance enhancer (OBPE).
These four deicers have been selected based upon their variety in chemical composition and
proven effectiveness.
NaCl was chosen because it represents the most commonly used road deicer in America. CaCl2
was chosen because (1) it is a common secondary choice of road deicer, (2) it will still be
representative of chloride-based deicers, and (3) it is effective at temperatures well below NaCl
(Kelting and Laxson, 2010). CMA was chosen because (1) scientific literature indicates the
potential for decreased environmental impacts from application (Kelting and Laxson, 2010) and
(2) it is representative of a non-chloride based alternative that has had some success (Fishel,
2001). Finally, OBPE is being used in this study to represent the use of agricultural byproducts in
deicing. More specifically we are interested in determining if there is substance to the rhetoric
that a natural, agricultural substitute would offset environmental impacts to road deicing.
All deicers, by definition, are applied once snowfall has begun. This is unlike anti-icing, which is
a preventative application measure that typically consists of a liquid being sprayed on to
pavement. All deicers in this study must be in solid form in order to be effective, including CaCl2
and OBPE; CaCl2 and OBPE most commonly occur in liquid states and can also be used in
anti-icing applications. Therefore, NaCl and CMA will remain in their pure, solid form and CaCl2 and
Although agricultural byproduct additives are currently being tested in many forms, including
but not limited to pickle brine, cheese brine, ethanol, and urea, the basis on which these additives
contribute to the deicing process is the reaction of their natural sugars in combination with the
solid deicer base (Shi, Fortune, Smithlin, Akin, & Fay, 2012). Sugar beet molasses has been
chosen as the agricultural byproduct additive in this study because it is the additive with the most
readily available information.
NaCl will be the assumed base substance to which the additives are applied because it is the least
expensive and most readily available deicer per ton (Kelting and Laxson, 2010). The additives
could be combined with any dry, solid form of deicer, but NaCl is considered the base in this
research because it is the most economically feasible deicer and likely to be used in practice.
3.2.2 Functional Unit
The functional unit will be the amount of deicer necessary to clear roads for one winter season.
This is equivalent to the amount of deicer needed to clear 1,602.1 lane miles, which is the
number of lane miles contained within the City of Rochester (a case study used for the purpose
of this research and discussed further in Section 4.2) (City of Rochester, n.d.). A lane mile (LM)
is the common measurement used for deicing practices within the Department of Transportation
(DOT). This measurement accounts for the number of miles of lanes of road. It is important to
use lane miles because deicing practices are determined based upon clearing each lane of road.
This functional unit was chosen because the primary function of deicing is to provide safe and
effective roadway transportation and this functional unit will preserve the differences in
application quantities (Kelting and Laxson, 2010). More specifically, the functional unit captures
the differences from the application of multiple deicers during various temperatures. Based upon
the guidelines set within each state, a deicing product will be applied at varying quantities over
the course of a winter season. One winter season, though, will have the same number of snow
days and the same daily temperatures for all tested deicers yet will result in different uses and
3.2.3 Impact Categories
The impact categories and methods in the SimaPro 8 model include climate change (kg CO2 eq),
ozone depletion (kg CFC-11 eq), and total environmental impact (Ecopoints). Climate change
and ozone depletion were chosen as impact categories because they are concepts that are well
understood by a wide range of people. The metrics used to calculate impact to climate change
and impact to ozone depletion is discussed more thoroughly in Section 6.1.
Total environmental impact in Ecopoints was chosen because it provides a holistic comparison
of all environmental effects from each product and allows data to be interpreted relatively. From
this point forward, the total environmental impacts measured in terms of Ecopoints, during the
pre-application lifecycle phases, will simply be referred to by its metric (“Ecopoints”). The
purpose for this is to avoid confusion with total environmental impacts measured during the
post-application stage. Further information regarding impact categories and reporting methodology
can be found in Section 4.1.
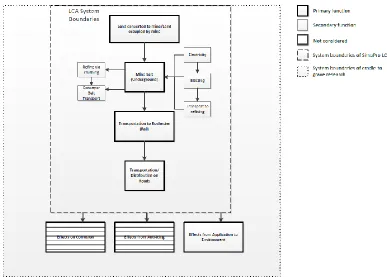
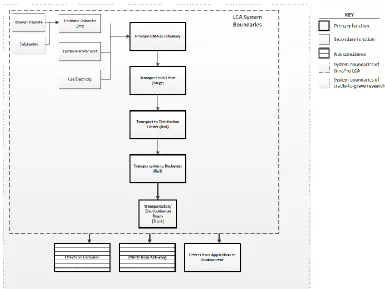
3.2.4 System Boundaries
The system boundaries for the four product deicers are outlined in Figures 2-5. These figures
outline the general boundaries for which this research is contained, including what information is
processed in SimaPro 8 and what information is considered outside the SimaPro 8 model.
Highest available quality of data is used in each analysis. Where specific input information
cannot be determined during the creation of product processes, an aggregate of best available
data in SimaPro 8 unit processes are evaluated. Data collection methodology is discussed further
Figure 2: NaCl System Boundaries
[image:29.612.120.491.388.672.2]Figure 4: CMA System Boundaries
[image:30.612.112.505.391.694.2]3.2.5 Additional Considerations
As noted in Figures 2-5, for the sake of this lifecycle analysis, corrosion and anti-icing effects are
considered to be outside the scope of the study. The effects of corrosion are wide in range and—
while important—would detract from the primary area of interest in this research. Corrosion
inhibitors have also become widely available for use in road infrastructure and vehicles and, in
areas of greater concern, can be easily mitigated (Fishel, 2001). Costs related to and best use
practices associated with corrosion inhibitors could be considered in further research. Anti-icing
is also not considered because, while some regions choose to apply anti-icers, it does not provide
the same function as deicing and is not a requirement for the application of deicers.
Additionally, aesthetic impacts will not be considered. It is assumed that all deicers will have
some aesthetic effects, including but not limited to residue on vehicles and surrounding roadway
infrastructure. Differences in the cleaning and maintenance associated with aesthetic measures
remain negligible, non-quantifiable, and are assumed to be relatively standard regardless of the
deicing substance used (Stripple, 2001).
3.2.6 Lifecycle Inventory
The second stage required in performing a lifecycle analysis is conducting the lifecycle inventory
methodology. The lifecycle inventory (LCI) defines the quantity and type of inputs throughout
the lifecycle of the products and their processes. In order to accurately do this, ISO standards
require a flowchart defining system boundaries and flow of materials and processes (Figures 2-5)
as well as collecting information on all flowchart component inputs and their environmental
outputs per functional unit (Baumann and Tillman, 2004).
To capture data on all inputs to the lifecycle analysis, and their corresponding environmental
These databases are two of the most widely used LCI databases provided by SimaPro 8 and are
used in this research because they have a breadth of comprehensive data on most common
materials and processes. The only LCI data that was not retrieved from EcoInvent or USLCI was
the LCA Food DK database, which was used thrice in constructing the CMA Deicer. LCA Food
DK database was used due to a lack of otherwise available information on acetic acid production.
When possible, U.S. specific materials and processes were chosen. Where not possible, the
European average was chosen.
3.2.7 Impact Assessment
An impact assessment is performed in order to describe the impact of the processes created in
SimaPro 8 and do so in a way in which the information can be easily understood and compared.
Inventory results from the LCI may not be easily comparable because the inventory is often large
in quantity and difficulties can arise in attempting to directly compare the relative impacts of
emissions, environmental depletion, etc. The impact assessment uses overarching categories—
such as climate change, ozone depletion, ecotoxicity, etc—to aggregate inventory results and
make those results easier to understand and easier to compare (Baumann and Tillman, 2004).
Not only does the impact assessment allow for ease of understanding and comparability but it
also reduces the metrics for which we must evaluate the product and processes (Baumann and
Tillman, 2004). The four deicers evaluated in this research had results with inventories ranging
from 725-903 materials and processes, but by conducting an impact assessment by
characterizations these metrics were reduced to 17 categories that encompassed the entire
inventory. These categories can be reduced further to reflect the impact categories selected in
Section 3.1.2. Additionally, impact assessments can be performed in terms of a damage
assessment or one single score, which groups characterization impacts in a way that is easily
comparable. The damage assessments are reported in terms of a percentage of impact and the
single scores are reported in terms of Ecopoints. Single scores provide impacts for Human
As mentioned in Section 3.2.3, the specific impact categories reported in this research include
climate change (kg CO2 eq), ozone depletion (kg CFC-11 eq), and total environmental impact
(EcoPoints).
3.2.8 Interpretation
Interpretation is the most critical aspect of any LCA. The LCI and impact assessment produce
large datasets that require interpretation and analysis in order to extract meaningful conclusions.
SimaPro 8 allows the user to analyze one product or process at a time as well as providing the
ability to compare products. Additionally, SimaPro 8 provides many visual aids including tables,
flowcharts, and graphs that can be manipulated and scaled to a certain degree.
In this research the visual aids created in SimaPro 8 provide the basis for interpretation. Because
SimaPro 8 has a limited ability to manipulate the presentation and formatting of the visual aids,
all data and visuals are imported to Microsoft Excel. The benefits in using Microsoft Excel is
that it (1) allows for direct access to and use of the raw data and (2) allows for control over all
visual aids and the way in which they are presented such that important information is easily
conveyed.
3.3 Post-Application Model
It is commonly understood that in a product’s lifecycle there are five main stages: (1)
premanufacture, (2) product manufacture, (3) product delivery, (4) product use, and (5)
refurbishment, recycling, disposal (Graedel, 1999). In the case of deicers, the product use phase
overlaps with the refurbishment, recycling, and disposal phase. Therefore, for the purpose of this
research, lifecycle analysis methodology is used to determine impacts of the four common road
deicers prior to their application and a second environmental impact model is created to
determine the impact of the deicers once they have been applied. Both these results are in
As detailed in Section 3.2, this analysis will use SimaPro 8 software to model the
premanufacture, product manufacture, and product delivery phases of the deicers’ lifecycle,
which include but are not limited to the effects of raw material acquisition, manufacturing and
processing, transportation, and distribution of each deicer.
Some models have attempted to capture impacts of deicers to the environment during and after
application by using SimaPro 8. These models created disposal phases that dispose of all deicers
to water, which then undergoes wastewater treatment. This is an overly simplified method that
fails to capture the full impacts to waterways as well as the ways in which soil structure and the
other surrounding environment is impacted. These methods are also not able to account for the
fluctuating rates at which deicers reach waterways, particularly in a way that aligns with the
lifecycle assessment framework (Fitch, Smith, & Clarens, 2013).
Therefore, due to the limitations of SimaPro 8 to effectively capture environmental impacts of
deicer accumulation during the use and disposal phases of deicer application, the
post-application effects of each deicer are modeled using a relative weighting scale and five
impairment categories. These five impairment categories are discussed in Sections 3.3.1 through
3.3.4.
3.3.1 Measuring Waterway Impacts
An increase of deicing compounds has not been linked to large bodies of water due to the rapid
rate of dilution. Effects of road deicers to water primarily impact small freshwater ponds and
low-flowing streams. Water downstream and within 100 feet of the roadways is the water that
most often has detectable concentrations of road deicers (Fishel, 2001). Although continuous
long-term application rates have the potential to infiltrate groundwater supplies, the primary
concern of deicers is to surface water (Warner and Ayotte, 2014; Fishel, 2001).
The risk of greatest concern to surface waters from deicers is decreased dissolved oxygen content
either in the form of eutrophic conditions or increased salinity levels (Warner and Ayotte, 2015;
oxygen (D.O) content of a body of water is critical for the survival of plants, animals, and other
living organisms that rely on the oxygen content of their habitat for survival. An input of organic
matter or imbalance of molecules is linked to decreased dissolved oxygen content, which in turn
causes eutrophic conditions. Low D.O. levels impact the quality of water, the biodiversity, and
overall habitat (USGS, n.d.).
A secondary concern of water quality is the total dissolved solids (TDS) content. TDS is a
measure of the organic or inorganic substances found in a freshwater system and, while TDS
does not inherently imply poor or toxic water quality, it is an indicator of impurities. Deicers can
contribute to the TDS of waterways, which would potentially impact habitat quality or, in the
case of wells, drinkability (Warner and Ayotte, 2014).
3.3.2 Measuring Soil Structure Impact
The primary risk of deicers to soil includes transport of heavy metals and, at high concentrations,
potential fluctuations in pH (Kelting and Laxson, 2010; Klufe, Werkenthin, & Wessolek, 2014).
This, in turn, impacts permeability of soil and survival of plants and bacteria that depend upon
the soil. Heavy metal leaching is considered the greatest impact to soil because the effects can be
long-term and severe.
The highest concentrations of road deicers in soil are found within 10 feet of roadways but some
studies found traces of high concentrations up to 100 feet from roadways (Warner and Ayotte,
2014). Although deicers have the ability to impact pH, these concentrations would have to be
very high and persist over a relatively long period of time to have any impact. Because deicers in
soil are able to be quickly diluted, impacts to pH will not be considered as part of the analysis for
3.3.3 Measuring Human and Aquatic Health Impact
Human and aquatic health are considered separately from the measures outlined in Sections 3.3.1
and 3.3.2. While deicers have the ability to impact soil and water, these impacts may decrease
environmental quality but do not necessarily pose as an immediate health risk. While the impacts
of deicers to soil and water has the ability to impact human and aquatic health, because not all
risks are created equal. The EPA has established detection limits for elements whose
concentrations pose greatest risk to either human or aquatic health. For example the EPA has set
detection limits for chloride but not for magnesium because it is either not prevalent enough in
the environment at levels that would pose a significant risk, or because those levels would need
to be extremely high to warrant concern. For the sake of this research, if an EPA detection limit
is set for a deicer element then that element will be considered correlated with impacting human
and/or aquatic health. The purpose of considering these impacts separately from the other
measures is to provide a proper impact adjustment for elements that are of greatest concern.
3.3.4 Environmental Impact Model
In order to capture the impact of deicers to the environment, a newly proposed model has been
created that allows for easy comparison between results from deicers post-application with
results from SimaPro 8 prior to application. More specifically, I am proposing this as a method
and exploring this modeling method using Rochester and deicers as a case study. This model is
being developed as a way in which to capture impacts from all lifecycle stages when the use and
disposal lifecycle stages overlap. Deicers are the product of concern in this research although
other products may face this issue as well, such as lawn maintenance products (fertilizers, pest
control, etc.) and hygiene products (soaps, shampoos, etc.). This is the first attempt at using this
model, but it has the potential to be developed and customized further for other similar products
This model uses the number of elements added to the environment from each deicer to determine
impact each deicers impact. The inputs and results are based upon the annual quantity of deicer
applied, the molar weight of each element, and the molecular composition.
Five impairment factors will be considered and weighted in this specific model: D.O., TDS,
Heavy Metal Leaching, Human Health, and Aquatic Health. These impairment factors were
chosen for this research based upon known primary impacts of deicers to surrounding
environments from application and elaborated upon in Sections 2.2.1 through 2.2.3 (Kelting,
Laxson, &Yerger, 2012; Kelting and Laxson, 2010). These impairment factors are quantifiable
metrics that reflect impact deicers have to soils, waterways, and vegetation. Other impairment
factors can be selected for different products at the discretion of the researcher.
Each impairment factor is then provided a weight based upon the severity of impacts that arise
from that factor. For example, impacts to human health will be considered of greater concern in
this research, and will therefore have a greater weight, than potential changes in TDS. Weighting
is based upon a review of the literature and these weights reflect relative impacts of each
impairment factor as compared to one another. While there is some discretion required in the
weighting process, each assigned weight should have an associated substantive rationale and, if
repeated, should provide similar results.
Once weights have been assigned to each impairment factor, an element from a deicer will be
marked as either “yes” or “no” to having direct associated changes to one of the five impairment
factors. All weights from impairment factors that received a “yes” are added and then multiplied
by the quantity at which that element is being added to the environment from its deicer. This is
repeated for all elements that comprise a deicer. The final sum of all the quantities of weighted
elements is classified as the Environmental Impact Score—a term used and developed for this
research—that can be compared with the results from other deicers.
Each deicer will receive an Environmental Impact Score. These scores will be plotted graphically
to best show which deicer has the greatest impact to the environment once it has been applied.
subjective, the Environmental Impact Scores must be considered relative scores that cannot be
directly compared to other metrics from SimaPro 8. Instead, the relative results from SimaPro 8
and the results from the post-application Environmental Impact Model will be compared and
analyzed and, based upon these results, a conclusion and recommendation can be drawn. The
ability of this model to assist with lifecycle analyses of non-deicing products is discussed in
Section 7.
4. Data Collection
The data interpretation and analysis of results from this research will be based on a case study in
Rochester, New York in order to use specific data and create more accurate results. The data will
be interpreted based on the results from SimaPro 8 and the post-application Environmental
Impact Model. These results are compiled in Excel and a sensitivity analyses will be performed.
4.1 Libraries and Databases
This analysis is performed using SimaPro 8 software and based on the ISO 14040 and ISO 14044
standards as a guide. In order to capture the effects from all processes and materials, EcoInvent
unit processes and USLCI libraries are primarily used. These two libraries provide a
comprehensive index of necessary information to build processes and systems for the purpose of
this study. The following materials and processes will be evaluated in SimaPro 8: mining,
harvesting, laboratory/industrial work, displaced land, transportation, distribution, special
equipment, chemical use, and the emissions, resource consumption, and energy usage associated
with each.
To accurately measure all outputs ReCiPe Endpoint Hierarchical methodology – also referred to
as ReCiPe Endpoint (H)—is used. ReCiPe is the primary methodology for evaluating LCAs
chosen as the specific method type because it is the consensus model perspective, as opposed to
using an Individualist or Egalitarian perspective, which are less commonly used in scientific
research. (Ministerie Van Volkshuisvesting, 2013)
4.2 Data Organization
As discussed in Section 3.2.3, the impact categories used to capture the environmental effects of
deicers prior to their application include climate change (kg CO2 eq), ozone depletion (kg
CFC-11 eq), and Ecopoints. These categories were selected because they will best represent the
impacts of each deicer so that they are most easily understood by the greatest number of people.
Ecopoints will be primary measure in which the comprehensive and collective impacts from
deicers can easily be compared. Ecopoints is a numeric measure that indicates total
environmental impact with relation to materials, products, processes, or services (Edge
Environment, n.d.). Ecopoints provide a quantification of all environmental impacts and
therefore simplify comparisons between the deicers for each impact category. All environmental
impact data from these impact categories will be extracted from SimaPro 8 and imported to
Microsoft Excel in order to organize and present the information.
All data created for each deicer in SimaPro 8 will be organized in Microsoft Excel along with the
post-application impacts. Data will be characterized by impact category and displayed
graphically. Raw data will also be used to format charts and graphs that show comparative
impacts of each deicer at different phases. A sensitivity analysis will be performed and results
will be displayed similarly for easy comparison.
4.3 Case Study
In order to quantitatively capture the effects of deicers on the environment, Rochester, NY was
selected as a case study because its population is reflective of that of a medium sized city (US
Census Bureau, 2013). In addition, Rochester is located in the northeastern part of the United
States, which is the region that has continuously high potential to be affected by snow and cold
global average increased temperature, regional effects have varied widely. The Northeastern
United States has experienced dramatic fluctuations in winter weather such as decreased average
temperatures and increased snowfall (Kunkel et al., 2013). Therefore, Rochester would serve as
an indicator for the locations most likely to be using road deicers. Finally, Rochester has a wide
variety of ecosystems and species and could therefore accurately represent the holistic effects of
deicers.
4.4 Processes Creation
Each deicer process was created in SimaPro 8 using the best available information. The NY State
Department of Transportation Highway Maintenance Guidelines was used as the initial basis for
determining application rates and solution concentrations (Highway Maintenance Guidelines,
2006). When information was not available from the NY State Department of Transportation
Highway Maintenance Guidelines, the preferred secondary source was an alternative Department
of Transportation resource. In some cases specific product guidelines were used.
5. SimaPro Model
The four deicer products chosen for this research include NaCl, CaCl2, CMA, and OBPE. The
City of Rochester contains roadways distinguished as highways and municipal
roads/expressways. For the purpose of this research all roads are presumed to operate under
regular service as defined by the New York State Department of Transportation (Highway
Maintenance Guidelines, 2006). By this definition the maximum allowable accumulation of
snow would be 2.0 inches. As a result, to prevent snow accumulation, all detectable traces of
snow would begin to be serviced immediately and are considered in this research. In addition, at
current standards, when snow is falling at more than 1 inch per hour, deicing is delayed until the
once or twice per year (Highway Maintenance Guidelines, 2006). For the purpose of this
research it will be assumed that all snowfall is serviceable. This is assumed in part because the
occurrence of an unserviceable snowstorm is rare and in other part because, in its current state,
NaCl is the primary deicer and this research is attempting to determine if an alternative deicer
may be more efficient.
Trucks that carry the deicer travel from the storage facility throughout the roads of Rochester to
distribute the product. The number of trucks will not vary with the variations of deicer because
the truck holding capacity is designed to carry more than the amount of NaCl necessary.
Temperature and snowfall data were collected for Rochester from 2012-2016. This data will be
used to determine application rates and quantities needed. The application rate will be what
varies for each deicer (Highway Maintenance Guidelines, 2006).
Each deicer truck is considered to be a standard truck with a spinner and spray chute attached to
the rear to distribute deicer product. After every heavy snow storm the trucks run through a
checklist of cleaning and maintenance practices and a more thorough cleaning and maintenance
at the beginning and end of each winter season. It is assumed that the yearly maintenance of the
trucks and the truck design will be the same for all products because all products in this research
are in solid form and relatively similar in size.
For the purpose of this research we will be using air temperature and snow fall to determine the
amount of deicer to be applied. While the temperature of pavement can be higher than air
temperature during mid-morning and onward, the temperature of pavement is also considered to
be lower than the air temperature from evening through morning (Highway Maintenance
Guidelines, 2006). Therefore, it is assumed that those differences will balance and an average
can be taken.
The rate of application is based upon a standard dilution potential and best and worst case
scenarios are created. The best case scenario assumes ice has not yet bonded to pavement and the
worst case scenario assumes ice has already bonded to pavement. Most application rates were
Guidelines (Highway Maintenance Guidelines, 2006) and the National Cooperative Highway
Research Program Snow and Ice Control Guidelines (Blackburn, Bauer, Amsler, Boselly, &
McElroy, 2004). For all municipal roads and expressways that have one lane going in one
direction, deicer is applied to the middle third of the lane. For all highways in which there is
more than one lane traveling in the same direction, all lanes have deicer applied to the middle
(Highway Maintenance Guidelines, 2006).
Application rates are reported in amounts of deicer per lane mile because there will be
significantly more lane miles than there are miles of road. For all highways and expressways,
deicing trucks are assumed to travel at a rate of 35 miles per hour and for all municipal roads
deicing trucks are assumed to travel at 15 miles per hour (Highway Maintenance Guidelines,
2006).
5.1 NaCl Inputs
NaCl is assumed to be obtained from American Rock Salt Company located 42 miles (67.59 km)
south of Rochester (American Rock Salt, 2016). At American Salt Rock Company, the salt is
derived via a mining process on site. The salt can be found in a halite deposit from the dolostone
and limestone deposits south of Rochester and approximately 0.50 miles beneath surface level
(USGS, n.d.b). This mine was chosen because it is nearest and has the capacity to provide
Rochester with its salting needs; American Rock Salt is the largest operating salt mine in the
U.S. and produces between 10,000 and 18,000 tons of salt each day from the mining process
(American Rock Salt, 2016). This is a room-and-pillar mine.
The salt is excavated through a blasting process. Holes are drilled in to walls of a room and these
holes are filled with an explosive, typically a mixture of ammonium nitrate and diesel fuel, and
then detonated. (American Rock Salt, 2016)
Once a wall or area has been blasted a loader truck brings the raw salt materials to a conveyor
where the salt is carried through a crushing and screen process to bring the mined salt to a more
stored in large mills or in grain elevators ready to be picked up in bulk and delivered to the City
of Rochester via freight train.
In the City of Rochester, all deicers are brought to covered “salt barns” where it they stored for
distribution. These are standard, covered barns located upon cement to prevent leaching in to the
environment (Highway Maintenance Guidelines, 2006). Upon a snow event trucks are loaded up
and dispersed to various areas of the city to apply the untreated NaCl to the roads.
5.1.1 NaCl Material Creation
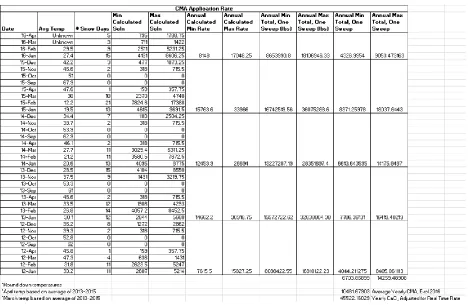
NaCl was modeled based on the system boundaries outlined in Figure 2. SimaPro8 had Salt
(NaCl) as a raw material in its database but the raw material did not capture the mining and
extraction processes. “Sodium Chloride, at plant” was also available but this sodium chloride
was obtained using solution mining, whereas American Rock Salt uses room