White Rose Research Online
eprints@whiterose.ac.uk
Universities of Leeds, Sheffield and York
http://eprints.whiterose.ac.uk/
This is the published version of an article in
Tellus, Series B: Chemical and
Physical Meteorology, 63 (4)
White Rose Research Online URL for this paper:
http://eprints.whiterose.ac.uk/id/eprint/76603
Published article:
Knippertz, P, Tesche, M, Heinold, B, Kandler, K, Toledano, C and Esselborn, M
(2011)
Dust mobilization and aerosol transport from West Africa to Cape Verde-a
meteorological overview of SAMUM-2.
Tellus, Series B: Chemical and Physical
Meteorology, 63 (4). 430 - 447. ISSN 0280-6509
Tellus (2011), 63B, 430–447 C 2011 The Authors
Tellus BC2011 John Wiley & Sons A/S
Printed in Singapore. All rights reserved
T E L L U S
Dust mobilization and aerosol transport from West
Africa to Cape Verde—a meteorological overview
of SAMUM-2
ByP E T E R K N IP P E RT Z1∗, M AT T H IA S T E S C H E2, B E R N D H E IN O L D1, K O N R A D K A N D L E R3,
C A R L O S T O L E D A N O4and M IC H A E L E S S E L B O R N5, 1School of Earth & Environment, University of
Leeds, Leeds, United Kingdom;2Leibniz Institute for Tropospheric Research, Leipzig, Germany;3Institute for Applied
Geosciences, Technical University Darmstadt, Darmstadt, Germany;4Group of Atmospheric Optics, Valladolid
University, Valladolid, Spain;5European Southern Observatory, Garching, Germany
(Manuscript received 26 October 2010; in final form 3 May 2011)
A B S T R A C T
The second field campaign of the SAharan Mineral dUst experiMent (SAMUM-2) was performed between 15 January and 14 February 2008 at the airport of Praia, Cape Verde, and provided valuable information to study the westward transport of Saharan dust and the mixing with biomass-burning smoke and sea-salt aerosol. Here lidar, meteorological, and particle measurements at Praia, together with operational analyses, trajectories, and satellite and synoptic station data are used to give an overview of the meteorological conditions and to place other SAMUM-2 measurements into a large-scale context. It is demonstrated that wintertime dust conditions at Cape Verde are closely related to the movement and intensification of mid-latitude high-pressure systems and the associated pressure gradients at their southern flanks. These cause dust emission over Mauritania, Mali, and Niger, and subsequent westward transport to Cape Verde within about 1–5 d. Dust emissions often peak around midday, suggesting a relation to daytime mixing of momentum from nocturnal low-level jets to the surface. The dust layer over Cape Verde is usually restricted to the lowest 1.5 km of the atmosphere. During periods with near-surface wind speeds about 5.5 m s−1, a maritime aerosol layer develops which
often mixes with dust from above. On most days, the middle levels up to about 5 km additionally contain smoke that can be traced back to sources in southern West Africa. Above this layer, clean air masses are transported to Cape Verde with the westerly flow at the southern side of the subtropical jet. The penetration of extra-tropical disturbances to low latitudes can bring troposphere-deep westerly flow and unusually clean conditions to the region.
1. Introduction
The Saharan desert is the world’s most important source of min-eral dust aerosol (Goudie and Middleton, 2001). Once lifted by strong winds, northern African dust can be transported over thousands of kilometres (McKendry et al., 2007; Liu et al., 2008; Huang et al., 2010). Large amounts are transported to the east-ern tropical Atlantic and beyond (Prospero and Carlson, 1972; Prospero and Carlson, 1980; Morales, 1986; Chiapello et al., 1995). Saharan dust is the major nutrient for the Amazon rain forest (Swap et al., 1992). Deposited into the ocean, mineral dust serves as a fertilizer and thereby impacts on biogeochemical processes (Cropp et al., 2005; Mahowald et al., 2005). Airborne dust particles influence the Earth’s radiative budget (Carlson and
∗Corresponding author. e-mail: p.knippertz@leeds.ac.uk DOI: 10.1111/j.1600-0889.2011.00544.x
Caverly, 1977; Haywood et al., 2003; Tanr´e et al., 2003; Slingo et al., 2006; Heinold et al., 2009) and atmospheric stability (Prospero and Carlson, 1980). They also affect cloud micro-physics and precipitation (Rosenfeld et al., 2001; DeMott et al., 2003; Ansmann et al., 2008; Ansmann et al., 2009b) and are suspected to interfere with Hurricane formation in the Atlantic (Evan et al., 2006a; Wu, 2007).
anticyclonic conditions over northern Africa (Kalu, 1979). These are related to cold air intrusions from mid-latitudes and are some-times enhanced by evaporational cooling (Knippertz and Fink, 2006). The resulting intensification of the Harmattan winds, the dry northeasterlies that dominate over most of the Sahara and Sahel during this time of year, causes localized emissions from preferential sources (Washington and Todd, 2005) and in strong cases long, fast moving dust fronts (Knippertz and Fink, 2006; Slingo et al., 2006). Previous work has shown that near-surface winds over the desert (and thus dust emissions) show a strong diurnal cycle related to a mixing of momentum from nocturnal low-level jets (LLJs) to the surface during the daytime build-up of the planetary boundary layer (Knippertz, 2008; Todd et al., 2008; Schepanski et al., 2009). As the strength of the subtrop-ical anticyclone over the eastern Atlantic/Northern Africa af-fects both emission and westward transport of dust, a positive correlation with the North Atlantic Oscillation has been found in observational and modelling studies (Moulin et al., 1997; Mahowald et al., 2003; Ginoux et al., 2004; Chiapello et al., 2005; Evan et al., 2006b).
During winter dust layers are often topped by or mixed with aerosol from regions of strong biomass-burning activity in south-ern West Africa, which is mainly caused by agricultural practice (Barbosa et al., 1999). Fire emissions originating from West African savannas during the peak winter dry season were ex-tensively investigated during the African Monsoon Multidisci-plinary Analysis (AMMA) campaign in January to February 2006 (Haywood et al., 2008). Particles are frequently trans-ported southwards with the Harmattan winds causing a persis-tent smoke load over the Gulf of Guinea and adjacent land (Pelon et al., 2008). Deep convection was found to play an important role for vertical mixing rather than the buoyancy effect of the fire plumes itself (Johnson et al., 2008). To the north of about 10◦N, mid-tropospheric southerlies can advect biomass-burning aerosol northward and cause it to glide over the relatively cooler and drier desert air.
The first field campaign of the SAharan Mineral dUst experi-Ment (SAMUM-1) was conducted in southern Morocco in May and June of 2006. An overview of this column closure experi-ment for mineral dust near the source regions in northern Africa is given by Heintzenberg (2009). The meteorological conditions causing the emission of mineral dust and its advection to the measurement sites of SAMUM-1 are described by Knippertz et al. (2009). The observational data collected during the second field campaign (SAMUM-2, Ansmann et al., 2011) on the Cape Verde Islands in January and February 2008 provide an unique opportunity to study the transport paths and vertical structure of aerosol layers to the west of the African continent. Furthermore, the data set can be used to investigate possible aging effects of mineral dust particles during long-range transport which can in-fluence their shape, hygroscopic behaviour, radiative effect, and properties as ice nuclei (Wurzler et al., 2000; Bauer et al., 2007; M¨ohler et al., 2008).
This paper provides an overview of the meteorological con-ditions and the air masses that prevailed during the SAMUM-2 measurements at Cape Verde. The synoptic evolution leading from dust activation over aerosol transport to the observed con-ditions at the measurement site will be discussed. Section 2 gives a brief overview of the data used in this study. In Sec-tion 3 observed aerosol stratificaSec-tions and concentraSec-tions over the measurement site are discussed. Section 4 describes the me-teorological conditions encountered over West Africa during SAMUM-2 focusing on the activation of Saharan dust from northern Africa and its westward transport. Finally, Section 5 shortly addresses other observed aerosol species such as sea salt and biomass-burning smoke. A summary and conclusions are provided in Section 6.
2. Data
The meteorological overview of SAMUM-2 is largely based on measurements taken at the airport of Praia (15.0◦N, 23.5◦W, 75 m above sea level) on the island of Santiago, Cape Verde. A detailed overview of the activities during SAMUM-2 is given by Ansmann et al. (2011). This section gives only a coarse overview of these measurements. Regular SYNOP reports of western African stations and operational analyses from the Eu-ropean Centre for Medium-Range Weather Forecasts (ECMWF) are then used to place these observations in the context of the large-scale circulation over northern Africa.
2.1 SAMUM-2 observations
issue (Kandler et al., 2011; Tesche et al., 2011a; Toledano et al., 2011).
2.2 Other data and analysis tools
The large-scale circulation over northern Africa is analysed with the help of operational ECMWF analyses in a horizontal resolu-tion of 0.5◦×0.5◦available every 6 h. To identify the origin of air masses reaching Cape Verde trajectories were calculated on the basis of ECMWF 3-D wind fields using the Lagrangian Anal-ysis Tool (LAGRANTO; Wernli and Davies, 1997). Standard synoptic station reports (SYNOPs) from several West African countries (see Table 1 for details) distributed by the World Me-teorological Organization (WMO) were also used.
In addition, a new dust product based on three infrared chan-nels of the Spinning Enhanced Visible and Infrared Imager (SEVIRI) flying on the geostationary Meteosat Second Gen-eration satellites is used. These images are composited us-ing brightness temperature differences 10.8 µm minus 12.0
µm for red, 10.8 µm minus 8.7 µm for green and absolute brightness temperature at 10.8µm for blue (for more details see http://oiswww.eumetsat.org/WEBOPS/msg_interpretation/ atmospheric_constituents.php). Although this product only pro-vides a qualitative estimate of dust loading, the high temporal resolution of 15 min allows for a detailed analysis of dust emis-sion and transport (Schepanski et al., 2007). It is particularly suited to detect freshly emitted dust due to the sensitivity of infrared channels to the existence of a coarse mode (Sokolik et al., 1998). The red colour in these images is closely related to dust particle size, while the blue colour is more sensitive to dust optical thickness (Li et al., 2007), causing dust plumes to appear magenta. Optically thick, high clouds appear dark red in these images (see Figs. 7c and d for an example).
3. Time evolution of aerosol layering
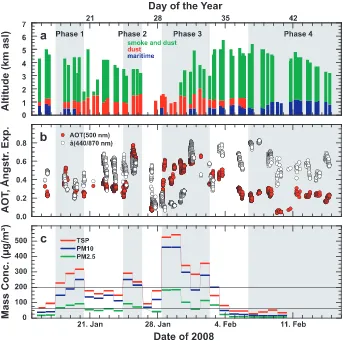
Figure 1 gives an overview of the SAMUM-2 measurement pe-riod in terms of the vertical extent of aerosol layers (upper panel), the 500-nm aerosol optical thickness (AOT) and 440/870-nm Ångstr¨om exponents (middle panel) as well as mass concentra-tions measured at ground level (lower panel). A detailed discus-sion of the Sun photometer measurements during SAMUM-2 is provided by Toledano et al. (2011). The measurements of particle mass concentrations are presented by Kandler et al. (2011). The respective papers also discuss the uncertainty of the measurements.
The Ångstr¨om exponent is calculated from Sun photome-ter measurements of AOT at different wavelengths. It de-scribes the spectral slope and gives information about particle size. Ångstr¨om exponents>1 denote very small particles (e.g. biomass-burning smoke) while large particles (e.g. mineral dust or sea salt) show only weak or no wavelength dependence of extinction and thus Ångstr¨om exponents around zero.
Time-height displays of the linear depolarization ratio (Sassen and Weitkamp, 2005) at 710 nm wavelength measured with the Backscatter Extinction lidar-Ratio Temperature Humidity pro-filing Apparatus (BERTHA) of the Leibniz Institute for Tropo-spheric Research (Tesche et al., 2009a; Tesche et al., 2011a) are used for the classification of maritime aerosol, mineral dust, and the mixture of dust and smoke in Fig. 1a. The lin-ear depolarization ratio contains information about the shape of the scattering particles. It is low in case of maritime aerosol and biomass-burning smoke because these particles are almost spherical and cause no alteration of the state of polarization of the emitted laser light. Non-spherical mineral dust particles on the other hand are highly depolarizing (Freudenthaler et al., 2009) and can therefore easily be discriminated. This way layers of sea-salt aerosol of the maritime boundary layer (depolariza-tion close to zero), pure and highly depolarizing mineral dust (above the maritime boundary layer), and a mixture of mineral dust from northern Africa and biomass-burning aerosol from southern West Africa in elevated layers can be distinguished. Figure 2 shows time-height displays for four selected periods to illustrate this discrimination. Due to the incomplete overlap of the laser beam with the lidar receiver field-of-view, mea-surements below a height of 400 m are not trustworthy and are therefore not shown. A discussion of the aerosol in the lower boundary layer during SAMUM-2 is given by Groß et al. (2011b).
Table 1. List of synoptic stations used in this paper
Name Country WMO–No. Lat. (◦N) Lon. (◦E) Elevation (m)
Fig 1. Aerosol evolution during the SAMUM-2 campaign. Time series of (a) the vertical extent of the observed aerosol layers as (subjectively) inferred from BERTHA measurements of the 710-nm depolarization ratio, (b) aerosol optical thickness at 500 nm and Ångstr¨om exponents for the wavelengths pair 440/870 nm, and (c) mass concentrations of PM2.5, PM10 and TSP derived from in situ particle sampling. All data were measured at Praia airport between 15 January and 14 February 2008. No measurements of particle mass concentration were performed after 10 February 2008. The grey-shaded areas denote periods of high surface dust concentrations (Dust Phases 1–3) and of the absence of layers of pure dust over Praia (Phase 4). The meteorological backgrounds of these periods are discussed in Section 4.
4-km-deep mixed layer of dust and smoke, which shows some internal layering.
With this classification, five different aerosol stratifica-tions can be distinguished during SAMUM-2 (Fig. 1a): (1) maritime+dust+smoke/dust (as in Fig. 2a) on 10 d; (2) dust+smoke/dust (as in Fig. 2b) on 10 d; (3) pure dust (as in Fig. 2c) on 27-29 January 2008 (see also the low Ångstr¨om exponents in Fig. 1b); (4) maritime+smoke/dust (as in Fig. 2d) on 8 d and (5) purely maritime on 9 February 2008 reflected in relatively low Ångstr¨om exponents due to large sea-salt parti-cles (Fig. 1b). The latter is the only day when no spectral de-pendence of the single-scattering albedo was observed (M¨uller et al., 2011). On all days with no maritime layer, high dust volume fractions of up to 99% were observed at the surface (Schladitz et al., 2011). The measurements also indicate that layers of pure biomass-burning smoke did not occur during the campaign.
Based on these observations, four phases of interest were distinguished (see grey shading in Fig. 1) and will be discussed in detail in the following section: (1) 17–20 January 2008 (Dust Phase 1), 24–26 January 2008 (Dust Phase 2), 28 January–2 February 2008 (Dust Phase 3) and 6–15 February 2008 (No Pure Dust). The three Dust Phases show values of TSP>200µg m−3
(marked in Fig. 1c). The Period of No Pure Dust is characterized by low AOT, high Ångstr¨om exponents, low surface aerosol concentrations (TSP<60µg m−3; marked in Fig. 1c), and no
pure-dust signal in the lidar depolarization ratio (Fig. 1a). During this phase, dust only occurred in the elevated mixed dust/smoke layer.
[image:6.595.116.459.77.418.2]Fig 2. Illustration of the identification of aerosol layers based on 710–nm linear depolarization ratio measurements with BERTHA at Praia airport (see Fig. 1a). Shown are time–height displays on (a) 19 January 2008, (b) 25 January 2008, (c) 28 January 2008 and (d) 8 February 2008. Low depolarization ratios (violet to dark blue colours) represent spherical scatterers like maritime particles. Green represents pure Saharan dust. Intermediate colours represent mixtures of smoke and dust. White lines denote the top of the maritime, dust, or mixed dust/smoke layer, respectively.
at Praia for a larger area. Shown are three cross-sections of the 532-nm backscatter ratio measured with the HSRL aboard the Falcon aircraft during dedicated flights. This quantity is the ratio of total (particles and molecules) to pure molecular backscatter. Thus, values close to unity represent a particle-free atmosphere while higher values denote an increasing aerosol load.
4. Discussion of the four phases
This section aims to give an overview of the meteorological conditions during the four main phases identified in the previous section. The main parameters used are fields of mean sea-level pressure to characterize the low-level circulation, trajectories to analyse air mass origins and transport paths, and satellite imagery and station reports to identify potential dust sources and relevant emission events.
4.1 Dust Phase 1 (17–20 January 2008)
The synoptic evolution before and during Dust Phase 1 (14–20 January 2008) is characterized by the movement of a distinct high-pressure system from the subtropical Atlantic (around 33◦N, 35◦W) across the Iberian Peninsula into the western Mediterranean Sea. The core pressure of this system changes very little during this period and ranges between 1028 and 1033 hPa. Figure 4 shows the situation on 17 January 2008,
when the centre of the high was located to the north of the Canary Islands. There is a fairly tight South–North pressure gra-dient to the South of this centre, i.e. over the western parts of West Africa.
Figure 5 provides time series of weather reports from 12 selected stations in this region between 0900 UTC 15 January and 1800 UTC 18 January 2008. Details about the stations and their locations are given in Table 1 and the inset of Fig. 6, respectively. The symbols employed follow the SYNOP coding standardized by the WMO and are explained in the legend of Fig. 5. Note that reports of ‘haze’ can generally be related to a range of meteorological conditions, but—considering the region and time of year—are assumed to be caused by dust. There is a clear tendency for increasing reports of dust storms, dust raising, suspended dust, and/or dust haze with the approach of the high-pressure centre and the associated increase in the South–North pressure gradient. Until midday of 16 January 2008 there are only occasional reports of dust raising or suspended dust, most notably at Nouakchott during the afternoon of 15 January, which might be related to coastal affects. At 1200 and 1500 UTC on 16 January 2008 there are reports of dust raising and even a dust storm at seven Mauritanian stations followed by reports of haze and suspended dust in the afternoon.
[image:7.595.68.549.78.342.2]Fig 3. Airborne HSRL measurements of the backscatter ratio at 532 nm (a) between Dust Phase 1 and 2 on 23 January 2008, (b) during Dust Phase 3 on 29 January 2008, and (c) during the period of No Pure Dust on 6 February 2008. Warm colours denote high aerosol load while cold colours denote clean conditions. Note that the colour scale is logarithmic. Triangles on the latitude axes denote turning points of the aircraft.
dust raising reported at all stations but Aioun and Boutilimit (Fig. 5). There is again a tendency for dust raising to occur around 1200 UTC, which is then followed by reports of sus-pended dust and dust haze in the afternoon or even persisting through the night (as at the coastal stations Nouakchott and Nouadhibou). The observations of 18 January 2008 show a sim-ilar picture, but a slight tendency to more reports of haze and suspended dust and less reports of dust raising. The former is most likely related to emissions during the previous day, while the latter fits with the northward movement of the high-pressure
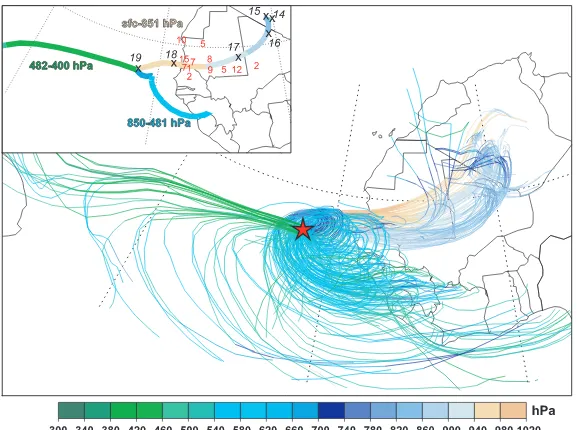
[image:8.595.112.465.74.539.2]Fig 4. Evolution of the high-pressure system before and during Dust Phase 1. Shown is the mean sea-level pressure at 1200 UTC 17 January 2008 (shaded) and the track during the previous and following three days (14–20 January 2008). The black dots and numbers give the location and maximum core pressure in hPa for these days. The large dot denotes 17 January 2008. The star marks the position of Cape Verde. The white boxes refer to the areas used for the analysis in Section 4.5.
Fig 5. Synoptic station reports leading up to Dust Phase 1.
Three-hourly reports from 12 selected stations in Mali, Mauritania, and Senegal between 0900 UTC 15 January and 1800 UTC 18 January 2008. The table is organized along an East–West gradient with the easternmost station Timbouctou at the top. The legend below the figure explains the symbols used. More information on the stations is provided in Table 1.
of synoptic station reports for dust source analysis despite their scattered spatial distribution and smaller temporal resolution.
Five-day backward trajectories from the lower to mid-troposphere started around Praia (14.5–15.5◦N, 23–24◦W, surface–400 hPa) at 1200 UTC 19 January 2008 (Fig. 6) clearly link the dust emission events over Mauritania and neighbouring countries with the increase in dustiness over the Cape Verde Islands between 16 and 19 January 2008 (Fig. 1). Trajecto-ries reaching Praia between the surface and 850 hPa show a coherent air stream that originates over southwestern
Al-geria on 14–15 January 2008 and then passes over north-ern Mali and southnorth-ern Mauritania/northnorth-ern Senegal reaching the Atlantic coast on 18 January 2008 (Fig. 6). There is a tendency of the northern trajectories to follow lower paths, which is favourable for dust transport, as dust sources are more prevalent in the northern part of the affected region. The trajectory-ensemble mean for this layer (126 trajectories; inset in Fig. 6) subsides from around 850 hPa over Algeria to close to the surface over western Mauritania and passes over the dust sources between midday of 16 January 2008 and midday of 18 January 2008 (see dates along the trajectory) consistent with the period of strongest dust activity discussed above. The sum of all dust-related weather reports from Fig. 5 are given as red numbers in the inset of Fig. 6 for illustration. The advance of the ensemble-mean trajectory is highest between midday of 17 Jan-uary 2008 and midday of 18 JanJan-uary 2008 indicating strongest low-level flow during this period. This analysis demonstrates a causal relationship between the approach of the subtropical high to northwestern Africa and the dust episode at Cape Verde. Given the fairly small distance to source regions, typical transport times during this event are only 1–3 d, consistent with the fairly high fraction of particles larger than 10µm shown in Fig. 1c.
[image:9.595.258.544.77.270.2] [image:9.595.72.299.291.490.2]Fig 6. Dust Phase 1: 5-d backward trajectories started between the surface and 400 hPa over Praia (14.5–15.5◦N, 23–24◦W; 9 horizontal grid points) at 1200 UTC on 19 January 2008. The inset shows mean trajectories for three subjectively identified, distinct layers. The crosses and black numbers indicate the midday positions of the mean low-level trajectory. Red numbers give total counts of dust-related weather reports during 0900 UTC 15 January and 1800 UTC 18 January 2008 at synoptic stations along the trajectory path (see Fig. 5 for more details). The colour coding in both the main figure and the inset shows trajectory height in hPa according to the legend at the bottom. The star marks the position of Cape Verde.
westerly directions and are most likely related to the subtropical jet stream. There is some evidence of a weak trough over the western subtropical Atlantic, but over the Cape Verde Islands the flow is due eastward. This layer corresponds to the fairly clean air above about 5 km height as evident from Figs 1 and 2. The trajectory analysis is therefore largely consistent with the aerosol classification shown in Fig. 2a.
4.2 Dust Phase 2 (24–26 January 2008)
The analysis of the meteorological conditions leading up to Dust Phase 2 follows the same approach as in the previous subsection. The high-pressure system that dominated Dust Phase 1 (Fig. 4) split into two centres by 1200 UTC on 21 January 2008, one over the northwestern Iberian Peninsula and one over northern Algeria (Fig. 7a). The latter extends far into northern Africa and causes a strong south-north pressure gradient over the Sahel and southern Sahara reaching from the Mauritanian coast in the west to Chad in the east. The SEVIRI dust product for this time indicates widespread emissions from multiple sources, mainly from Mali and Niger, but also from the Bod´el´e Depression in Chad, and smaller sources in Algeria and Mauritania (Fig. 7c). The available station reports confirm emissions from this broad region. Many stations in southern Mali and Burkina Faso report suspended dust, which has most likely been transported from sources further north (see symbols in Fig. 7c).
The situation on the following day (i.e. 1200 UTC 22 Jan-uary 2008) is very similar. The synoptic-scale circulation is still dominated by the extensive high over northern Africa (not shown). Dust emissions are very intense over the Bod´el´e Depres-sion, but somewhat less pronounced from sources further west (Fig. 7d). Again, many stations in the Sahel report dust raising or suspended dust on this day. During this time, pure dust was
observed in the lowermost 600–800 m topped by a complex lay-ering of a mixture of dust and smoke up to 4 km height above Cape Verde (Fig. 3a). The high-pressure system retreats on 23 January 2008 and dust emissions weaken over West Africa until 25 January 2008 as indicated by both SEVIRI dust images and station reports (not shown). A close inspection of time series of dust reports for the active stations as in Fig. 6 confirms a maximum in dust raising at 1200–1500 UTC and a tendency to reports of suspended dust and dust haze during the evening and night (not shown), which corroborates the influence of LLJs on dustiness as discussed above.
[image:10.595.51.340.76.291.2]Fig 7. Dust Phase 2: (a) Mean sea-level pressure at 1200 UTC on 21 January 2008 (note the different colour scale compared to Fig. 4). (b) Trajectory ensemble means and station reports as in the inset of Fig. 6 but for a start date at 1200 UTC on 25 January 2008. The reports cover the period from 0900 UTC 21 January to 1800 UTC 24 January 2008. (c) and (d) SEVIRI dust product overlaid with station reports of ‘dust in suspension’ (black) and “dust raised by the wind” (orange) (see Fig. 5 for more details on the weather symbols). Shown times are 1200 UTC on 20 and 21 January 2008 (c and d, respectively). More information on the stations is provided in Table 1. Stars mark the position of Cape Verde. The white boxes refer to the areas used for the analysis in Section 4.5.
Other notable differences are a deeper dust layer as indicated by both the lidar measurements (Fig. 2b) and the trajectory analysis (top of low-level air stream 821 hPa versus 851 hPa for Dust Phase 1), and a higher AOT of around 0.65 (compared to about 0.3 for Dust Phase 1).
The analysis of more elevated trajectories indicates the in-fluence of a weak upper-level trough west of the Cape Verde Islands. The uppermost layer (520–400 hPa, 36 trajectories) shows a weak cyclonic curvature in the overall westerly flow over the northern tropical Atlantic (Fig. 7b). A surface reflection of this upper-level disturbance is the weak inverted trough with an axis between 20 and 30◦W in the mean sea-level pressure field (Fig. 7a). The satellite images show a cloud band on the eastern side of this trough on 21 and 22 January 2008 (Figs 7c and d). The mid-level trajectory ensemble (820–521 hPa, 99 trajecto-ries) is again less coherent, but shows much less contributions from continental air masses than during Dust Phase 1, which is consistent with the relatively shallow smoke-dominated layer in Fig. 1a.
4.3 Dust Phase 3 (28 January–2 February 2008)
[image:11.595.70.547.77.392.2]Fig 8. Dust Phase 3: (a) Mean sea-level pressure at 1200 UTC on 26 January 2008 including the track of the dominating high with maximum pressure on three previous and two following days. (b) Trajectory ensemble means and station reports as in Fig. 6 but for a start date at 1200 UTC on 30 January 2008. The reports cover the period from 0900 UTC 26 January to 1800 UTC 29 January 2008. (c) and (d) same as Fig. 7c and 6d but for 1200 UTC on 26 and 27 January 2008, respectively. Stars mark the position of Cape Verde. The white boxes refer to the areas used for the analysis in Section 4.5.
The diurnal cycle during this period confirms once again the importance of the breakdown of the LLJ with more than 60% of all reports of dust raised at 1200 UTC (not shown).
An ensemble-mean trajectory for the layer reaching Praia be-tween the surface and 801 hPa started at 1200 UTC 30 January 2008 (Fig. 8b) reveals many similarities with the situation on 25 January 2008 shown in Fig. 7b. The mean trajectory is slightly shorter than during Dust Phase 2 with a starting point close the border triangle Algeria–Mali–Niger, but follows almost the same path across southern Mali and northern Senegal to the Cape Verde Islands. Fastest advance is between midday of 26 and 28 January 2008 consistent with a lot of dust reports along the trajectory track (red numbers in Fig. 8b). The ensemble-mean trajectory decelerates somewhat during the last 2 d, when the emitted dust is carried to Praia. The layer of coherent flow is again fairly deep and in close agreement with the lidar measure-ments that show dust dominating up to about 1.5 km height. The HSRL cross-section of 29 January 2008 is shown in Fig. 3b. Above a 1-km deep pure dust layer that was present over the Cape Verde area only slight traces of aerosol are detected at
2.0 and 3.5 km height. On 29 and 30 January 2008 the highest surface mass concentrations during the entire campaign were measured with dust fractions of close to 100% (Schladitz et al., 2011). The fact that the mean size distribution (see fig. 5 in Kandler et al., 2011) is more clearly dominated by particles smaller than 10µm than during Dust Phase 1 (Fig. 1c) is consis-tent with a transport from the more remote sources over Mali and Niger over the course of typical transport times of 3–5 d. Mea-surements of the single-scattering albedo (M¨uller et al., 2011) show an increase with larger wavelengths. These conditions are similar to measurements during SAMUM-1 in Morocco.
[image:12.595.51.527.74.393.2]Fig 9. Phase 4: 5-d backward trajectories as in Fig. 6 but (a) starting at 1200 UTC on 6 February 2008 and (b) starting at 1200 UTC on 9 February 2008. The star marks the position of Cape Verde.
levels. The westerly flow at upper levels (600–400 hPa) causes again rather clean conditions aloft. There are weak indications of a trough to the west of the Cape Verde Islands in the ensemble-mean trajectory, consistent with the weak inverted trough in the sea-level pressure field (Fig. 8a) and a cloud band in the satellite images (Figs 8c and d).
4.4 No Pure Dust (6–14 February 2008)
After 30 January 2008 the high-pressure situation prevails for several days causing occasional, but less widespread dust emis-sion in the Sahel. Around 2 February 2008 the subtropical high begins to diminish and stays weak until the end of the campaign. As a consequence, surface mass concentrations in Praia around midday of 4 February 2008 drop to very low values (Fig. 1c). Above about 500 m height a shallow dust layer prevails until 6 February 2008. The rest of the campaign (until 15 February 2008) is then characterized by a maritime layer up to about 1 km
[image:13.595.256.545.75.473.2]Fig 10. Time series of wind speed measured at about 5 m height above ground level at Praia during 13 January–11 February 2008. Shown are averages over 30-min intervals (black line) and daily means (red line and symbols). The horizontal line marks the assumed threshold wind velocity of 5.5 m s−1. The blue bars correspond to the observation of maritime aerosol as displayed in Fig. 1 while the four phases are marked in grey.
the entire atmospheric column over Praia is affected by mar-itime air masses from westerly and northwesterly directions on this day, a rather unusual situation in the trade wind region. The slight backing of the flow with height indicates cold advection associated with this feature. Lidar observations indicate clean maritime background conditions (Groß et al., 2011a).
4.5 Statistical analysis
The description of the three dust phases and the period without pure dust in the previous subsections suggest a close relationship between the strength and position of the subtropical high over the western North Atlantic and dust loadings over Cape Verde. In order to better quantify this connection, linear correlations have been computed between the daily TSP time series shown in Fig. 1c and the large-scale north–south gradient in mean sea-level pressure as evident from operational ECMWF analyses at 1200 UTC (see Fig. 4 for an example). After some testing, differences between the area means over 25–35◦N, 20◦W–10◦E and 5–15◦N, 20◦W–10◦E (see Figs 4, 7a and 8a for the location of these boxes) were chosen to best represent the maximum gradient. The strongest correlation of 0.65 is achieved for a time lag of 2–3 d, i.e. pressure leading by 47–48 h to the beginning and 71–72 h to the end of the TSP measuring period (recall that filters were usually changed between 1100 and 1200 UTC).
This lag agrees well with the typical times between emission over West Africa and transport to Cape Verde estimated from station observations, satellite imagery, and trajectories in Sec-tions 4.1–4.3. Weaker but still significant correlaSec-tions are found
for lags between−3 and+2 d, underlining the synoptic-scale nature of the dust events. A closer inspection of the pressure-difference time series (not shown) suggests that significant dust events require values above 14 hPa, while fluctuations below this threshold are less well reflected in TSP variations. This result has some potential for a simple dust-forecast index for Cape Verde during the boreal winter Harmattan season, although it would certainly be desirable to test the robustness of this relationship with a longer data set.
5. Other types of aerosols: sea salt and
biomass-burning smoke
[image:14.595.115.460.77.308.2]Fig 11. Results from the regional model COSMO–MUSCAT. Meridional-vertical cross-section along 5◦W at 1200 UTC on 17 January 2008 showing virtual potential temperature (K, colours), specific humidity (g kg−1, black), and extinction coefficients at 550 nm (km−1) due to dust (red)
and biomass-burning aerosol (white).
and end of the campaign to values below 1 m s−1around 0000
UTC on 22 January 2008. There are indications of a diurnal cycle with a general tendency of stronger winds during midday and weaker winds during the night and morning. This is possibly related to the deepening of the boundary layer and a sea-breeze circulation during the day (Engelmann et al., 2011).
Three distinct phases can be distinguished. During 16–18 Jan-uary 2008 winds are generally above 6 m s−1 (Fig. 10) and the
maritime surface layer is clearly identifiable in lidar measure-ments (Fig. 1a). From 19 January 2008 until 1 February 2008 winds slacken and lidar measurements are dominated by dust and smoke particles. A notable exception during this period is the marked increase in wind speed and an associated reappear-ance of the maritime surface layer for several hours on 28 Jan-uary 2008. The last part of the campaign is again characterized by higher winds and a well-defined sea-salt layer. This simple analysis suggests that the daily mean threshold velocity for the occurrence of the maritime layer over Praia is about 5.5 m s−1.
According to trajectory analysis, the biomass-burning aerosol observed at Praia during SAMUM-2 largely originated from southern West Africa (see the trajectories in Fig. 6 for an example). A detailed analysis of day-to-day variations in smoke emission as indicated by, e.g. the Moderate-resolution Imaging Spectroradiometer (MODIS) fire products (http://rapidfire.sci.gsfc.nasa.gov/firemaps/) is beyond the scope of SAMUM-2. A qualitative inspection of measurements at Praia and trajectories suggests that the synoptic–scale circulation is the main control on the amount of biomass-burning aerosol reach-ing Cape Verde (see also Section 4). Here the example of 17 January 2008 is briefly discussed to illustrate some key features
over the source region. For 1200 UTC on this day, Fig. 11 shows a longitudinal cross-section along 5◦W of virtual potential tem-perature, specific humidity, and extinction coefficients due to mineral dust and biomass-burning aerosol as simulated by the regional model COSMO-MUSCAT (Heinold et al., 2011). Sig-nificant dust concentrations are found in the lowest kilometre of the atmosphere over the Sahara between 17 and 20◦N and in a deeper layer covering southern Mali, Cˆote d’Ivoire, and the adjacent Gulf of Guinea (0–17◦N). This dust has most likely been advected southward by the Harmattan winds and has then been mixed upwards by shallow to mid–level convection (see the deeper moist layer indicated by black lines in Fig. 11). South of 10◦N, where biomass-burning activity is most intensive, smoke is injected into the dust layer and equally mixed to higher lev-els. Concentrations are highest between 8 and 9◦N, a typical location of the surface convergence between the dry Harmattan and the moist southerlies during this time of year. Easterly flow at mid-levels can eventually transport the dust/smoke mixture to the Cape Verde Islands. Due to their small sizes and conse-quently longer lifetimes smoke particles can also be mixed up to the tropopause where they get carried northward by the upper branch of the Hadley circulation (Fig. 11). The increasing west-erlies in this region transport smoke particles away from Cape Verde, consistent with clean conditions above 5 km height on most days during SAMUM-2 (Fig. 1).
6. Summary and conclusions
[image:15.595.140.477.77.300.2]together with satellite images, gridded analyses, and surface sta-tion data, provide an excellent basis to study meteorological conditions for dust mobilization in northern Africa and aerosol transport to the eastern Atlantic Ocean, including mixing with other aerosol types such as sea salt and biomass-burning smoke from land fires over southern West Africa. The combination of ground-based meteorological and particle measurements with lidar and Sun-photometer remote sensing allowed for a much more detailed and temporally and vertically higher-resolved classification of the aerosol conditions over Cape Verde than previously possible. The meteorological overview given in this paper adds observation–based evidence to previously suggested mechanisms of dust emission and transport, and places the more detailed analyses of aerosol properties and radiative effects per-formed as part of SAMUM-2 and presented in this special issue into a large-scale context.
The main conclusions from this work are:
(i) The wintertime AOT over Cape Verde is mainly controlled by the presence and intensity of layers of mineral dust and biomass-burning smoke. Sea-salt in the maritime boundary layer makes a minor contribution to the total AOT over Cape Verde.
(ii) The Ångstr¨om exponent responds to the dominating aerosol type reaching values of up to 0.8 in smoke-dominated and values below 0.1 in dust-dominated situations.
(iii) Sea-salt layers were present during more than half of the campaign. They are usually restricted to the lowest 1 km of the atmosphere and their presence is closely coupled to local wind velocities with a threshold of about 5.5 m s−1.
(iv) Smoke dominated layers were present on all but four days during the campaign. They usually occurred between 0.5 and 5.0 km height depending on the strength and vertical extent of the synoptic-scale mid-level easterlies that allow for an effi-cient transport from the main sources over southern West Africa to Cape Verde.
(v) Above 5 km height, westerly flow at the southern flank of the subtropical jet and very clean conditions prevailed through-out the entire campaign. On one occasion a cyclonic distur-bance from mid-latitudes affected the tropical eastern Atlantic causing deeper westerlies and clean conditions with AOTs below 0.05.
(vi) Dust layers over Cape Verde showed a complicated day-to-day variations in intensity and vertical structure. On many days, dust aerosol was mixed into the maritime surface layer or occurred in smoke dominated elevated layers. But during extreme periods dust dominated the entire lowest 1.5 km of the atmosphere or was literally absent from the whole column.
(vii) There is some evidence that the dust-smoke mix is cre-ated over low-latitude West Africa and the adjacent Gulf of Guinea in connection with shallow to mid-level convection, while the pure dust at lower levels is directly transported from the Sahara with the Harmattan winds.
(viii) Three major dust phases with AOTs above 0.5 and surface mass concentrations above 200 µg m−3 occurred. All
three were intimately connected with the intensity and south-ward extension of the Azores High, which controls the strength of the Harmattan winds over the western Sahara and the subse-quent transport to Cape Verde. This adds evidence to the pre-viously suggested relationship to the North Atlantic Oscillation (Moulin et al., 1997; Mahowald et al., 2003; Ginoux et al., 2004; Chiapello et al., 2005; Evan et al., 2006b).
(xi) Depending on the exact position of the high, main dust sources were either Mauritania and western Mali (typical travel times of 1–3 d) or eastern Mali and Niger (typical travel times of 3–5 d).
(x) Dust emission during these episodes mainly occurred dur-ing midday hours adddur-ing further evidence to the assumption that momentum from nocturnal LLJs is mixed to the surface with the evolution of the daytime boundary layer (Knippertz, 2008; Todd et al., 2008; Schepanski et al., 2009).
7. Acknowledgments
The SAMUM researcher group is funded by the German Sci-ence Foundation (DFG) under Grant FOR539. We would like to thank the German Weather Service (DWD) for providing access to ECMWF data and EUMETSAT for providing the infrared brightness temperatures used to create the dust product. We are grateful to Andreas H. Fink (University of Cologne) for provid-ing the SYNOP data and to Heini Wernli for help with usprovid-ing LAGRANTO. We like to thank two anonymous reviewers for their fruitful comments that helped to improve an earlier version of the paper.
References
Ansmann, A., Tesche, M., Althausen, A., M¨uller, D., Freudenthaler, V. and co-authors. 2008. Ice formation in Saharan dust over northern Africa observed during SAMUM.J. Geophys. Res. 113, doi:10.1029/2007JD008785.
Ansmann, A., Baars, H., Tesche, M., M¨uller, D., Althausen, A. and co-authors. 2009a. Dust and smoke transport from Africa to South America: lidar profiling over Cape Verde and the Amazon rain forest.
Geophys. Res. Lett.36, doi:10.1029/2009GL037923.
Ansmann, A., Tesche, M., Seifert, P., Althausen, A., Engelmann, R. and co-authors. 2009b. Evolution of the ice phase in tropical altocumulus: SAMUM lidar observations over Cape Verde.J. Geophys. Res.114, doi:10.1029/2008JD011659.
Ansmann, A., Petzold, A., Kandler, K., Tegen, I., Wendisch, M. and co-authors. 2011. Saharan Mineral Dust Experiments SAMUM-1 and SAMUM-2: what have we learned? Tellus 63B, this issue.
Bauer, S. E., Mishchenko, M. I., Lacis, A. A., Zhang, S., Perlwitz, J. and co-authors. 2007. Do sulfate and nitrate coatings on mineral dust have important effects on radiative properties and climate modeling?
J. Geophys. Res.112, doi:10.1029/2005JD006977.
burned biomass, and atmospheric emissions.Glob. Biogeochem. Cy-cles13, 933–950.
Ben–Ami, Y., Koren, I. and Altaratz, O. 2009. Patterns of North African dust transport over the Atlantic: winter vs. summer, based on CALIPSO first year data.Atmos. Chem. Phys.9, 7867–7875. Ben–Ami, Y., Koren, I., Rudich, Y., Artaxo, P., Martin, S. T. and
co-authors. 2010. Transport of North African dust from the Bod´el´e de-pression to the Amazon Basin: a case study.Atmos. Chem. Phys.10, 7533–7544.
Carlson, T. N. and Caverly, R. S. 1977. Radiative characteristics of Saharan dust at solar wavelengths.J. Geophys. Res.82, 3142–3152. Chiapello, I., Bergametti, G., Gomes, L., Chaternet, B., Dulac, F., and
co-authors. 1995. An additional low layer transport of Sahelian and Saharan dust over the northeastern tropical Atlantic.Geophys. Res.
Lett.22, 3191–3194.
Chiapello, I., Moulin, C. and Prospero, J. M. 2005. Understanding the long-term variability of African dust transport across the Atlantic as recorded in both Barbados surface concentrations and large-scale Total Ozone Mapping Spectrometer (TOMS) optical thickness. J.
Geophys. Res.110, doi:10.1029/2004JD005132.
Cropp, R. A., Gabric, A. J., McTainsh, G. H., Braddock, R. D. and Tindale, N. 2005. Coupling between ocean biota and atmospheric aerosols: dust, dimethylsulphide, or artifact?Global Biogeochem. Cy-cles19, doi:10.1029/2004GB002436.
DeMott, P. J., Sassen, K., Poellot, M. R., Baumgardner, D., Rogers, D. C. and co-authors. 2003. African dust aerosols as atmospheric ice nuclei.Geophys. Res. Lett.30, doi:10.1029/2003GL017410. Engelmann, R., Ansmann, A., Tesche, M., Seifert, P., Althausen, A.
and co-authors. 2011. Doppler lidar studies of heat island effects on vertical mixing of aerosols during SAMUM–2.Tellus63B, this issue. Esselborn, M., Wirth, M., Fix, A., Weinzierl, B., Rasp, K., and co-authors. 2009. Spatial distribution and optical properties of Saharan dust observed by airborne high spectral resolution lidar during SA-MUM 2006.Tellus61B, doi:10.1111/j.1600-0889.2008.00394.x. Evan, A. T., Dunion, J., Foley, J. A., Heidinger, A. K. and Velden,
C. S. 2006a. New evidence for a relationship between Atlantic tropical cyclone activity and African dust outbreaks.Geophys. Res. Lett.33, doi:10.1029/2006GL026408.
Evan, A. T., Heidinger, A. K. and Knippertz, P. 2006b. Analysis of winter dust activity off the coast of West Africa using a new 24-year over water AVHRR satellite dust climatology.J. Geophys. Res.111, doi:10.1029/2005JD006336.
Freudenthaler, V., Esselborn, M., Wiegner, M., Heese, B., Tesche, M. and co-authors. 2009. Depolarization-ratio profiling at several wave-lengths in pure Saharan dust during SAMUM 2006.Tellus61B, doi: j.1600-0889.2008.00396.x.
Ginoux, P., Prospero, J. M., Torres, O. and Chin, M. 2004. Long-term simulation of global dust distribution with the GOCART model: cor-relation with North Atlantic Oscillation.Environ. Model. Software19, doi:10.1016/S1364-8152(03)00114-2.
Gong, S. L., Barrie, L. A. and Blanchet, J. P. 1997. Modeling sea–salt aerosols in the atmosphere 1. Model development.J. Geophys. Res.
102, 3805–3818.
Goudie, A. S. and Middleton, N. J. 2001. Saharan dust storms: nature and consequences.Earth-Sci. Rev.56, 179–204.
Groß, S., Tesche, M., Freudenthaler, V., Toledano, C., Wiegner, M., and co-authors. 2011a. Characterization of
Saha-ran dust, marine aerosols, and a mixture of biomass burning aerosols and dust by means of multi-wavelength depolarization and Raman measurements during SAMUM–2. Tellus 63B, this issue.
Groß, S., Freudenthaler, V., Wiegner, M., Greiß, A., Tesche, M., and co-authors. 2011b. Characterization of the planetary boundary layer during SAMUM–2 by means of lidar measurements.Tellus63B, this issue.
Haywood, J., Francis, P., Osborne, S., Glew, M., Loeb, N. and co-authors. 2003. Radiative properties and direct radiative effect of Saharan dust measured by the C-130 aircraft during SHADE: 1. solar spectrum.J.
Geophys. Res.108, doi:10.1029/2002JD002687.
Haywood J. M., Pelon, J., Formenti, P., Bharmal, N., Brooks, M. and co-authors. 2008. Overview of the dust and biomass–burning experiment and African monsoon multidisciplinary analysis special observing period-0.J. Geophys. Res.113, doi:10.1029/2008JD010077. Heinold, B., Tegen, I., Esselborn, M., Kandler, K., Knippertz, P. and
co-authors. 2009. Regional modeling of Saharan dust during the SAMUM 2006 campaign.Tellus61B, doi:j.1600-0889.2008.00387.x. Heinold, B., Tegen, I., Esselborn, M., Kandler, K., Knippertz, P.
and co-authors. 2011. Regional modeling of Saharan dust and biomass–burning. Part 1: model description and evaluation.Tellus
63B, this issue.
Heintzenberg, J. 2009. The SAMUM–1 experiment over south-ern Morocco: overview and introduction. Tellus 61B, doi:j.1600-0889.2008.00403.x.
Huang, J., Zhang, C. and Prospero, J. M. 2010. African dust outbreaks: a satellite perspective of temporal and spatial variability over the tropi-cal Atlantic ocean.J. Geophys. Res.115, doi:10.1029/2009JD012516. Hultin, K. H., Nilsson, E. D., Krejci, R., M˚artensson, E. M., Ehn, M. and co-authors. 2010. In situ laboratory sea spray production during the Marine Aerosol Production 2006 cruise on the northeastern Atlantic ocean.J. Geophys. Res.115, doi:10.1029/2009JD012522.
Johnson, T. B., Osborne, S. R., Haywood, J. M. and Harri-son, M. A. J. 2008. Aircraft measurements of biomas-burning aerosol over West Africa during DABEX. J. Geophys. Res. 113, doi:10.1029/2007JD009451.
Kalu, A. E. 1979. The African dust plume: its characteristics and prop-agation across West Africa in winter. InSaharan Dust. (ed. Morales, C.). J. Wiley and Sons, Chichester, 95–118.
Kandler, K., Sch¨utz, L., J¨ackel, S., Lieke, K., Emmel, C. and co-authors. 2011. Ground-based of–line aerosol measurements at Praia, Cape Verde, during the Saharan Mineral Dust Experiment: microphysical properties and mineralogy.Tellus63B, this issue.
Kaufmann, Y. J., Koren, I., Remer, L. A., Tanr´e, D., Ginoux, P., and co-authors. 2005. Dust transport and deposition observed from the Terra–Moderate Resolution Imaging Spectroradiometer (MODIS) spacecraft over the Atlantic ocean.J. Geophys. Res.110, doi:10.1029/2003JD004436.
Knippertz, P. and Fink, A. H. 2006. Synoptic and dynamic aspects of an extreme springtime Saharan dust outbreak.Quart. J. Roy. Meteorol. Soc.132, 1153–1177.
Knippertz, P. 2008. Dust mobilization in the West African heat trough— the role of the diurnal cycle and of extratropical synoptic disturbances.
Meteorol. Zeitschr.17, 553–563.
Sahara during SAMUM 2006—a meteorological overview.Tellus
61B, doi:10.1111/j.1600-0889.2008.00380.x.
Li, J., Zhang, T., Schmit, J., Schmetz, J. and Menzel, W. 2007. Technical note: quantitative monitoring of a Saharan dust event with SEVIRI on Meteosat-8.Int. J. Remote Sens.28, 2181–2186.
Lieke, K., Kandler, K., Sch¨utz, L., Petzold, A., Weinzierl, B., and co-authors. 2011. Particle chemical properties in the vertical column based on aircraft observations in the vicinity of Cape Verde islands.
Tellus63B, this issue.
Liu, Z., Omar, A., Vaughan, M., Hair, J., Kittaka, C. and co-authors. 2008. CALIPSO lidar observations of the optical properties of Saharan dust: a case study of long–range transport.J. Geophys. Res.113, doi:10.1029/2007JD008878.
Mahowald, N. M., Luo, C., del Corral, J. and Zender, C. S. 2003. Interannual variability in atmospheric mineral aerosols from a 22-year model simulation and observational data.J. Geophys. Res.108, doi:10.1029/2002JD002821.
Mahowald, N. M., Baker, A. R., Bergametti, G., Brooks, N., Duce, R. A. and co-authors. 2005. Atmospheric global dust cy-cle and iron inputs to the ocean.Global Biogeochem. Cycles19, doi:10.1029/2004GB002402.
Monahan, E. C., Fairall, C. W., Davidson, K. L. and Boyle, P. J. 1983. Observed interrelations between 10–m winds, ocean white-caps, and marine aerosols.Quart. J. Roy. Meteor. Soc.109, 379– 392.
Moulin, C., Lambert, C. E., Dulac, F. and Dayan, U. 1997. Control of atmospheric export of dust from North Africa by the North Atlantic Oscillation.Nature387, 691–694.
M˚artensson, E. M., Nilsson, E. D., de Leeuw, G., Cohen, L. H. and Hansson, H. C. 2003. Laboratory simulations and parameterization of the primary marine aerosol production.J. Geophys. Res.108, doi:10.1029/2002JD002263.
McKendry, I. G., Strawbridge, K. B., O’Neill, N. T., Macdonald, A. M., Liu, P. S. K. and co-authors. 2007. Trans–Pacific transport of Saharan dust to western North America: a case study.J. Geophys. Res.112, doi:10.1029/2006JD007129.
M¨ohler, O., Benz, S., Saathoff, H., Schnaiter, M., Wagner, R., and coau-thors 2008. The effect of organic coating on the heterogeneous ice nucleation efficiency of mineral dust aerosols.Environ. Res. Lett.3, doi:10.1088/1748-9326/3/2/025007.
Morales, C. 1986. The airborne transport of Saharan dust: a review.
Clim. Change9, 219–241.
M¨uller, T., Schladitz, A. and Wiedensohler, A. 2011. Spectral par-ticle absorption coefficients, single scattering albedos, and imagi-nary parts of refractive indices from ground based in-situ measure-ments at Cape Verde Island during SAMUM–2.Tellus 63B, this issue.
Pelon, J., Mallet, M., Mariscal, A., Goloub, P., Tan´re, D. and co-authors. 2008. Microlidar observations of biomass-burning aerosol over Djougou (Benin) during African monsoon multidisciplinary analysis special observation period 0: dust and biomass-burning ex-periment.J. Geophys. Res.113, doi:10.1029/2008JD009976. Petzold, A., Veira, A., Mund, S., Esselborn, M., Kiemle, C.
and co-authors. 2011. Mixing of mineral dust with ur-ban pollution aerosol over Dakar (Senegal)—impact on dust physico–chemical and radiative properties. Tellus 63B, this issue.
Prospero, J. M. and Carlson, T. N. 1972. Vertical and areal distribution of Saharan dust over the western equatorial North Atlantic ocean.J.
Geophys. Res.77, 5255–5265.
Prospero, J. M. and Carlson, T. N. 1980. Saharan air outbreaks over the tropical North Atlantic.Pure Appl. Geophys.119, 677–691. Rosenfeld, D., Rudich, Y. and Lahav, R. 2001. Desert dust
suppress-ing precipitation: a possible desertification feedback loop.PNAS98, doi:10.1073/pnas.101122798.
Sassen, K. and Weitkamp, C. eds. 2005. Polarization in Lidar.LIDAR— Range-Resolved Optical Remote Sensing of the Atmosphere, Springer
Series in Optical Sciences. Springer, New York, 19–42.
Schepanski, K., Tegen, I., Laurent, B., Heinold, B. and Macke, A. 2007. A new Saharan dust source activation frequency map de-rived from MSG-SEVIRI IR-channels. Geophys. Res. Lett. 34, doi:10.1029/2007GL030168.
Schepanski, K., Tegen, I., Todd, M. C., Heinold, B., B¨onisch, G., and co-authors. 2009. Meteorological processes forcing Saharan dust emission inferred from MSG-SEVIRI observations of subdaily dust source activation and numerical models.J. Geophys. Res.114, doi:10.1029/2008JD010325.
Schladitz, A., M¨uller, T., Nowak, A., Kandler, K., Lieke, K., and co-authors. 2011. In-situ aerosol characterization at Cape Verde. Part 1: particle number size distributions, hygroscopic growth and state of mixing of the marine and Saharan dust aerosol.Tellus63B, this issue.
Slingo, A., Ackermann, T. P., Allan, R. P., Kassianov, E. I., McFarlane, S. A. and co-authors. 2006. Observations of the impact of a major Saharan dust storm on the atmospheric radiation balance.Geophys.
Res. Lett.33, doi:10.1029/2006GL027869.
Sokolik, I., Toon, O. and Bergstrom, R. 1998. Modeling the radiative characteristics of airborne mineral aerosols at infrared wavelengths.
J. Geophys. Res.103, 8813–8826.
Swap, R., Garstang, M., Greco, S., Talbot, R. and K˚allberg, P. 1992. Saharan dust in the Amazon basin.Tellus44B, 133–149.
Tanr´e, D., Haywood, J., Pelon, J., L´eon, J. F., Chatenet, B. and co-authors. 2003. Measurement and modeling of the Saharan dust radia-tive impact: overview of the Saharan Dust Experiment (SHADE).J.
Geophys. Res.108, doi:10.1029/2002JD003273.
Tesche, M., Ansmann, A., M¨uller, D., Althausen, D., Mattis, I. and co-authors. 2009a. Vertical profiling of Saharan dust with Raman lidars and airborne HSRL in southern Morocco during SAMUM.Tellus
61B, doi:j.1600-0889.2008.00390.x.
Tesche, M., Ansmann, A., M¨uller, D., Althausen, D., Engelmann, R., and co-authors. 2009b. Vertically resolved separation of dust and smoke over Cape Verde by using multiwavelength Raman and polarization lidars during Saharan Mineral Dust Experiment 2008.J. Geophys. Res.114, doi:10.1029/2009JD011862.
Tesche, M., Groß, S., Ansmann, A., M¨uller, D., Althausen, D. and co-authors. 2011a. Profiling of Saharan dust and biomass–burning smoke with multiwavelength polarization Raman lidar at Cape Verde.Tellus
63B, this issue.
Tesche, M., M¨uller, D., Groß, S., Ansmann, A., Althausen, D. and co-authors. 2011b. Optical and microphysical properties of smoke over Cape Verde as inferred from lidar measurements.Tellus63B, this issue.
mineral dust flux: an intercomparison of model performance over the Bod´el´e Depression, northern Chad. J. Geophys. Res. 113, doi:10.1029/2008JD010476.
Toledano, C., Wiegner, M., Garhammer, M., Seefeldner, M., Garsteiger, J., and co-authors. 2011. Optical properties of aerosol mixtures de-rived from sun–sky radiometry during SAMUM-2.Tellus63B, this issue.
Wernli, H. and Davies, H. C. 1997. A Lagrangian–based analysis of extratropical cyclones. I: the method and some applications.Quart. J.
Roy. Meteor. Soc.123, 467–489.
Washington, R. and Todd, M. C. 2005. Synoptic and dynamic aspects of an extreme springtime Saharan dust outbreak.Geophys. Res. Lett.
32, doi:10.1029/2005GL023597.
Wu, L. 2007. Impact of Saharan air layer on hurricane peak intensity. Geophys. Res. Lett. 34, doi:10.1029/2007GL029 564.