promoting access to White Rose research papers
White Rose Research Online
Universities of Leeds, Sheffield and York
http://eprints.whiterose.ac.uk/
This is the Author's Accepted version of an article published in Biomass and Bioenergy
White Rose Research Online URL for this paper:
http://eprints.whiterose.ac.uk/id/eprint/78107
Published article:
Li, H, Biller, P, Hadavi, SA, Andrews, GE, Lea-Langton, A and Przybyla, G (2013) Assessing combustion and emission performance of direct use of SVO in a
diesel engine by oxygen enrichment of intake air method.Biomass and Bioenergy, 51. 43 - 52. ISSN 0961-9534
1
Assessing combustion and emission performance of direct use of SVO in a diesel engine
2
by oxygen enrichment of intake air method
3
Hu Li[1]*, Patrick Biller[1], Seyed Ali Hadavi[1], Gordon E. Andrews[1], Grzegorz Przybyla[2] 4
and Amanda Lea-Langton[1] 5
6
[1] Energy Research Institute, 7
School of Process, Environmental and Materials Engineering, 8
The University of Leeds, Leeds, LS2 9JT, UK 9
[2] Silesian University of Technology, 44-100 Gliwice, Poland, 10
11
12
13
* Corresponding author’s Address: Dr. Hu Li, Energy Research Institute, School of Process, 14
Environmental and Materials Engineering, Leeds University, Leeds. LS2 9JT, UK. E-mail 15
address: fuehli@leeds.ac.uk. Telephone: +44 113 3437754. Fax: +44 113 2467310 16
17
18
Abstract
20
This work investigated the effect of the oxygen enrichment in the intake air of diesel engines 21
on the combustion and emissions performance using Rape Seed Oil (RSO) as a fuel. The 22
purpose of the paper is to investigate the potential of oxygen enrichment in the intake air 23
method to restrain the deterioration of particulate emissions of the RSO due to its high 24
viscosity so as to explore the possibility of direct use of SVO (Straight Vegetable Oil) in 25
diesel engines, which can reduce CO2emissions and save cost. The combustion parameters 26
such as ignition delay, heat release rate, in-cylinder peak temperature and pressure were 27
determined. Engine out particulate and gaseous emissions of the RSO were measured at 28
oxygen concentrations from 21% (by volume) (no enrichment) to 24% (by volume) and 29
compared to diesel results. The enrichment of the intake air with oxygen decreased the 30
ignition delay and premixed combustion duration, and increased the in-cylinder peak pressure 31
and temperature. The particulate, CO and hydrocarbon emissions were significantly reduced 32
while the NOx emissions increased as the oxygen enrichment rate increased. 22% oxygen 33
enrichment rate was suggested to achieve lower than diesel particulate emissions with the 34
lowest NOx penalty. Increased NOx could be controlled by other methods. The results show 35
that the oxygen enrichment in intake air method enabled direct combustion of SVO in diesel 36
engines with reduced particulate, hydrocarbon and CO emissions. 37
Key words
38
Biofuel, Straight vegetable oil, Exhaust emission, Diesel engine, Oxygen enrichment 39
40
42
43
1. INTRODUCTION
44
Increasing environmental concerns and security of energy supply have accelerated the 45
research and development of alternative fuels for transport and power generation 46
applications. Biodiesel, as a most popular biofuel in transport, is made from 47
transesterification of vegetable oils or animal fats. The transesterification process consumes 48
the energy and produces CO2and increases the cost as well as rejects about 10% of the 49
feedstock as waste glycerine. Straight vegetable oils (SVO) and waste vegetable oils or 50
waste cooking oils (WVO or WCO) can be used as fuels in diesel engines with a better 51
carbon footprint compared to FAME (Fatty Acid Methyl Ester). The use of waste cooking 52
oils and SVOs is potentially cheaper than using petroleum diesel or edible oil biodiesel [1]. 53
However, performance problems have been reported [2, 3]. These unprocessed (non-54
esterified) biofuels are not commonly used due to their high viscosity and low volatility, 55
leading to poor atomisation and thus high particulate emissions as well as other problems 56
such as handling problems and engine deposits and injector coking [4]. This study has 57
investigated the impact of oxygen enrichment in the air inlet of the engine on the combustion 58
and emissions characteristics of rape seed oil burned in a diesel engine. The aim is to explore 59
the possibility of using oxygen enrichment method to overcome the adverse effect on engines 60
and environment caused by the high viscosity of SVO so as to provide essential information 61
to enable further evaluation of oxygen enrichment method as a way to utilise SVO (including 62
waste cooking oils) directly in diesel engines without causing adverse impact. The primary 63
The concept of the oxygen enrichment of intake air as a mean of improving combustion 65
and reducing emissions in diesel engines has been investigated for a long time [5-14]. These 66
researches focused on the air intake enrichment of conventional petroleum diesel and 67
compared with addition of oxygenates in the petroleum diesel. Enrichment of the air intake of 68
naturally aspirated diesel engines can be an effective measure to reduce emission and 69
improve thermal efficiency. Previous publications on the subject suggest that the amount of 70
O2addition is a trade off between NOx increase and reduction of PM (Particulate Matter), 71
HC, CO and smoke emissions. Watson and Rigby [5] conducted experiments on a Caterpillar 72
V-8 engine with oxygen enrichment up to 30 % (volume fraction and so as hereinafter). They 73
found smoke emissions to decrease gradually with O2increase to around 10 H.S.U. 74
(Hartridge Smoke Unit) at all engine speeds compared to 80 H.S.U. for 21% O2(no oxygen 75
enrichment). NOx emissions gradually increased with increasing oxygen enrichment to about 76
20% at 30% oxygen, acceptable levels were found at 24 % oxygen. Particulate emissions 77
were reduced up to 80 % at full load conditions. Desai and Watson [7] further investigated 78
impact of different grades of diesel fuels at various O2enrichment rates for emission 79
characteristics and performance. They found that smoke and particulate emissions 80
substantially decreased due to oxygen enrichment for all fuels. Ignition Delay was found to 81
decline at higher oxygen levels which in combination with injection timing will maintain 82
NOx levels within acceptable levels while large benefits in PM and smoke reduction can be 83
achieved. Donahue and Foster [8] conducted oxygen enrichment tests on a Cummins N 14 84
single cylinder diesel engine with oxygen rates of 21, 22 and 23 %. They found an increase to 85
22 % oxygen showed drastic reductions of particulate matter emissions while only 86
moderately increasing NOx, the exact magnitude depending on injection timing. A further 87
increase to 23 % only showed marginal decrease in PM but large unfavourable increase in 88
pressure for all load conditions. The increase in NOx with higher O2rates was attributed to 90
increased temperatures and the PM reduction to increased fuel pyrolysis and soot oxidation. 91
Rakopoulos et al [10] did an extensive literature review on previous research of the subject. 92
Their conclusions are consistent with above mentioned findings; the shorter ignition delay 93
was attributed to the accelerated pre-ignition reactions. Poola and Sekar [14] investigated the 94
impact of oxygen enrichment of combustion air on the operational and emissions properties 95
using a locomotive research diesel engine (two cylinder, EMD 567B). They found that the 96
NOx could be reduced simultaneously along with PM emissions when the concentration of 97
intake air oxygen, fuelling rate, and injection timing were optimized. Their results showed 98
that particulates were reduced by approximately 60% and NOx emissions were reduced by 99
15–20% with the optimal operating strategy. Higher gross power, lower peak cylinder 100
pressures, and lower brake specific fuel consumption were also observed. A recent study by 101
Perez and Boehman [15] studied the effect of air inlet oxygen enrichment on engine 102
performance at simulated high altitude conditions using a small aero diesel engine. One of 103
their key findings was that the oxygen enrichment decreased brake-specific fuel consumption 104
(BSFC) by 40% due to increased fuel conversion efficiency. The emission was not measured 105
as it was not the objectives of the research. Table 1 below summarized the key elements of 106
major publications related to experimental results of oxygen enrichment of air intake for 107
diesel engines. Besides the experimental work, there are some theoretical researches on air 108
intake oxygen enrichment. Zannis et al [16, 17] modelled the effect of air intake oxygen 109
enrichment method on combustion and emissions and found similar results such as the 110
shorter ignition delay, higher in-cylinder pressure, lower PM and higher NOx emissions with 111
oxygen enrichment. 112
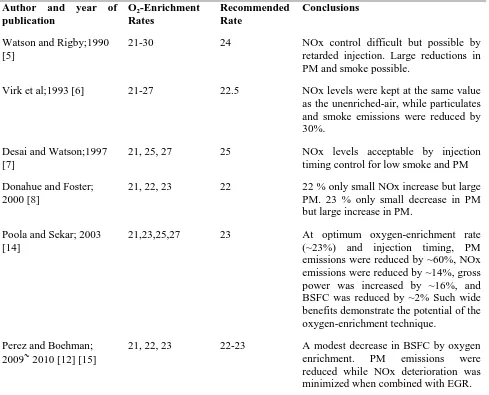
Table 1. Review of previous key O2enrichment in air intake experiments on diesels 114
Author and year of publication
O2-Enrichment
Rates
Recommended Rate
Conclusions
Watson and Rigby;1990 [5]
21-30 24 NOx control difficult but possible by
retarded injection. Large reductions in PM and smoke possible.
Virk et al;1993 [6] 21-27 22.5 NOx levels were kept at the same value
as the unenriched-air, while particulates and smoke emissions were reduced by 30%.
Desai and Watson;1997 [7]
21, 25, 27 25 NOx levels acceptable by injection
timing control for low smoke and PM
Donahue and Foster; 2000 [8]
21, 22, 23 22 22 % only small NOx increase but large
PM. 23 % only small decrease in PM but large increase in PM.
Poola and Sekar; 2003 [14]
21,23,25,27 23 At optimum oxygen-enrichment rate
(~23%) and injection timing, PM
emissions were reduced by ~60%, NOx emissions were reduced by ~14%, gross power was increased by ~16%, and BSFC was reduced by ~2% Such wide benefits demonstrate the potential of the oxygen-enrichment technique.
Perez and Boehman;
2009~2010 [12] [15]
21, 22, 23 22-23 A modest decrease in BSFC by oxygen
enrichment. PM emissions were
reduced while NOx deterioration was minimized when combined with EGR.
115
2. EXPERIMENTAL
116
2.1 Test engine and fuels
117
A Perkins Phaser 180Ti 6 cylinder, 6 L (0.006 m3), DI (Direct Injection), turbo-charged inter-118
cooled, heavy duty diesel engine was used, fitted with an oxidation catalyst. The 119
standards compliance. The engine was running at 47kW (50% of its maximum load at this 121
speed) and 157 rad s-1constant conditions. 122
Table 2. Engine specifications 123
Type Perkins Phaser
180Ti
Displacement (L) 6.0
Cylinder No. 6
Compression ratio 17.5 : 1
Maximum power rating 134kW
at 272 rad s-1
Aspiration Turbo-charged
and Inter-cooled
EGR No
Fuel injection Pump-line-nozzle
Injector hole diameter, (mm) 0.2
The number of holes 6
Injection timing,OBTDC 11
BMEP at 47kW & 157 rad s-1(KPa) 628
124
A food grade virgin Rapeseed Oil (RSO), Agri green extended life cooking oil and produced 125
by Agri Energy Food Service co, was used as the testing fuel. The oil was produced by deep 126
[image:8.595.68.262.708.753.2]degumming process and the key fuels properties were listed in table 3. 127
Table 3. Selected physical properties of the test fuel RSO 128
Properties Values
Free fatty acids (mass fraction %) max
Protein (mass fraction %)
Insoluble impurities
(mass fraction %) max
Density @15oC (kg m-3)
/1.5 red
0.15
0
0
922
Kinematic viscosity
@40oC (mm2s-1)
35.61
Flash point (oC) 320
Oxygen (mass fraction %) 17.5
Calorific value (MJ kg-1) 39
129
2.3 Oxygen enrichment layout
130
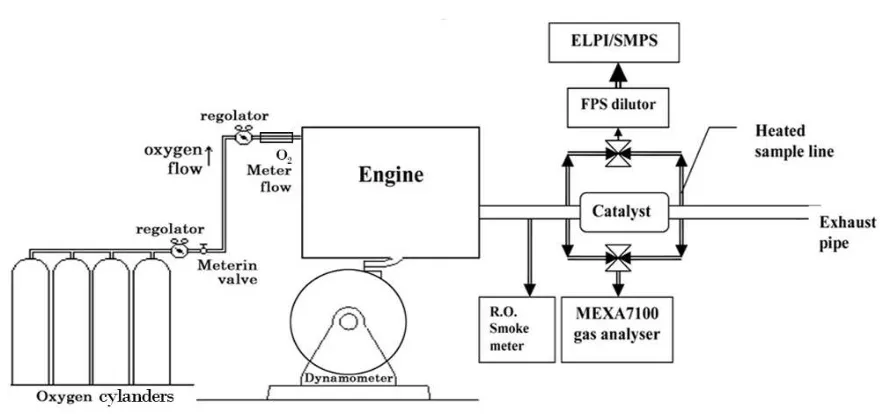
The oxygen was supplied by four 46.6 L (0.0466 m3) capacity cylinders, passing through a 131
pressure regulator and a volumetric flow meter and transported to a valve. The oxygen was 132
then passed through a mass flow meter with an accuracy of 1%, which was connected to a 133
laptop for the control and measurement of oxygen flow rate. The influence of surrounding 134
temperatures on the oxygen flow rate was minimal as all the pipes and meters were housed 135
indoors and the temperature was maintained at 15±2°C. The metered oxygen was injected 136
into the air stream by inserting a probe downstream of the intercooler and one meter upstream 137
of air inlet manifold of the engine. A dedicated sample probe was inserted in the engine air 138
inlet manifold and connected to a Servomex paramagnetic oxygen analyser to measure the 139
oxygen concentration after mixing with an accuracy of ±0.1% of oxygen concentration. The 140
readings were used to monitor oxygen level and adjust oxygen flow rate if necessary. Figure 141
143
Figure 1. Schematic view of oxygen enrichment test set up 144
2.4 In-cylinder pressure and crank angle measurement
145
One of the cylinders on the test engine was fitted with a piezo-electric pressure transducer for 146
measuring in-cylinder pressure, which was connected to a data acquisition system that could 147
take around 100, 000 pressure readings per second. The Top Dead Centre (TDC) position was 148
measured using an optical sensor and indentation on the flywheel at TDC. The time based 149
pressure results were then converted into P-θ (pressure-crank angle) diagram. At least 50
150
cycles were converted for each condition. An average P-θ diagram was then obtained. The
151
heat release rate was thus calculated. The ignition delay and premixed combustion duration 152
(PCD) was then determined. The variations were determined and indicated by the error bars 153
(absolute error) in the figure 7. This method has also been used by other researchers [18-20] 154
and proved to be reliable. The ignition delay was defined as from the beginning of fuel 155
injection at 11 ° BTDC (Before Top Dead Centre) until the start of premixed combustion. 156
The PCD was defined between the end of ignition delay and the start of stratified combustion. 157
2.5 Emissions sampling systems
159
The particulate and gaseous exhaust samples were taken at 1.3 m from the turbocharger 160
upstream of the catalyst and at 2.05 m downstream of the catalyst respectively, as shown in 161
figure 1. A constant temperature sampling (CTS) technique was used with a 6.3 mm (0.0063 162
m) stainless steel pipe inserted with a curved bend onto the centre line of the exhaust pipe. 163
The sample for particulate collection was passed through a heated sample line to a heated 164
filter in an oven at 50°C. The SAE smoke meter (R.O.smoke meter manufactured by Richard 165
Oliver Ltd.) was used, which was modified to include separate temperature control of the 166
filter paper block and the oven. There was sufficient sample residence in the oven to cool the 167
sample to 50°C. Whatman 0.055 m diameter GF/F glass fibre filters were used with a 0.029 168
m spot size. The sampling flow rate was kept at 5 L min-1and at least 0.001 g of particulate 169
was collected, weighed to 0.000010 g resolutions and hence the minimum accuracy of the 170
filter weights was ±2%. 171
Gas samples were taken from the same sample position in the exhaust as the particulates and 172
transported via a 6 m long 6.3 mm diameter electrically heated Teflon tube to a Horiba 173
MEXA-7100D on-line gas analysis system. The sample line temperature was kept at 190°C. 174
The exhaust gas analysis system contained a heated FID (Flame Ionization Detector) analyzer 175
for total hydrocarbon analysis, a Chemiluminescence analyzer for NO and NO2analysis, and 176
two NDIR (Non-Dispersive Infrared) analyzers for CO and CO2analysis. The air/fuel ratio 177
was calculated from the gas analysis results based on the carbon balance principle, taking into 178
account the oxygen content of the biofuels. This was used to convert the measured emissions 179
data from volumetric to mass emissions. The exhaust gas samples were measured every 5 180
3. RESULTS AND DISCUSSION
183
3. 1 Fuel viscosity
184
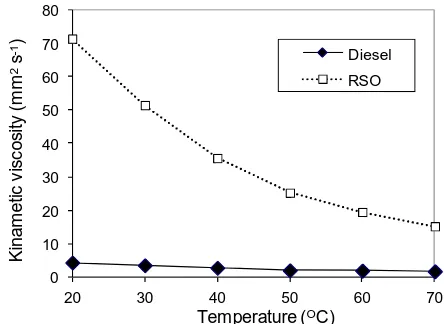
One of the major problems for using RSO in diesel engines is its much high viscosity 185
compared to diesel fuel. The kinematic viscosity of the RSO was measured as a function of 186
temperature along with the standard diesel fuel as shown in figure 2. The RSO had a much 187
higher viscosity than the diesel fuel and its viscosity was much more variable with 188
temperature. It was observed during the experiment that the temperature of the RSO was 189
raised from room temperature in the fuel tank to ~55oC before entering the fuel injector due 190
to the pumping heat and the heat from the engine block. However, the difference in viscosity 191
between the RSO and diesel at the fuel injection point was still significant. The high viscosity 192
of the RSO would deteriorate the fuel spray and atomization and affect mixing of fuel with 193
air and therefore adversely affect combustion and emissions [21]. The cone angle of fuel 194
spray decreases, and the size and penetration of fuel droplets increase as the viscosity of fuels 195
increases. This could cause direct contact of fuels with the combustion chamber wall, the 196
piston surface and rings, resulting in carbon deposits formation. The high viscosity could 197
also lead to higher pressure accumulations in the fuel injectors and fuel lines and cause early 198
fuel injections. Another adverse effect of the high viscosity of the RSO is the dilution of the 199
201
Figure 2. Fuels kinematic viscosity as a function of temperature 202
3.2 Combustion parameters - ignition delay, premixed combustion, peak in-cylinder
203
pressure and temperature, heat release and indicated efficiency
204
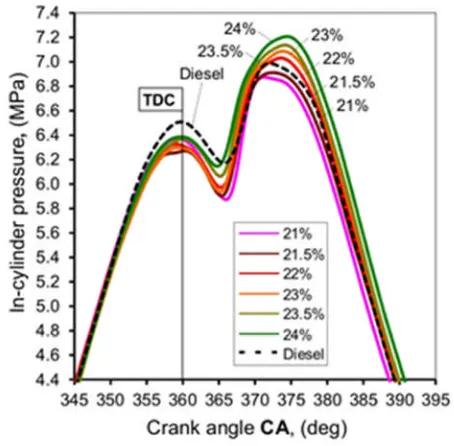
Figure 3 shows the pressure-crank angle (p-θ) diagram of the RSO at four different oxygen
205
enrichment rates/levels. The fuel was injected at 11oBTDC. The ignition occurred at 206
approximately 5oATDC. The results show a clear trend towards shorter ignition delays as the 207
oxygen rate increased. The peak pressure was increased from ~6.8 MPa to 7.2 MPa, ~6% 208
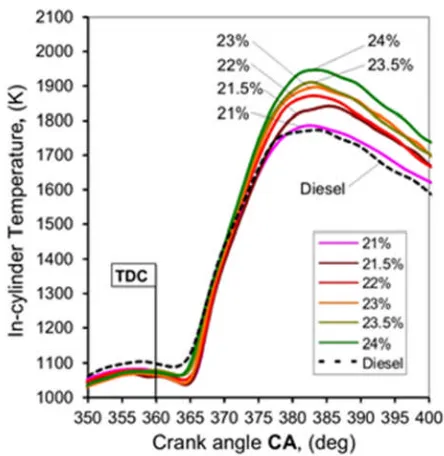
increase, as the oxygen rate increased from 21% to 24%. Figure 4 shows computed in-209
cylinder gas temperatures for different oxygen rates using the equation of state for ideal gas. 210
Obviously, this was the mean gas temperatures inside the cylinder. Though the emissions in 211
diesel engine combustion are dominated by local temperature but the mean in-cylinder 212
temperature is strongly connected with the local temperature in the IC engines. The peak 213
temperature was increased from ~1780 to ~1950 K when the oxygen rate was increased from 214
21% to 24%, about 9% increase. Compared to diesel, the RSO showed the lower in-cylinder 215
pressure at the TDC. This could be due to two reasons. The first possible reason is that the 216
typical value of the specific heat capacity of rape seed oil is 1.91 kJ kg-1K-1while diesel is 1.8 217
kJ kg-1K-1. The higher specific heat of RSO leads to more heat absorption and heat transfer 218 0 10 20 30 40 50 60 70 80
20 30 40 50 60 70
K in a m e tic v is c o s it y (m m 2s -1)
Temperature (OC)
from hot air to the RSO. The second possible reason is due to the advance of fuel injection. 219
Several researches have reported an inadvertent advance in fuel-injection timing using 220
biodiesel. It is caused by a higher bulk modulus comparing to diesel fuel [22-24]. The second 221
peak of in-cylinder pressure is higher for diesel fuel (compared to 21% oxygen RSO) because 222
the ignition delay of RSO is longer (fuel injection and evaporation of RSO takes more time) 223
than diesel. The higher pressure by oxygen enrichment for the RSO at around 370~375o 224
crank angle showed more intensive diffusion combustion, reflected by the higher peak in-225
cylinder temperature. Figure 5 shows the peak in-cylinder temperature as a function of 226
oxygen enrichment rate for the RSO. A good linear correlation is observed. 227
[image:14.595.71.298.335.558.2]228
Figure 3. In-cylinder pressure variation as a function of crank angle (CA) for different 229
231
Figure 4. In-cylinder temperature variation as a function of crank angle (CA) for different 232
oxygen rates 233
[image:15.595.76.300.400.633.2]234
Figure 5. In-cylinder peak temperature as a function of oxygen rate 235
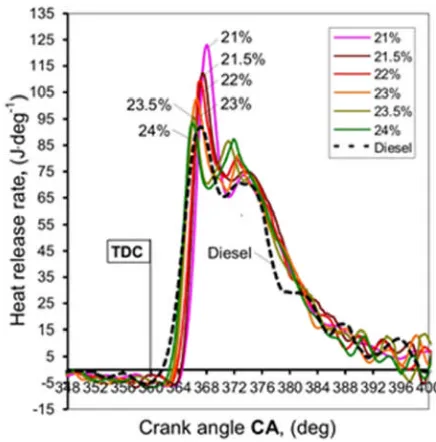
Figure 6 shows the heat release rate for different oxygen rates. The negative values before 236
1
. The results show that the peak heat release rate was reduced as the oxygen rate increased. 238
This was due to that the shorter ignition delay at the higher oxygen rates reduced the fractions 239
of fuels burned in the premixed combustion phase. In contrast to the reduction of premixed 240
combustion phase, the diffusion combustion phase was extended at the higher oxygen rates, 241
along with a higher diffusion peak heat release (the second heat release peak) as shown in 242
figure 6. It was the higher heat release rate in the diffusion phase that caused higher mean in-243
cylinder peak temperatures in figure 4, which then resulted in higher NOx emissions. 244
[image:16.595.73.291.288.509.2]245
Figure 6. Heat release traces for different oxygen rates 246
247
The trend of ignition delay and PCD was plotted against the oxygen rates with error bars as 248
shown in figure 7. The error bars indicated the absolute error of the measurements. Both the 249
ignition delay and PCD show a significant decrease with increasing oxygen rates. The 250
reduction of the ignition delay was 1.7 ° at 24 % oxygen compared to oxygen level of 21%. 251
and thus higher flame temperatures and consequently higher NOx. The oxygen enrichment 253
caused the air fuel mixture during the PCD to be leaner, supporting higher NOx formation 254
through higher local temperatures in the PCD and, hence, in the NOx-forming diffusion 255
flame. The CO and hydrocarbon formation was reduced as a result of higher in-cylinder 256
temperatures and the air fuel ratio being leaner and further away from stoichiometric with the 257
increased oxygen rate. The additional oxygen could also result in late cycle oxidation of CO 258
and hydrocarbons further reducing these emissions. The ignition delay was gradually reduced 259
because the air fuel mixture will ignite at a lower temperature with more oxygen present. 260
Compared to diesel’s ignition delay with the RSO without oxygen enrichment in figure 7, it 261
shows that the RSO had approximately 20% longer ignition delay than the diesel. This is 262
related to a lower cetane number of the RSO (~20% lower). Another possible reason is due to 263
the slower evaporation of the RSO. The results in figure 7 also show that the diesel had a 264
longer premixed combustion phase. This is due to that the amount of diesel injected during 265
the ignition delay period was greater than the viscous RSO. In other words, the low cetane 266
number of the RSO extended its ignition delay and the high viscosity of the RSO shortened 267
Figure 7. Changes in ID and PCD for different oxygen rates 270
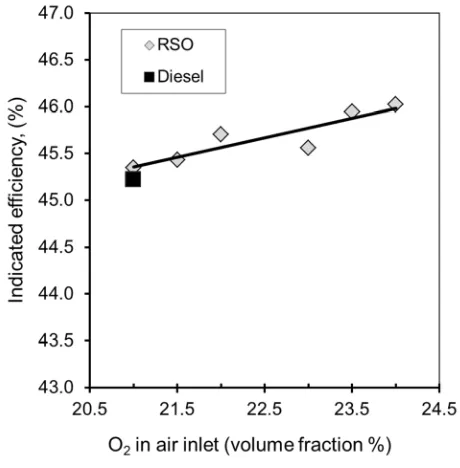
Figure 8 shows the indicated engine efficiency as a function of oxygen rate. As expected, 271
oxygen enrichment increased indicated engine efficiency. The maximum improvement of 272
indicated efficiency is about 0.6% at 24% oxygen rate, which could be translated to about 1.2 273
% fuel saving due to improved combustion efficiency by oxygen enrichment. 274
[image:18.595.71.301.240.474.2]275
Figure 8. Indicated efficiency as a function of oxygen rate 276
277
3.3 Exhaust emissions
278
3.3.1. Particulate emissions
279
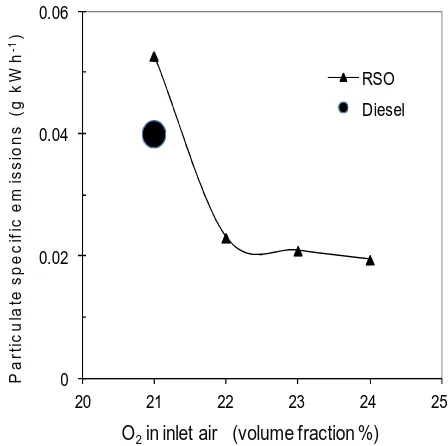
The particulate matter (PM) was collected on the filter papers and mass emissions were 280
determined. Figure 9 shows the particulate specific emissions (g kWh-1) as a function of 281
oxygen rate. The PM specific emissions from the standard diesel were also plotted as a 282
increased by ~30% due to its high viscosity and low volatility. The oxygen enrichment could 284
effectively reduce the PM emissions from RSO. In fact, PM emissions from oxygen 285
enrichment rate of 22% onwards were significantly lower than that of diesel fuel. The 286
reductions in the PM mass of the RSO were the most significant between 21% and 22% of 287
oxygen levels and became much slower afterwards. The higher in-cylinder gas temperature 288
and extra oxygen helped the oxidation of the soot, resulting in less PM emissions. The EU 289
emission regulation for EURO 2 heavy duty diesel after 1998 production is 0.15 g kWh-1, 290
which is based on ECE R-49 test cycle with 13 steady state modes. The direct comparison of 291
this research results with the EU regulation is not appropriate but the results in figure 9 could 292
give an indication of PM emission levels relative to the regulation on a particular mode, 293
i.e.50% of load at low speed mode, which was the operation condition of the test in this 294
research. 295
[image:19.595.74.298.419.642.2]296
Figure 9. PM specific emissions as a function of oxygen rate 297 298 0 0.02 0.04 0.06
20 21 22 23 24 25
P a rt ic u la te s p e c if ic e m is s io n s (g k W h -1)
O2in inlet air (volume fraction %)
RSO
3.3.2. Nitrogen oxides (NOx) emissions
299
The EU NOx emission standard for this type of engine is 7 g kWh-1based on ECE R-49 300
cycle. The condition the engine was tested represented one of the ECE R-49 mode, 50% of 301
maximum power at low engine speed. The NOx level (6 g kWh-1) from the diesel fuel was 302
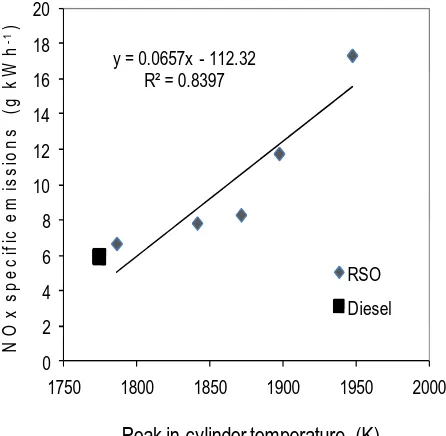
already close to the standard. Figures 10 and 11 show the specific NOx emissions as a 303
function of oxygen rate and peak in-cylinder temperature respectively. As expected, the NOx 304
emissions increased significantly as the oxygen enrichment rate rose due to three major NOx 305
formation contributors: the higher flame temperature, the higher local oxygen concentration 306
and the longer diffusion combustion phase. A good linear correlation between NOx emissions 307
and oxygen rate was observed. The NOx emissions were almost trebled to 17 g kWh-1at the 308
highest oxygen rate (24%). The adverse effect on the NOx by oxygen enrichment could be 309
minimised or even eliminated by changing fuel injection strategy - late fuel injection and 310
adjusting fuel injection rate, as illustrated by Poola and Sekar [14]. The NOx could also be 311
reduced by the use of EGR. Essentially, EGR and oxygen enrichment in intake air are two 312
opposite methods serving two different purposes. The former is for NOx reduction while the 313
latter is for PM reduction. A common practice is the combination of EGR with the other 314
oxygen enrichment methods such as oxygenated fuels. However, these are out of the scope of 315
this research. The NOx could also be treated with exhaust aftertreatment technologies such as 316
SCR (Selective Catalytic Reduction) using urea. But a cost/benefit analysis is needed to 317
assess the benefit of particulate reduction and penalty of NOx increase and associated cost of 318
320
Figure 10. NOx specific emissions as a function of oxygen rate 321
322
Figure 11. NOx specific emissions as a function of peak in-cylinder temperature 323
324
3.3.3. CO and THC emissions
325 0 2 4 6 8 10 12 14 16 18 20
20 21 22 23 24 25
N O x s p e c if ic e m is s io n s (g k W h -1 )
O2in inlet air (volume fraction %)
RSO
Diesel
y = 0.0657x - 112.32 R² = 0.8397
0 2 4 6 8 10 12 14 16 18 20
1750 1800 1850 1900 1950 2000
N O x s p e c if ic e m is s io n s (g k W h -1 )
Peak in-cylinder temperature (K) RSO
[image:21.595.76.299.375.593.2]The total hydrocarbon (THC) and CO specific emissions are presented in figure 12 as a 326
function of oxygen rate, along with the reference data of diesel results. Both the THC and CO 327
emissions are clearly showing strong tendencies of reductions as the oxygen enrichment 328
increased due to the oxidation effect taking place with additional oxygen. By comparison of 329
CO emissions between the diesel and the RSO at 21% oxygen level, it was suggested that the 330
poor atomization and mixing of the RSO occurred, indicated by much higher CO emissions 331
from the RSO. Surprisingly, there was no deterioration of hydrocarbon emissions from the 332
RSO compared to diesel. This could be attributed to the fuel born oxygen in the RSO assisted 333
the oxidation of the fuel. 334
[image:22.595.72.301.334.566.2]335
Figure 12. Specific emissions of THC and CO as a function of oxygen rate 336
337
3.4 Normalised emissions.
338
The PM and gaseous specific emissions were normalised to the values at oxygen 339
show the relative changes of emissions as a function of oxygen enrichment rate. The PM had 341
a large decrease at oxygen concentration 22%, a reduction of ~60% compared to no oxygen 342
enrichment. The reductions were much slower afterwards to an almost flat level. 343
[image:23.595.76.304.169.394.2]344
Figure 13. Normalised particulate specific emissions as a function of oxygen rate 345
The normalised NOx specific emissions in figure 14 demonstrated a very good positive linear 346
correlation with oxygen enrichment rate. The NOx emissions were increased by 150% at 347
oxygen concentration of 24%, an average increase of ~50% for every 1% of increment of 348
350
Figure 14. Normalised NOx specific emissions as a function of oxygen rate 351
Both the THC and CO specific emissions showed negative correlations with oxygen 352
enrichment rate. The CO emissions showed a better linear correlation than the THC 353
emissions. The CO and THC emissions were reduced by approximately 20% and 15% per 354
1% oxygen enrichment rate respectively. 355
356
[image:24.595.74.291.499.729.2]4. CONCLUSION
358
Direct use of pure SVO as a fuel in diesel engines without transesterification can offer greater 359
CO2savings and lower cost compared to conventional biodiesels (FAME). However, high 360
viscosity, low volatility of SVOs could lead to deteriorated combustion and emissions. The 361
oxygen enrichment in the air inlet of the engine method as a way to improve the SVO’s 362
combustion so as to reduce emissions was investigated in this work. The air inlet oxygen 363
levels tested were from 21% (no enrichment) to 24%. The results show: 364
1. The oxygen enrichment in the engine air inlet resulted in the shorter ignition delay and 365
premixed combustion duration and longer diffusion combustion phase. The shorter ignition 366
delay reduced the peak heat release rate at the premixed combustion phase but increased the 367
peak heat release rate at the diffusion combustion phase. Overall the in-cylinder peak 368
pressure and temperature were increased by 6% and 9% respectively when the oxygen rate 369
was increased from 21% to 24%. This resulted in an improvement in engine efficiency 370
measured by indicated efficiency. 371
2. Without oxygen enrichment, the RSO produced ~30% higher particulate emissions than 372
the diesel at the same engine operating condition. However, the particulate emissions could 373
be reduced to below the diesel level with oxygen enrichment rate of 22%. The reductions in 374
particulate emissions were not linear with the oxygen enrichment rate. There was a large 375
reduction in particulate emissions (~60%) between 21% (no enrichment) and 22% of oxygen 376
level. The reductions were in a much less scale with the further oxygen enrichment. 377
3. NOx emissions showed a good positive linear correlation with oxygen enrichment rates 378
and were increased on average by 50% for every 1% of oxygen enrichment rate. The high in-379
4. Without oxygen enrichment, the significantly higher CO emissions of the RSO, compared 381
to diesel, indicated a poor atomisation and mixing of the RSO with air. The oxygen 382
enrichment could reduce the CO emissions to a compatible level to diesel. The fuel born 383
oxygen in the RSO helped the RSO to produce similar levels of hydrocarbon emissions to 384
diesel. The oxygen enrichment overall reduced engine out CO and THC emissions. 385
5. The optimised oxygen enrichment rate should be 21~22%, where a significant reduction in 386
particulate can be achieved with the lowest increase in NOx emissions. 387
6. The findings from this work demonstrated that adverse effects (deteriorated combustion 388
and high emissions) of direct use of SVO in diesel engines can be solved and overcome by 389
the oxygen enrichment method. This enables industrial diesel applications such as electric 390
power generations to use the pure SVO directly to achieve greater CO2reductions and 391
reduced fuel cost compared to biodiesel. 392
NOTES
393
The authors declare no competing financial interest. 394
ACKNOWLEDGMENTS
395
We would like to thank the UK EPSRC for a research studentship to Mr. Seyed Ali Hadavi in 396
support of this work. Thanks also go to Bob Boreham for his technical support and expertise. 397
Dr Grzegorz Przybyla is supported by the EU FP7 RECENT project (Grant 245819). 398
NOMENCLATURE
399
ATDC: After Top Dead Centre 400
BTDC: Before Top Dead Centre 402
CO: Carbon Monoxide 403
DI: Direct Injection 404
EGR: Exhaust Gas Recirculation 405
FAME (Fatty Acid Methyl Ester) 406
H.S.U.: Hartridge Smoke Unit 407
NOx: Nitrogen Oxides 408
PCD: Premixed Combustion Duration 409
PM: Particulate Matter 410
RSO: Rape Seed Oil 411
SCR: Selective Catalytic Reduction 412
SVO: Straight Vegetable oil 413
TDC: Top Dead Centre 414
THC: Total Hydrocarbon 415
416
5. REFERENCES
417
[2] Babu AK, Devaradjane G. Vegetable oils and their derivatives as fuels for CI engines: an 420
overview. SAE International. 421
[3] Lance DL, Andersson JD. Emissions Performance of Pure Vegetable Oil in Two European Light 422
Duty Vehicles. SAE transactions Journal of fuels and lubricants 2004;113(4): 904_923.
423
[4] Yang H-H, Chien S-M, Loa M-Y, Lanb JC-W, Luc W-C, Kud Y-Y. Effects of biodiesel on 424
emissions of regulated air pollutants and polycyclic aromatic hydrocarbons under engine durability 425
testing. Atmos Environ 2007;41(34): 7232_40.
426
[5] Watson HC, Gaynor E, Rigby GR. Oxygen enrichment - a method for reduced environmental 427
impact and improved economics. Inst Mech Eng Seminar, Fuels for automotive and industrial diesel 428
engines; London; November 1990. 429
[6] Virk K, Kokturk U, Bartels C. Effects of Oxygen-Enriched Air on Diesel Engine Exhaust 430
Emissions and Engine Performance. SAE International; 1993. 431
[7] Desai RR, Watson HC. Effect of Fuel Composition on DI Diesel Engine Particulates and Sutdy 432
of Oxygen-Enriched Diesel NO Formation. SAE International Congress & Exposition; February 24-27; 433
Detroit, Michigan, USA SAE International; 1997. 434
[8] Donahue RJ, Foster DE. Effects of Oxygen Enhancement on the Emissions from a DI Diesel via 435
Manipulation of Fuels and Combustion Chamber Gas Composition. In–Cylinder Diesel Particulate and 436
NOx Control 2000 (SP–1508); Detroit, Michigan SAE International; 2000. 437
[9] Mather DK, Foster DE, Poola RB, Longman DE, Chanda A, Vachon TJ. Modeling the Effects of 438
Late Cycle OxygenEnrichment on Diesel Engine Combustion and Emissions. SAE 2002 World 439
Congress; March 4-7; Detroit, Michigan SAE International; 2002. 440
[10] Rakopoulos CD, Hountalas DT, Zannis TC. Operational and Environmental Evaluation of 441
Diesel Engines Burning Oxygen-Enriched Intake Air or Oxygen-Enriched Fuels: A Review. Powertrain 442
& Fluid Systems Conference & Exhibition; October 25-28; Tampa, Florida USA SAE International; 443
2004. 444
[11] Rigby GR, Watson HC. Application of membrane gas separation to oxygen enrichment of 445
diesel engines. Journal of Membrane Science 1994;87(1-2): 159_69.
446
[12] Perez PL, Boehman AL. Experimental study of oxygen-enriched diesel combustion using 447
simulated exhaust gas recirculation. Journal of Engineering for Gas Turbines and Power 2009;131(4): 448
042802_11.
449
[13] Song J, Zello V, Boehman AL, Waller FJ. Comparison of the impact of intake oxygen 450
enrichment and fuel oxygenation on diesel dombustion and emissions. Energy & Fuels 2004;18(5): 451
1282_90.
452
[14] Poola RB, Sekar RR, Systems E, Electro-Motive Div. GMC. Reduction of NO{sub x} and 453
particulate emissions by using oxygen-enriched combustion air in a locomotive diesel engine. Journal 454
of Engineering for Gas Turbines and Power 2003;125(2): 524_33.
455
[15] Perez PL, Boehman AL. Performance of a single-cylinder diesel engine using oxygen-enriched 456
intake air at simulated high-altitude conditions. Aerospace Science and Technology 2010;14(2): 457
83_94.
458
[16] Zannis TC, Hountalas DT, Yfantis EA, Papagiannakis RG, Levendis YA. Intake-air Oxygen-459
enrichment of Diesel Engines as a Power Enhancement method and Implications on Pollutant 460
Emissions. In: ASME Conference Proceedings. ASME 2009 Internal Combustion Engine Division Fall 461
Technical Conference; September 27-30; Lucerne, Switzerland.Three Park Avenue, New York, NY 462
10016-5990 USA: Amer Soc Mechanical Engineers; 2009. pp. 295_308.
463
[17] Zannis TC, Hountalas DT, Yfantis EA, Papagiannakis RG, Asme. Thermodynamic Analysis of 464
the Effects of Fuel-side and Air-side Oxygen Addition on Diesel Engine Combustion Characteristics 465
and Polluant Formation. In: ASME Conference Proceedings. ASME 2009 Internal Combustion Engine 466
Division Fall Technical Conference; September 27_30; Lucerne, Switzerland.Three Park Avenue, New
467
York, NY 10016-5990 USA: Amer Soc Mechanical Engineers; 2009. pp. 471_480.
468
[18] Ceviz MA, Cavusoglu B, Kaya F, Öner IV. Determination of cycle number for real in-cylinder 469
pressure cycle analysis in internal combustion engines. Energy 2011;36(5): 2465_72.
[19] Chlopek Z, Stasiak P. The analysis and unrepeatability of cylinder pressure signal in internal 471
combustion engines. Scientific Magazine 2005;120(1): 31_39.
472
[20] Polanowski S. The processing in cylinder diagrams with use of the moving approximating 473
objects. Scientific Magazine 2005;120(1): 40_49.
474
[21] Varatharajan K, Cheralathan M. Influence of fuel properties and composition on NOx 475
emissions from biodiesel powered diesel engines: A review. Renewable and Sustainable Energy 476
Reviews 2012;16(6): 3702_3710.
477
[22] Nabi MN, Shahadat MMZ, Rahman MS, Alam Beg MR. Behavior of Diesel Combustion and 478
Exhaust Emission with Neat Diesel Fuel and Diesel-Biodiesel Blends. Alternative and Oxygenated 479
Fuels, SP-1897; SAE International; 2004. 480
[23] Szybist J, Simmons J, Druckenmiller M, Al-Qurashi K, Boehman A, Scaroni A. Potential 481
Methods for NOx Reduction from Biodiesel. Advanced Powerplant Concepts 2003, SP-1806; SAE 482
International; 2003. 483
[24] Boehman A, Alam M, Song J, Acharya R, Szybist J, Zello V, Miller K. Fuel Formulation Effects 484
on Diesel Fuel Injection, Combustion,Emissions and Emission Control. 2003 Diesel Engine Emissions 485
Reduction Conference; August 24-28; Newport, Rhode Island, USA. The Office of Energy Efficiency 486
and Renewable Energy, U.S.Department of Energy; 2003. 487
488