promoting access to White Rose research papers
White Rose Research Online eprints@whiterose.ac.uk
Universities of Leeds, Sheffield and York
http://eprints.whiterose.ac.uk/
This is the author’s version of an article published in the International Journal of Hydrogen Energy
White Rose Research Online URL for this paper:
http://eprints.whiterose.ac.uk/id/eprint/75955
Published article:
Lea-Langton, A, Zin, RM, Dupont, V and Twigg, MV (2012) Biomass pyrolysis oils for hydrogen production using chemical looping reforming.International Journal of Hydrogen Energy, 37 (2). 2037 - 2043. ISSN 0360-3199
TITLE PAGE
Biomass pyrolysis oils for hydrogen production using
chemical looping reforming
Authors:
Amanda Lea-Langtona, Rohaya Md Zina, Valerie Dupont*a andMartyn V. Twiggb
a
Energy and Resources Research Institute, The University of Leeds, Clarendon Road, LS2 9JT, Leeds, United Kingdom
b
Johnson Matthey Plc, Orchard Laboratory, Orchard Road, Royston, SG8 5HE, UK
paper accepted for publication in International Journal of Hydrogen Energy
Full reference:
Biomass pyrolysis oils for hydrogen production using
chemical looping reforming
Amanda Lea-Langtona, Rohaya Md Zina, Valerie Dupont*a andMartyn V. Twiggb
a
Energy and Resources Research Institute, The University of Leeds, Clarendon Road, LS2 9JT, Leeds, United Kingdom
b
Johnson Matthey Plc, Orchard Laboratory, Orchard Road, Royston, SG8 5HE, UK
Abstract
This study considers the feasibility of using highly oxygenated and volatile pyrolysis oils from biomass wastes as sustainable liquid fuels for conversion to a hydrogen-rich syngas using the chemical looping reforming process in a packed bed. Pine oil and palm empty fruit bunches oil- ‘EFB’- were investigated with a Ni/Al2O3 catalyst
doubling as oxygen transfer material (OTM). The effect of molar steam to carbon ratio (S/C) and weight hourly space velocity were investigated at 600 °C and atmospheric pressure on the fuel and steam conversion, the H2 yield and the H- and
C-products distribution. With a downward fuel feed configuration and using a H2
-reduced catalyst, maximum averaged fuel conversions of ~97% for pine oil and 89% for EFB oil were achieved at S/C ratios of 2.3 and 2.6 respectively (on a water-free oil basis). This produced H2 with a yield efficiency of approximately 60 % for pine oil
and 80% for EFB oil notwithstanding equilibrium limitations, and with little CH4
by-product. Both oils exhibited very similar outputs with varying S/C. Upon a short number of cycles, i.e. starting from an oil-reduced catalyst, the fuel conversion dropped slightly but the steam conversion was constant, resulting in a slow decrease in H2 yield. Despite their high level of oxygen content, the pyrolysis oils were shown
to maintain close to 90% reduction of the oxidised catalyst upon repeated cycles, but the rate of reduction decreased with cycling.
Keywords: Hydrogen, chemical looping, reforming, bio oils, nickel, reduction
1. Introduction
The development of a hydrogen economy is seen by many as important to secure future energy supply, however most hydrogen currently produced is from fossil fuel sources. This is driving research towards renewable energy sources such as the use of biomass. Oils derived from the fast pyrolysis of biomass (bio-oils) have limitations as fuels due to their low heating value and high oxygen content. Any carbonaceous fuel is potentially suitable for hydrogen production via the water gas shift reaction, its hydrogen content increases the H2 yield via steam reforming of the fuel. A small
number of studies have investigated H2 production via pyrolysis of biomass followed
by conventional steam reforming [1, 2]. However issues of fuel delivery due to thermal decomposition and coking have been reported.
Kechagiopoulos et al [1] used a bio-oil aqueous fraction for reforming over Ni/Olivine catalysts. Blockages due to fuel instability and coking were overcome by reactor modification and co-feed of oxygen gas. At catalysts temperature of 850 °C, a H2 yield of over 43% was achieved with H2 gas selectivity of 73% with respect to
hydrogen products. Czernik et al [2] using a fluidised bed system at 850 °C, reported successful reforming of a whole bio-oil with yield of 70-80% of the stoichiometric potential. However, it was seen that towards the end of the experiments, an increasing amount of methane was produced in almost equal quantities as the hydrogen.
This study involves the reforming of whole bio-oil using a chemical looping steam reforming (CLR) process, which differs from the conventional process by cycling between fuel-steam feed and oxidation by air steps in order to achieve autothermality without reliance on the oxygen feed for partial oxidation. CLR operates on the principle that an oxygen transfer material (OTM) can act as a steam reforming catalyst when in its reduced state. Carbonaceous deposits that form during the fuel feed cycle can oxidise during the air feed step, generating additional heat to that of the Ni oxidation reaction. This overcomes the issue of coking of the catalyst associated with bio-oils whilst also using the heat generated to support the steam reforming in the subsequent fuel feed cycle. It also allows the steam reforming reaction to be performed at a lower temperature than the conventional steam reforming process by the close coupling of the endothermic reforming reaction with the exothermic Ni and C oxidation. Lyon and Cole [3] have shown that H2 rich syngas can be produced
autothermally from methane and diesel fuel using a CLR system, also incorporating a calcium loop for CO2-sorption enhancement of the steam reforming. Previous work
by the authors has demonstrated high reactant conversions using fuels with Ni and Ca looping such as methane [4], vegetable oil [5], crude glycerol [6], and waste cooking oil [7]. A crucial requirement of the CLR process is that the fuel can reduce the OTM during the beginning of the fuel feed step to enable the steam reforming to start from cycle to cycle. A major focus of this initial study is to see whether highly oxygenated bio-oils can perform this reduction step and sustain steam reforming.
2. Material and methods
The EFB and pine pyrolysis oils were provided by BTG, Netherlands. These were filtered prior to the experimental runs to remove fibrous material, which could clog fuel delivery lines.
2.1.1. Elemental Analysis
Analysis of the CHN content of the oil was obtained using a Flash EA1112 Elemental Analyser by CE Instruments. The sample was loaded in a tin capsule and placed in the furnace and burned with oxygen. Helium was a carrier gas that brings the resulting combustion gases to the detection section, consisting of a chromatograph column and a thermal conductivity detector. The oxygen content was calculated by difference. The oil sample was digested in a microwave digester prior to placing it in a Perkin Elmer SCIEX Elan 900 ICP MS instrument for inorganic element determination.
2.1.2. Basic bio-oil properties
The properties analyzed for the bio-oil samples included pH, flash point, calorific value, water and ash content and thermal decomposition. A Corning S&M pH/ion meter 135 was used to determine pH. The flash point was determined using a Seta Flash Series 3 Plus Closed Cup Model 33000-0 in agreement with ASTM D1655. The analysis was repeated twice. The calorific value was measured using a Parr 6200 bomb calorimeter. The thermal decomposition characteristics of the oil were investigated by thermogravimetric analysis (TGA), which was performed on a Shimadzu TGA 50 with TA 60 data collection software. For ash content, Stanston Redcroft-TGH 1000 employ horizontal differential balance mechanism was used. The heating rate was 3 K min-1 from 298 K (25 °C) to 1173 K (900 °C) under N2 flow of
50 mL min-1. The holding time for N2 was 5 minutes at 1173 K prior to switching to
air with hold time of 15 minutes. Water content was obtained using a METLER Toledo V20 volumetric type of Karl Fischer titrator.
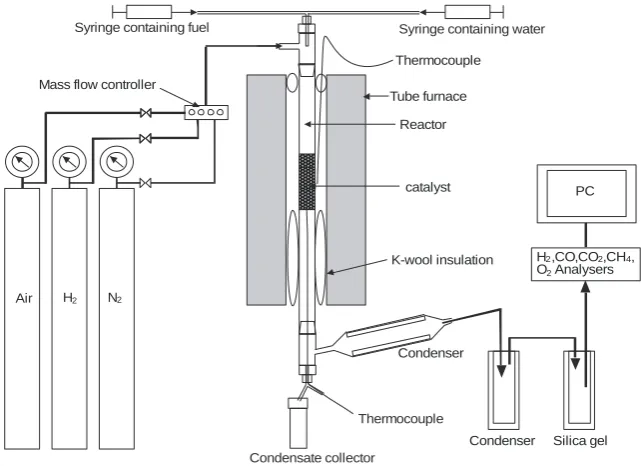
2.2. Reactor set-up
The experiments were conducted in a quartz bench-scale reactor. The set up used for this study is shown in Fig. 1. The rates of fuel and steam flows were controlled using syringe pumps (New Era Pump Systems). The gas flows were controlled using MKS mass flow controllers. The composition of the product gas was measured every 5 s using Advanced Optima analysers by ABB. Concentrations of CH4, CO and CO2
were measured using infrared absorption, H2 was measured by thermal conductivity
and O2 was measured using a paramagnetic analyser. The OTM catalyst used was 18
wt% NiO on Al2O3 provided by Johnson Matthey. The material was received in pellet
form and was broken and sieved to particle size range of 0.85-2 mm prior to use.
2.2.1. Test Procedures
The test was preceded by a catalyst activation period using a flow of 5 vol% hydrogen in nitrogen carrier gas at the process temperature (T) of 873 K (600 °C). After that the cycles comprised of the fuel/water feed using N2 as a carrier gas, followed by a N2
purge, completed by an oxidation step using air. Effectively, 5 cycles were equivalent to 10 reactive steps, not counting the potential reactions of the N2 purge. It should be
noted that in full-scale operation of the process, the N2 carrier gas and purge period
The reactions occurring during the fuel feed step are summarised below where R1 is ‘unmixed combustion’ i.e. the direct reduction of NiO by the fuel, R2 is catalytic steam reforming once Ni is sufficiently reduced and R3 is the water gas shift:
R1 CnHmOk + (2n+m/2-k)NiO→nCO2 + (m/2)H2O+(2n+m/2-k)Ni ∆H>0
R2 CnHmOk + (n-k)H2O→nCO+ (n+m/2-k)H2 ∆H>0
R3 CO+H2O ↔ CO2+H2 ∆H→<0
It can be seen that the steam reforming reaction is endothermic and so heat energy is required to maintain the required temperature.
The oxidation reactions occurring during the air feed step are as follows:
R4 C+O2→CO2 ∆H<0
R5 C+0.5O2→CO ∆H<0
R6 Ni + 0.5O2→NiO ∆H<0
The oxidation stage is exothermic and the heat produced can be used to support the subsequent fuel-feed step. The fuel and water fractional conversions, as well as the selectivity to the carbon-containing (‘SelC’) and hydrogen-containing products
(‘SelH’), and the hydrogen yield (in mol H2 per mol of C in the fuel), were calculated
from elemental balances using the dry gas composition. It is assumed that fuel conversions of less than 100 % based on the carbon balance would indicate the likelihood of coke formation.
3. Results and Discussion
3.1. Pyrolysis oils characterization
3.1.1. Maximum theoretical H2 yield from the pyrolysis oils
The pyrolysis oils characteristics are listed in Table 1.
It can be noted that both oils have low heating values compared to typical fuel oils, which would make them unsuitable as fuel oils. The oxygen content is high due to the presence of oxygenated compounds such as acids, alcohols, ketones, aldehydes and esters and also partly due to the high moisture content associated with these oils, which was measured at 32 wt% for the EFB oil, and 22 wt% for the pine oil by Karl Fischer titration. Using the elemental mass composition of the fuels and the water content of the oils, a ‘water-free’ molar composition was derived in the‘CnHmOkNj’
format. This yielded the values n=0.3178, m=0.3605, k=0.3132 and j=0.0085 for EFB water-free oil and n=0.3372, m=0.4440, k=0.2171 and j=0.0017 for water-free pine oil. The stoichiometry of the complete steam reforming and water gas shift reactions state that, at (2n+0.5m-k)/n, the maximum yield of hydrogen in mol per mol of carbon in the fuel, notwithstanding thermodynamic equilibrium limitations, was 1.57 for the EFB oil, and 2.0 for the pine -oil. It is common to report H2 yields on a fuel mass
3.1.2 Analysis of thermal decomposition behavior
The TGA results were analysed to enable kinetic modelling of the oil evaporation and decomposition characteristics as shown in Fig.2. An improved Coats and Redfern method was applied on the fractional mass loss-temperature curves between its extrema of mass loss under N2 flow, allowing the derivation of the kinetic parameters
and identification of best model type for the oils’ thermal degradation, following the theory of Urbanovici et al [8].
The mass loss conversion curve of the EFB oil lent itself to a modelling in two sections corresponding to conversion fractions below and above 0.6 respectively, corresponding to the temperature of 77 °C. The best model for both sections corresponded to the nth order reaction model. In the first section, the best fitting model was found for the order n of 1.82, the natural log of the pre-exponential factor ln A of 26.15, and the activation energy E of 85.3 kJ mol-1, obtained with a linear correlation coefficient of 0.980. The second section was fitted with n = 3.98, ln A=10.96 and E = 59.14 kJ mol-1, and was obtained with a linear correlation coefficient of 0.994. Given the excellent agreement between experimental and modelled conversions, the derived activation energies were interpreted as a combination of evaporation (low activation energy) and thermal decomposition (medium activation energy) of the very volatile components making up the mixture. The mass loss curve of EFB oil showed a residue of 8.3 wt% reached asymptotically at 800 °C, which left 2.45 wt% ash when burned in air at 900 °C.
The pine oil had a more awkward shape to fit, reflecting a more heterogeneous mixture. The shape of the conversion curve indicated a lower content in the lighter volatiles than the EFB oil, corresponding to conversions below 0.25 and temperatures below 57 °C. Because of the irregular shape of the curve, modelling the pine oil mass loss fraction in a single section was considered a good compromise between model simplicity and goodness of fit. The best fit corresponded also to the nth order reaction model, with n = 2.76, ln A = -0.165 and E = 22.4 kJ mol-1, achieved with a correlation coefficient of 0.987. One would expect a fast, short lived evaporation in the very first stage of the mass loss, both from the derived activation energy and the shape of the curve at temperatures below 57 °C. This would be followed by combined evaporation and thermal decomposition of slightly heavier components. Both oils had reached 95% of their mass loss conversion through evaporation and thermal decomposition below 436 °C. The residue from the pine oil was 14.1wt% reached asymptotically at 800 °C, and left 3.78 wt% ash after combustion in air at 900 °C.
3.2. Effect of reactor loading and molar steam to carbon ratio (S/C)
The reactor loading can be defined using the weight hourly space velocity (WHSV), which is the total input mass flow rate per unit mass of catalyst (reactor loading). The influence of WHSV was investigated for a single fuel cycle with pine bio-oil by varying the amount of catalyst used and maintaining the total input flow constant. For these experiments, the catalyst was pre-reduced under a 5 vol% H2/N2 flow as
described in section 2.2.1. The effects on the oil and water conversions, H2 yield and
products distribution are shown in Table 2. The results are reported for averages of outputs taken for a duration ‘t’ listed for each experiment, which averages 65 min over the three conditions, from readings taken every 5 s. It can be seen that the conversion of oil to CO, CO2 and CH4, as measured by elemental balance, was greater
oscillatory profile with time on stream for all the data. Oscillations in the profiles disappeared with smoothing using moving averages with a period of 60. The highest WHSV (lowest loading) resulted in a poor pine oil conversion as well as a decrease in product purity as evidenced by a higher selectivity to methane (14%). Each mol of CH4 would potentially become 4 mol of hydrogen via R2 and R3, and so a substantial
drop in H2 yield efficiency was seen in this case (to 0.54). All conditions produced
significant quantities of CO, most likely caused by conditions away from equilibrium since at around 600 °C, the ratio of CO to CO2 would be below 1 from the equilibrium
of the water gas shift. Future experimental modifications may be able to reduce the selectivity to CO in order to further enhance H2 yield by using in-situ CO2 sorption.
Based on the bio-oil conversion, the optimal WHSV tested for pine bio-oil is indicated at 2.5 h-1.
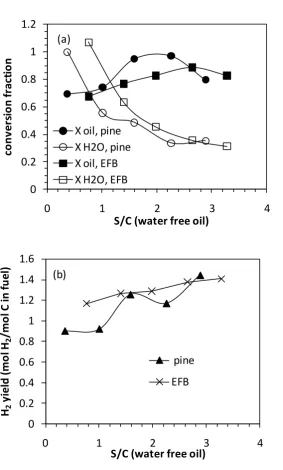
The effect of varying S/C ratios was assessed for both bio-oils on the main process outputs of reactants conversion and H2 yield are shown in Fig. 3. The low range of
S/C tested is due to the high moisture content associated with the bio-oils. It is remarkable that both bio-oils exhibited such similar S/C dependence on the main process outputs despite their different origins and composition. This could be explained by thermal decomposition products of the oils being similar when they reached the catalyst. For both bio-oils, the optimal bio-oil conversion was observed at S/C of 2.3 and 2.7 for pine and EFB oils respectively. It is worthy of noting that the lowest S/C reported (0.37 for pine and 0.76 for EFB) corresponded to experiments with no water co-reactant and the S/C arises from the natural water content in the oils. In the case of the pine oil water conversion (S/C 0.37), a value ca. 1.5 was calculated and subsequently artificially lowered to 1. This higher than 1 water conversion would have arisen in the case where products were not accounted for. Indeed since the conversion from the fuel to CO, CO2 and CH4 only totalled 70% for the pine S/C 0.37
experiment. The H2 yield increased with increasing S/C ratios as expected from Le
Chatelier’s principle. In commercial applications a lower S/C may be favoured due to lower water pumping and steam raising costs. It is interesting that the H2 yield from
the EFB oil was higher than that of pine oil, despite a lower theoretical maximum (1.57 vs. 2.0 mol H2/mol C in the fuel). The main reason for this is the lower
selectivity to methane found for the EFB oil.
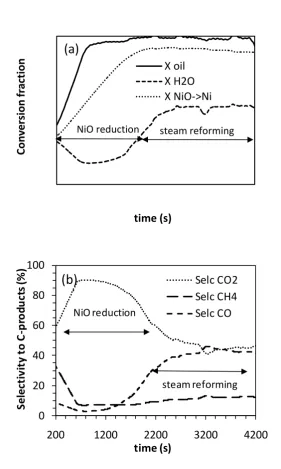
3.3. Cyclic behavior during chemical looping reforming (CLR)
CLR was conducted using a S/C of 2.3 for pine oil and 2.75 for EFB oil, a reactor bed temperature of 600 ºC and 6 g of the Ni-Al2O3 catalyst as the oxygen transfer
material. These conditions resulted in a WHSV of ca. 2.5 h-1 for both bio-oils. Analysis during the cycles coupled with elemental balances indicated that the highly oxygenated bio-oils were both able to initially reduce close to 90% of the NiO during the CLR process, as shown in Fig. 4a. This is further evidenced by the water formed during ‘unmixed combustion’ as per reaction R1 resulting in negative steam conversion ‘XH2O’ of -0.2 (see Fig. 4a) and by the high selectivity to CO2 (up to 90%)
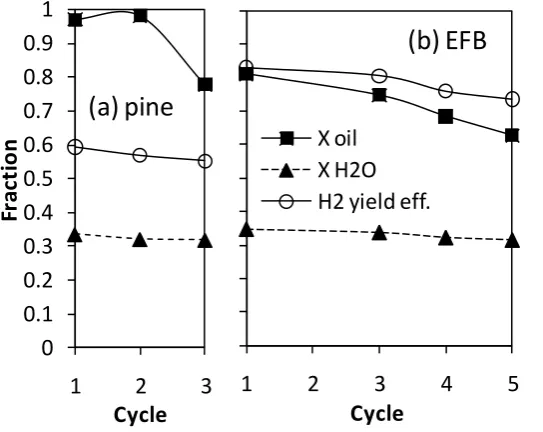
A comparison of the oil and steam conversions (Xoil and XH2O) and the H2 yield
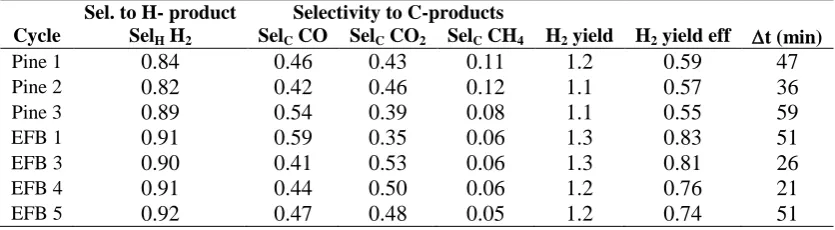
efficiency for increasing cycles is shown in Fig. 5, with the selectivity to the associated products shown in Table 3 together with the ‘t’ of each experiment. The average duration for the reported data for the three pine oil cycles was 47 min, and it was 37 min for the five EFB oil cycles. An anomaly happened to our data in cycle 2 for the EFB oil which is why it is not reported. In the pine oil cycles, the oil conversion appeared to drop between cycles 2 and 3 but this was accompanied by a drop in selectivity to CH4 (from 12 to 8%) and a steady water conversion (0.32) which
resulted in a H2 yield that decreased slightly. There was also deterioration in the
conversion of EFB oil with cycling, but as the steam conversion was also constant, the drop in H2 yield efficiency was dampened (from 83% to 74% in 5 cycles). In the case
of the EFB oil, the selectivity to the carbon products appeared constant, with only 5% CH4. It is worthy of noting that the water conversion appeared not only constant with
cycling but that it was remarkably similar for the two oils. The drop in fuel conversion for the two oils suggested a deactivation of the Ni-OTM upon cycling. The decrease in the extent of reduction of the OTM catalyst throughout the cycles could be due to either physical effects, such as deposit build up, or chemical effects due to poisoning by trace elements in the bio-oil. The cause of this deterioration will be explored in a forthcoming publication relying on extensive characterization of the catalyst.
4. Conclusions
TGA showed that both bio-oils had reached 95% of their mass loss conversion through evaporation and thermal decomposition below 436 °C, indicating that the steam reforming reactions would mainly involve the products of this decomposition. This could account for the similar process outputs obtained when varying the steam to carbon ratio for the oils. Despite the bio-oils’ high oxygen content, they were both able to reduce close to 90% of the NiO during CLR, indicating that they have the potential to be used in the CLR process. Both bio-oils exhibited high H2 yield
efficiencies (0.6-0.8) at S/C between 2 and 3 and at a WHSV of 2.5 h-1. A decrease in fuel conversion upon repeated cycles, mitigated by a steady water conversion and decreasing selectivity to CH4 caused the H2 yield efficiency to drop slightly with
cycling. A decrease in the rate of the reduction of the OTM catalyst was observed over multiple cycles. The cause of this requires further investigation in order to develop the CLR process for bio-oils.
Nomenclature
CLR Chemical Looping Reforming
H2 yield Mol of hydrogen produced per mol of C in the fuel
H2 yield eff Hydrogen yield efficiency (mol H2/mol C from fuel)/(theoretical
maximum from complete stoichiometric reactions R2 & R3). Max theo. yield for pine oil is 2.0, and 1.56 for EFB oil.
OTM Oxygen Transfer Material
TGA Thermo-Gravimetric Analysis
R Reaction
SelC Selectivity to carbon containing product
T Temperature
WHSV Weight hourly space velocity
WGS Water gas shift
X exp Mass loss conversion fraction of oils in the TGA apparatus
X mod Modelled mass loss conversion fraction of the oils from TGA experiment.
Xoil Conversion fraction of lubricating oil
XH2O Conversion fraction of water
t Duration in minutes over which the average process outputs are reported.
Acknowledgements
Our thanks to the Research Council UK (RCUK) for grants EP/D078199/1 and EP/G01244X/1, to Sirim Berhad for Mrs Md Zin’s scholarship and to Johnson Matthey for donation of catalyst materials.
References
[1] Kechagiopoulos, P.N., Voutetakis, S.S., Lemonidou A.A. and Vasalos I.A. Hydrogen production via reforming of the aqueous phase of bio-oil over Ni/olivine catalysts in a sprouted reactor. Ind.Eng.Chem.Res., Vol 48, 2009, pp. 1400-8.
[2] Czernik, S., Evans, R. and R. French. Hydrogen from biomass- production by steam reforming of biomass pyrolysis oil. Catalysis Today, Vol 129, 2007, pp. 265-8.
[3] Lyon, R.K. and Cole, J.A. Unmixed combustion: an alternative to fire.
Combustion and Flame Vol 121, 2000, pp. 249-261.
[4] Dupont, V., Ross, A.B., Knight, E., Hanley, I., and Twigg, M.V. Production of hydrogen by unmixed steam reforming of methane. Chem. Eng. Sci., Vol 63, 2008, pp. 2966-2979.
[5] Dupont, V., Ross, A.B., Hanley, I. and Twigg, M.V. Unmixed steam reforming of
methane and sunflower oil: a single-reactor process for H2-rich. Gas Int. J.
Hydrogen Energy, Vol 32, 2007. pp. 67-79.
[6] Dou, B., Dupont, V., Rickett, G., Blakeman, N.,Williams, P.T., Chen et al, Hydrogen production by sorption-enhanced steam reforming of glycerol. Bioresource Technology. Vol 100, 2009, pp. 3540-7.
[7] Pimenidou, P., Rickett, G. L., Dupont, V, Twigg, M. V. Chemical looping reforming of waste cooking oil in packed bed reactor. Bioresource Technology vol. 101,2010, pp. 6389–6397
Table 1. Characterization of biomass pyrolysis oils.
EFB Pine
pH 2.3 3.2
Flash Point (°C) 92 73
CV (MJ/kg) 11.5 15.0
Ash content ( wt%) 2.45 3.78
Elemental Analysis (wet)
Carbon (wt %) 27.87 39.51
Hydrogen (wt%) 6.17 6.78
Nitrogen (wt%) 0.87 0.23
Oxygen* (wt%)
Water content (wt%)
65.07
32
53.48
22
Inorganic substances (ppm) Br P Na Mg Al Fe S Ca Si K 34.1 104.2 74.5 113.9 128.5 135.7 610.7 500.5 523.5 1417.6 37.7 56.9 79.3 11.1 267.3 617.8 435.7 400.2 564.0 57.5
[image:11.595.90.505.475.540.2]*oxygen content was taken by difference
Table 2. Effect of reactor loading on conversion, C-products distribution and H2 yield
efficiency for pine oil, S/C=2.3 at 600 ºC. Mean t over the 3 conditions is 65 min.
WHSV Xoil XH20 Selectivity to C-products H2 yield eff. t(min)
h-1 SelC CO SelC CO2 SelC CH4
1.5 0.94 0.386 0.44 0.49 0.07 0.67 55
2.5 0.97 0.335 0.46 0.43 0.11 0.59 42
3.8 0.81 0.348 0.40 0.46 0.14 0.54 99
Table 3. Influence of cycling on selectivity to H2 in the H-products and to the
C-products (CO, CO2, CH4) using S/C= 2.3 (pine) and 2.7 (EFB) at 600 ºC
Sel. to H- product Selectivity to C-products
Cycle SelH H2 SelC CO SelC CO2 SelC CH4 H2 yield H2 yield eff t (min)
Pine 1 0.84 0.46 0.43 0.11 1.2 0.59 47
Pine 2 0.82 0.42 0.46 0.12 1.1 0.57 36
Pine 3 0.89 0.54 0.39 0.08 1.1 0.55 59
EFB 1 0.91 0.59 0.35 0.06 1.3 0.83 51
EFB 3 0.90 0.41 0.53 0.06 1.3 0.81 26
EFB 4 0.91 0.44 0.50 0.06 1.2 0.76 21
[image:11.595.89.507.626.741.2]Figure 1 Reactor set up
[image:12.595.156.439.381.633.2]
Figure 2 Fuel conversions (X) vs. temperature during TGA at 3 °C min-1, solid lines correspond to the conversions based on mass loss as measured experimentally by the TGA apparatus (‘X exp’), dashed lines are the best fit modelled conversions (‘X mod’). The EFB oil was best modelled using two sections: below (‘LO’) and above (‘HI’) X=0.6.
Syringe containing fuel Syringe containing water
Thermocouple
Condensate collector
Tube furnace
catalyst Reactor
K-wool insulation
Condenser
Condenser
H ,CO,CO ,CH O Analysers
2 2 4, 2
PC
N2 H2
Mass flow controller
Air
Silica gel Thermocouple
0 0.1 0.2 0.3 0.4 0.5 0.6 0.7 0.8 0.9 1
0 100 200 300 400 500 600
C
o
n
ver
si
o
n
fr
ac
ti
o
n
T (°C)
Figure 3 Comparison of (a) Conversion fractions for oil and water, (b) H2 yield (mol
H2/mol C input) against S/C ratio at 600 °C, starting from a H2-reduced catalyst.
Average duration over which averages were calculated: tav,pine= 41 min
(21<tpine<65 min), tav,EFB= 52 min (34< tEFB <72 min).
0 0.2 0.4 0.6 0.8 1 1.2
0 1 2 3 4
co
n
ve
rs
io
n
fr
ac
tio
n
S/C (water free oil) X oil, pine
X H2O, pine X oil, EFB X H2O, EFB (a)
0 0.2 0.4 0.6 0.8 1 1.2 1.4 1.6
0 1 2 3 4
H2
yi
el
d
(m
o
l H
2
/mo
l C
in
fu
el
)
S/C (water free oil) pine
Figure 4(a) Oil and steam conversion and extent of NiO reduction (%) and (b) Selectivity to C-products for pine bio-oil for S/C=2.3 at 600 °C, 2nd cycle (starting from oxidised catalyst from the end of cycle 1).
Co
n
ve
rsi
on
f
ra
ct
ion
time (s) X oil X H2O X NiO->Ni
(a)
NiO reduction steam reforming
0 20 40 60 80 100
200 1200 2200 3200 4200
S
elec
ti
v
it
y
t
o
C
-p
ro
d
u
ct
s
(%
)
time (s)
Selc CO2 Selc CH4 Selc CO
(b)
NiO reduction
Figure 5Comparison of oil and water conversion fractions and H2 yield efficiency
(exp yield/ max theor.) across multiple cycles during the steam reforming stage for bio oils (a) pine for S/C =2.3 and (b) EFB for S/C = 2.7 at 600 °C. Cycle 1 starts from a H2 reduced catalyst, other cycles start from an oxidised catalyst. Products
distributions and t in Table 3.
0 0.1 0.2 0.3 0.4 0.5 0.6 0.7 0.8 0.9 1
1 2 3
Fr
ac
tio
n
Cycle
(a) pine
1 2 3 4 5
Cycle X oil X H2O H2 yield eff.