RESEARCH ARTICLE
10.1002/2014JA020290Key Point:
• Meteor storms can induce strong enhancedEregion ionization
Correspondence to:
A. Pellinen-Wannberg, [email protected]
Citation:
Pellinen-Wannberg, A. K., I. Häggström, J. D. C. Sánchez, J. M. C. Plane, and A. Westman (2014), StrongE
region ionization caused by the 1767 trail during the 2002 Leonids,
J. Geophys. Res. Space Physics,119, doi:10.1002/2014JA020290.
Received 11 JUN 2014 Accepted 21 AUG 2014
Accepted article online 26 AUG 2014
Strong
E
region ionization caused by the 1767 trail during
the 2002 Leonids
Asta K. Pellinen-Wannberg1, Ingemar Häggström2, Juan Diego Carrillo Sánchez3, John M. C. Plane3,
and Assar Westman2
1Department of Physics, Umeå University and Swedish Institute of Space Physics, Kiruna, Sweden,2EISCAT HQ, Kiruna,
Sweden,3University of Leeds, UK
Abstract
IntensiveEregion ionization extending up to 140 km altitude and lasting for several hours was observed with the European Incoherent Scatter (EISCAT) UHF radar during the 2002 Leonids meteor shower maximum. The level of global geomagnetic disturbance as well as the local geomagnetic and auroral activity in northern Scandinavia were low during the event. Thus, the ionization cannot be explained by intensive precipitation. The layer was 30–40 km thick, so it cannot be classified as a sporadicElayer which are typically just a few kilometers wide. Incoherent scatter radars have not to date reported any notable meteor shower-related increases in the average background ionization. The 2002 Leonids storm flux, however, was so high that it might have been able to induce such an event. The Chemical Ablation Model is used to estimate deposition rates of individual meteors. The resulting electron production, arising from hyperthermal collisions of ablated atoms with atmospheric molecules, is related to the predicted Leonid flux values and observed ionization on 19 November 2002. The EISCAT Svalbard Radar (ESR) located at some 1000 km north of the UHF site did not observe any excess ionization during the same period. The high-latitude electrodynamic conditions recorded by the SuperDARN radar network show that the ESR was within a strongly drifting convection cell continuously fed by fresh plasma while the UHF radar was outside the polar convection region maintaining the ionization.1. Introduction
The nighttime ionization of the atmosphere originates from different sources. During the polar summer in the Arctic and Antarctic, the midnight Sun causes photoionization. Some auroral precipitation is always present at high latitudes. The polar ionosphere is dominated by the strong two-cell convection drift which transports the ionized masses. At middle and low latitudes, various instabilities, irregularities, tides, and waves carry around ionization provided by radiation from space. The influx and ablation of meteoroids cause a variety of metal atoms to be injected into the atmosphere at hyperthermal velocities; collisions of these atoms with air molecules is another source of ionization [Vondrak et al., 2008], which is global in extent. Most of this ionization occurs within the ionosphericEregion overlapping the meteor zone extending from 80 to 120 km.
The sporadic meteoroid influx has various periodic behaviors, such as the daily Apex maximum during the local morning hours and Antapex minimum at evening. There is also an annual midnight Sun-like effect with a maximum influx in the fall, when the Earth is tilted toward and a minimum flux in the spring, when the Earth is tilted away from the Apex in the Northern Hemisphere and opposite in the southern one [Szasz et al., 2004]. Shower meteors associated with comets often have a larger-size population and are thus opti-cally more frequent than the sporadics, while the latter contain much higher fluxes at small masses [Hughes, 1978]. An excess ionizing effect of the shower meteors has been predicted [Lebedinets and Shushkova, 1970] but not observed to date.
Meteor trails are expanding cylindrical columns of ionization following an ablating meteoroid entering the Earth’s atmosphere. In this process the region of ionized gas formed around the meteoroid expands almost instantaneously to a so-called initial radius, which is proportional to the mean free path. The trail then expands at a much slower rate governed by radial ambipolar diffusion. Employing a total meteoroid mass influx model of 1.0×10⁻¹⁶g cm−2s−1[Hughes, 1978;Grebowsky et al., 1998], two trains of meteoroids mass
10μg (corresponding to a radius of 100μm for a density of 2000 kg m−3) will meet after 4 min at 115 km
ion-electron recombination chemistry, contributing to a general enhancement of the plasma concentration in the lower ionosphere.
In this paper we will investigate if the intensiveEregion ionization during the Leonid maximum in 2002 was caused by meteors. We will employ the Chemical Ablation Model (CABMOD) [Vondrak et al., 2008] to study whether the meteoric ionization can extend as high as we observe with the radar, beyond 130 km altitude. Finally, we will consider the background ionospheric dynamics to try to understand why the EISCAT mainland UHF radar monitored such a layer, but the ESR radar on Svalbard only recorded very weak ionization simultaneously.
2. The Leonids Meteor Shower 2002
The reentry of the 33 year period comet 55P/Tempel-Tuttle to the central solar system toward the end of last millennium raised high expectations for a decade around the perihelion date 28 February 1998. The comet had given the most spectacular meteor storms in 1799 and 1833 and was known to have a lot of remnants around its orbit from the earlier Sun passes. Many high-altitude shower meteors were reported during the most active Leonids periods around the turn of the millennium [Fujiwara et al., 1998;Koten et al., 2006]. As a population coming from the Apex direction toward the Earth, the Leonids are very fast−70 km/s. Thus, Leonids undergo significant sputtering and heating, which potentially leads to melting and ablation, at higher altitudes than for the average sporadic population.
The years closest to the perihelion enabled modelers to provide reliable predictions of the occurrence and intensity of the dust trails ejected by the comet in 1767 and 1866, so that the observed 2002 Leonids agreed well with the models [McNaught and Asher, 2002;Jenniskens, 2002]. The 1767 trail was optimal for Western European observing conditions. Earth passed through it around 0400 UT on 19 November and highly increased meteor activity was reported from 0330 to 0530 UT. The Zenith Hourly Rate (ZHR) reached some 2400 [Jenniskens, 2006].
Many strong optical meteors were seen above the EISCAT location in Northern Scandinavia [e.g.,
Pellinen-Wannberg et al., 2004]. As shown below, the mainland EISCAT UHF radar observed an intensive
Elayer extending up to 140 km altitude between 0300 and 0630 UT. The EISCAT Svalbard Radar (ESR) was measuring simultaneously but did not observe any increased ionization. There are not known recorded visual Leonid observations from Svalbard for this time. The Leonids lasted for a few hours. Thus, the exten-sion of the swarm in space is considerably broader than the Earth’s diameter, and the flux should be comparable within 1000 km distance.
The elevation angle of the Leonid radiant for the EISCAT UHF radar site in Tromsø and the ESR site in Longyearbyen, as well as the reported ZHR from the International Meteor Organization (IMO) data base for the period of interest, are shown in Figure 1. In Tromsø the radiant rose from about 40◦above the horizon at 0300 UT until its maximum height at about 43◦at 0500 UT, before descending back to 40◦at the end of the observed ionization period at 0630 UT. At Longyearbyen the elevation varied between 30◦and 33◦. There are enhanced values of ZHR already from midnight. The narrow 1767 peak started to grow at 0300 UT, reaches its maximum rate of 2400 around 0410 UT, and falls off quite fast at 0420 UT, before growing again for a short time after 0500 UT to 1000 ZHR level and falling to some 150 ZHR at 0600 UT.
3. The Experiment, Data, and Observations
The experiments described in this paper were run on the 930 MHz EISCAT UHF radar near Tromsø, Norway (69.58◦N, 19.23◦E), and on the 500 MHz EISCAT Svalbard Radar–ESR near Longyearbyen, Spitsbergen (78.15◦N, 16.02◦E), some 1000 km farther north. It was clear quite early that EISCAT as well as other high-power, large-aperture (HPLA) radars at high VHF could not distinguish increased rates of head echoes during meteor showers [Pellinen-Wannberg et al., 1998]. For the 2002 Leonids, which were expected to be intensive, we decided to run an ordinary ionospheric observing mode to explore whether some excess ion-ization would appear, thus excluding a dedicated head echo mode at EISCAT. At that time it was still difficult to cover both features, since narrow filters cut off the highly Doppler-shifted meteors because of limited data storage capabilities.
5 20
30 40 50
Elevation (deg)
Time (UT)
Leonid radiant Tromsø (+) and ESR (−−) ZHR (−) 2002−11−19
0 1 2 3 4 6 7 80
1000 2000 3000
Zenith Hour Rate (ZHR)
Figure 1.The Leonid radiant elevation angle above EISCAT UHF (+), ESR
(−), and the ZHR (solid line) estimated from about 20,000 observations
reported to the IMO data base (www.imo.net/node/120).
and 8.5◦for the ESR. The measure-ments extended from 95 km beyond 400 km altitude. The altitude resolu-tion was 0.9 km over the whole mea-surement range, but in the analysis gradually changing from 3 km in the
[image:3.612.175.413.90.268.2]Eregion to 20 km in theFregion. The standard autocorrelation function arc1 and tau modes, mostly used for auroral arc studies, were employed for the UHF and ESR radars, respectively [Turunen et al., 2002].
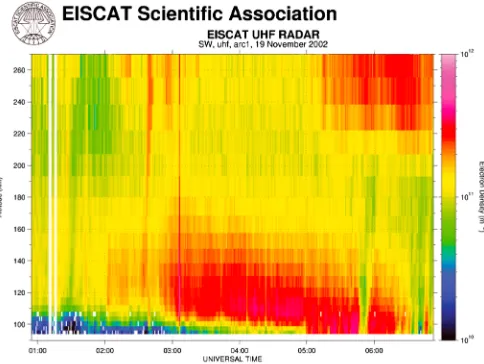
Figure 2 shows the EISCAT UHF elec-tron density data from the incoherent scatter analysis for the measure-ment period 0100 to 0700 UT on 19 November 2002. The slightly tilted structures around 0240 UT and toward the end of the data set are probably related to weak northward drifting precipitation along the magnetic field lines. The vertical beam direction gives such an effect in time-versus-altitude plots. From 0200 UT a weaker ionization layer between 110 and 150 km starts to grow. From 0300 UT until 0630 UT, the layer is strong with an electron density up to 3.4×10¹¹m−3. The enhanced ionization coincides with the increased rate of the observed Leonids in
[image:3.612.175.417.536.718.2]Figure 1. The layer is 30–40 km thick and descending. This could either be due to a semidiurnal tidal wave propagation in the morning sector, or there may be a bias toward larger meteoroids penetrating deeper into the atmosphere before ablating toward the end of the swarm. After 0500 UT, daytime ionization starts to grow up in theFregion.
Figure 3a shows the data from Figure 2 as 1 min integrated electron density profiles every half an hour between 0130 UT and 0630 UT. The density profiles from 19 November show a blunt-ended layer form. The profile has the same characteristic form that is produced in simulation studies on meteoric matter deposition in the atmosphere [Lebedinets and Shushkova, 1970;McNeil et al., 2001;Vondrak et al., 2008]. Figure 3b shows for comparison the International Reference Ionosphere (IRI) model electron density profile extending over theFregion ionization maximum at about 350 km altitude over Tromsø for the same night [Bilitza and Reinisch, 2008]. Due to the low activity the densities are low in theEregion, while
Figure 2.Time variation of the electron density versus altitude at zenith over Tromsø during the Leonid storm.
in theFregion they exceed
2.0×10¹¹m−3. In presence of aurora
theEregion densities can be high. Due to different energies of the pre-cipitating particles, the ionization increases even in theFregion, which was not seen during the Leonid event. Usually, auroral activity is also more varying with arcs drifting through the radar beam.
Electron density [m-3]
(a)
0 1 2 3
x 1011
50 100 150 200 250 300 350 400
Electron density [m−3]
Altitude [km]
021119 IRI model
[image:4.612.207.543.91.284.2](b)
Figure 3.(a) One minute integrated electron density profiles at half hours (1.30, 2.30, to 6.30 UT) from the EISCAT UHF
data in Figure 2 [Pellinen-Wannberg et al., 2014]. (b) The IRI model electron density profile over Tromsø for the same night.
4. The Geomagnetic Conditions and High-Latitude Electrodynamics
The measurements described in this study were performed at high latitudes; thus, it is important to describe the global and the local geomagnetic as well as the electrodynamic conditions. TheKpindex characterizes the level of the planetary disturbance, by combining data of the horizontal components of the geomagnetic field from a network of observatories in 3 h periods. It was varying between 3 and 3+in the
27-step scale with the maximum at 9. Thus, some weak auroral precipitation appeared in the auroral zone during this event and can indeed be recognized in both radar data sets.
The magnetometer in Tromsø indicates quiet geomagnetic conditions with a maximum disturbance of 50 nT. On Svalbard at Ny-Ålesund in the vicinity of the ESR station, the corresponding value was still lower, 30 nT. Despite being close to the solar cycle maximum, the conditions were very good for observing a meteor storm, since no large simultaneous solar-terrestrial events disturbed the measurements.
Above the polar cap in the collision free part of the ionosphere (theFregion) there exists a continuous anti-sunward plasma flow, which is closed through reversals in the auroral oval forming a two-cell convection pattern [Axford and Hines, 1961]. The pattern changes its form according to the degree of geomagnetic disturbance and the direction of the interplanetary magnetic field (IMF).
Figure 4.Time variation of the electron density versus altitude at zenith over Svalbard during the Leonid storm.
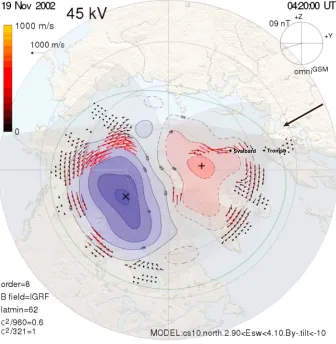
The constant ionospheric convec-tion over the polar regions has been monitored since the 1980s with the SuperDARN HF radar network [Greenwald et al., 1995]. As looking toward the Sun, the left-hand cell of the convection pat-tern was smaller on 19 November 2002 morning in agreement with the negative interplanetary magnetic field (IMF)By
[image:4.612.175.409.538.718.2]Figure 5.Convection patterns from the SuperDARN HF radar network. The location of the ESR radar is indicated at Svalbard and the EISCAT UHF location at Tromsø. The Leonid radiant direction is shown by the arrow. The employed
convection model is fromCousins and Shepherd[2010].
the drifts can be estimated to be around 35% of theFregion values [Koustov et al., 2005]. Thus, we can esti-mate drifts of a few hundreds of m/s over the ESR and some tens of m/s over the EISCAT UHF within the meteor altitude zone. This means that the about 1 km wide radar beam volume in theEregion is filled with new plasma within a few seconds at the ESR, while it takes minutes at the UHF location. The fresh plasma also comes from a much longer distance to Svalbard, from the other side of the polar cap. If the extension of a convection cell is some 2–3000 km, the plasma goes around within hours. In comparison, farther south over the EISCAT UHF site, the plasma can be considered almost static.
5. Modeling Meteoric Matter Deposition and Ionization
In this section we will estimate deposition rates of individual meteors by employing the University of Leeds CABMOD model [Vondrak et al., 2008] and relate the results to the predicted Leonids flux and observed ion-ization on 19 November 2002. We did not find any estimated or observed flux values for the 1767 trail in 2002. Thus, we use the 1998–2001 Leonids fluxes in Table 1 (W. J. Cooke, private communication) for the
Table 1.Expected Number of Leonid Impactors per Hour (W. J. Cooke, Private Communication)
Particle Diameter 1997,1998,2000 [m−2h−1] 1999 [m−2h−1] Worst Case [m−2h−1]
>20μm 0.4 2 59
>100μm 0.014 0.068 2
[image:5.612.206.545.687.744.2]meteoroids. Especially, the observed 1999 Leonid storm values from the 1899 trail are comparable to the 2002 ZHR values of more than 2500 for the 1767 trail [Jenniskens, 2006]. We call this case for “1999/2002.”
The momentary electron densitynein theEregion is governed by the continuity equation:
dne
dt + ∇⋅(neve) =q−l (1)
whereveis the plasma flow velocity,qthe ion production term, andlthe ionization loss rate. This is the common description of the process maintaining the ionospheric ionization. Sources for the ionization can be the solar UV radiation at daytime, auroral precipitation at high latitudes anytime, or other smaller sources including meteors. The divergence term can be associated to plasma drift due to the ionospheric electrody-namics at polar latitudes which can contribute to both enhancement and loss of ionization in a fixed volume such as a radar beam.
For the ordinary ionospheric ions NO+and O+
2 the dominating loss process for the ionization is the
electron-ion dissociative recombination with lifetimes of tens of seconds. For the metallic ions from the meteoroids such as Fe+, Mg+, and Na+the situation is different. Laboratory measurements of the relevant
kinetics to form molecular ions (e.g., FeO+) show that the lifetime of these ions are many hours above
100 km altitude [Cox and Plane, 1998;Woodcock et al., 2006;Whalley and Plane, 2010].
In the present modeling, we assume a chondritic composition. The atmospheric density profile, necessary to solve the differential equations describing the change of the velocity of the meteoroid in time, is taken from the Mass Spectrometer Incoherent Scatter model for the latitude, longitude, and time of year [Hedin, 1991]. The ablation profiles of the different compounds are calculated starting at 500 km of altitude, where sputtering dominates, but the ablation starts once the temperature of the meteoroid exceeds the melting point (∼1850 K). The altitude at which this occurs depends on the mass, velocity, and angle of entry and is below 130 km.
Due to the high speed of the Leonids, all the evaporating atoms can be assumed to ionize and the electron production rate can be assumed to be equal to the ablation rate. The initial density of the Leonid meteoroids is not definitely known. The estimates vary between 400 and 2000 kg m−3. In general, the ablation peak
maximum altitude varies several kilometers for different density meteoroids with otherwise similar param-eters, being higher up for lower densities [Vondrak et al., 2008;Pellinen-Wannberg et al., 2014]. A density of 2000 kg m−3was proposed byWilliams[1997].Rietmeijer[2002] got the same result from several estimates
of radius and density.
Starting with the observed electron density and its growth during the meteor shower we take the maximum electron density values from the green or blue profiles in Figure 3 at 120, 130, and 140 km altitude and sub-tract the minimum values from the black profile. The time difference between the green profile at 0330 UT and the black profile at 0130 UT is 2 h and for the blue profile at 0430 UT 3 h. Dividing these electron den-sity time variations with the assumed 1999/2002 flux for the smallest particles 2 m−2h−1, we get the values
for electron production rates of 3.7×10¹⁰m−1at 120 km, 5.0×10¹⁰m−1at 130 km, and 4.0×10¹⁰ m−1at
140 km altitudes.
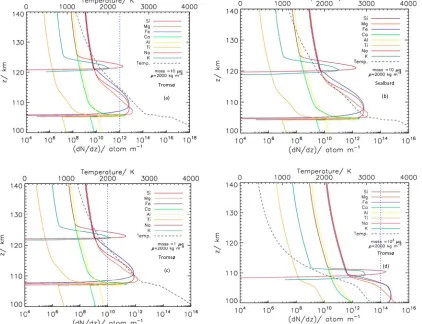
Figure 6 shows four examples of the output of the CABMOD model. All these are run for the density of 2000 kg m−3for the meteoroids. Figures 6a and 6b are for a 10μg meteoroid over Tromsø with an
eleva-tion angle of 43◦and over Svalbard with an elevation angle of 33◦, respectively. The altitude difference for the peak Na injection rate in these cases differs by less than 1 km. Otherwise, the electron production rate of each meteoric element is about the same. Figure 6c is for a 1μg, and Figure 6d is for a 1000μg meteoroid over Tromsø. The smaller particle ablates about 13 km higher up than the larger one.
The vertical dotted lines in Figures 6a, 6c, and 6d indicate the limit above which the various elements induce excess ionization for the different size categories and the corresponding fluxes according to the estimates above. For the smallest particles (Figure 6c), the ionization up to 125 km altitude can be explained clearly by the sodium ablation in the model. The extension upward can be explained by a higher meteoroid flux than the one we have used here and in that case it would come from magnesium and iron with high abundances in extraterrestrial matter or that the meteoroid population has a lower density than the one we used.
Figure 6.The predicted elemental ablation process for a 10μg meteoroid with 71 km/s and 2000 kg m−3density. (a) The plot for Tromsø with the Leonid
radi-ant elevation angle of 43◦. (b) The plot for Svalbard with an elevation angle of 33◦. (c) The plot for a 1μg. (d) The plot for a 1000μg meteoroid over Tromsø
[Pellinen-Wannberg et al., 2014].
ionization. Over Svalbard the situation is different. The divergence term, which is often ignored forEregion studies in the continuity equation, shows its importance here. The polar cap ionosphere is in a continu-ous circular drift and fed by new fresh plasma without meteoric contamination from the other side of the Pole where the Earth shadows the Leonids radiant. This description agrees also with the electron density behavior recorded with the ESR with several weak precipitation patterns associated to auroral arcs drifting through the radar beam, as seen in Figure 4.
6. Discussion
There are a very few HPLA radar facilities distributed around the world, so the probability to get meteor storm-induced ionization within a narrow incoherent scatter radar measurement volume is low. Also, during the past Leonids, most other radars than EISCAT were monitoring in meteor head echo modes and could not observe theEregion ionization. Since the dedicated incoherent scatter radars have never so far reported any increased ionization due to meteor showers, it does not occur at least during moderate shower conditions.
The chemical ablation model CABMOD provides a tool to confirm that the ionization observed with EISCAT UHF can be induced by the meteor shower. From the observed electron density and the assumed 1999/2002 flux, a limit for the rate of electron production can be estimated for the different size category particles and the corresponding fluxes from the elemental ablation profiles. For the two smaller categories between 20 and 1000μm meteoroids excess ionization can clearly be induced up to over 120 km altitude (Figures 6a and 6b). Even the largest category particles (>1 mm) can contribute to the ionization up to 111 km altitude (Figure 6d). This can be associated to another interesting feature in our data set. In Figure 1 a smaller peak in the ZHR rates starts to grow from 0500 UT. At the same time the ionization layer in Figure 2 suddenly drops lower. This might be a filament with slightly larger particles penetrating deeper in the atmosphere within the 1767 trail or meteoroids leaking from the close-by passing 1833 trail [Lyytinen et al., 2001].
7. Conclusions
There is strong evidence that the intensiveEregion ionization recorded with the EISCAT UHF radar during the Leonids meteor storm on 19 November 2002 was generated by meteoric ablation followed by ioniza-tion. The CABMOD model was used to estimate the injection rates into the atmosphere of the most common elements of meteoric origin based on the Leonid flux estimates for the 1999/2002 1899/1767 shower trails. The method confirms that excess ionization above 120 km altitude can be induced by sodium release.
This is the first time that meteor shower-induced ionization has been observed with incoherent scatter radars. The behavior of the layer responded to the incoming meteor flux at the EISCAT UHF radar, but the EISCAT Svalbard radar ESR did not observe enhanced ionization. This can be explained with the high-latitude ionospheric electrodynamics. The ESR was within a strongly drifting convection cell continuously
feeding the monitoring radar volume with fresh plasma, while the UHF radar was outside the polar convection region.
The very intensive storm trails exist only for a few hours. Thus, such induced ionization from the same comet trail can hardly be observed with two different radars in sequence. Even in this case, two radars at 1000 km distance did not record the same process. The next time we could expect conditions for similar enhanced ionization to occur is when we are close in time to the perihelion passage of some of the comets causing the almost 100 annual meteor showers, or if an unknown comet from the Oort Cloud with an orbit passing close to the Earth’s orbit suddenly appears.
References
Axford, W. I., and C. O. Hines (1961), A unifying theory of high-latitude geophysical phenomena and geomagnetic storms,Can. J. Phys.,
39, 1433, doi:10.1139/p61-172.
Bilitza, D., and B. W. Reinisch (2008), International reference ionosphere 2007: Improvements and new parameters,Adv. Space Res.,42, 599–609, doi:10.1016/j.asr.2007.07.048.
Chau, J. L., and F. Galindo (2008), First definitive observations of meteor shower particles using a high-power large-aperture radar,Icarus,
194, 23–29, doi:10.1016/icar.2007.09.021.
Cousins, E. D. P., and S. G. Shepherd (2010), A dynamical model of high-latitude convection derived from SuperDARN plasma drift measurements,J. Geophys. Res.,115, A12329, doi:10.1029/2010JA016017.
Cox, R. M., and J. M. C. Plane (1998), An ion-molecule mechanism for the formation of neutral sporadic Na layers,J. Geophys. Res.,103, 6349–6359, doi:10.1029/97JD03376.
Fujiwara, Y., M. Ueda, Y. Shiba, M. Sugimoto, M. Kinoshita, C. Shimoda, and T. Nakamura (1998), Meteor luminosity at 160 km altitude from TV observations for bright Leonid meteors,Geophys. Res. Lett.,25, 285–288, doi:10.1029/97GL03766.
Grebowsky, J. M., R. A. Goldberg, and W. D. Pesnell (1998), Do meteor showers significantly perturb the ionosphere?,J. Atmos. Sol.Terr. Phys.,60, 607–615, doi:10.1016/S1364-6826(98)00004-2.
Greenwald, R. A., et al. (1995), Darn/Superdarn: A global view of the dynamics of high-latitude convection,Space Sci. Rev.,71, 761–796, doi:10.1007/BF00751350.
Hedin, A. E. (1991), Extension of the MSIS thermosphere model into the middle and lower atmosphere,J. Geophys. Res.,96, 1159–1172, doi:10.1029/90JA02125.
Hughes, D. W. (1978), Meteors, inCosmic Dust, edited by J. M. McDonnel, pp. 123–185, John Wiley, New York.
Hunten, D. M., R. P. Turco, and O. B. Toon (1980), Smoke and dust particles of meteoric origin in the mesosphere and stratosphere,
J. Atmos. Sci.,37, 1342–1357, doi:10.1175/1520-0469(1980).
Jenniskens, P. (2002), Forecast for the upcoming 2002 Leonid storms, paper presented at the 34th COSPAR Scientific Assembly, The Second World Space Congress, held 10-19 October, Houston, Tex.
Acknowledgments
We gratefully acknowledge the EISCAT staff for their assistance during the experiment. EISCAT is an inter-national association supported by research organizations in Norway (NFR), Sweden (VR), Finland (SA), Japan (NIPR and STEL), China (CRIPR), and the United Kingdom (NERC). SuperDARN data were provided by Ethan Miller and Rob Barnes at JHU/APL with support from National Science Foun-dation grants AGS-0946902 and AGS-0838142. J.D.C.S. and J.M.C.P. were supported by the European Research Council (project 291332—CODITA).
Jenniskens, P. (2006),Meteor Showers and Their Parent Comets, Cambridge Univ. Press, Cambridge, U. K.
Kero, J., C. Szasz, T. Nakamura, D. D. Meisel, M. Ueda, Y. Fujiwara, T. Terasawa, H. Miyamoto, and K. Nishimura (2011), First results from the 2009–2010 MU radar head echo observation programme for sporadic and shower meteors: The Orionids 2009,MNRAS,416, 2550–2559, doi:10.1111/j.1365-2966.2011.19146.x.
Koten, P., P. Spurn´y, J. BoroviˇcKa, S. Evans, A. Elliott, H. Betlem, R. Štork, and K. Jobse (2006), The beginning heights and light curves of high-altitude meteors,Meteorit. Planet. Sci.,41, 1305–1320, doi:10.1111/j.1945-5100.2006.tb00523.x.
Koustov, A. V., D. W. Danskin, R. A. Makarevitch, and J. D. Gorin (2005), On the relationship between the velocity of E-region HF echoes and E×B plasma drift,Ann. Geophys.,23, 371–378, doi:10.5194/angeo-23-371-2005.
Lebedinets, V. N., and V. B. Shushkova (1970), Meteor ionisation in the E-layer,Planet Space Sci.,18, 1659–1663, doi:10.1016/0032-0633(70)90040-1.
Lyytinen, E., M. Nissinen, and T. van Flandern (2001), Improved 2001 Leonid storm predictions from a refined model,WGN: JIMO,29, 110–118.
McNaught, R. H., and D. J. Asher (2002), Leonid dust trail structure and predictions for 2002,WGN, JIMO,30, 132–143.
McNeil, W. J., R. A. Dressler, and E. Murad (2001), Impact of a major meteor storm on Earth’s ionosphere: A modeling study,J. Geophys. Res.,106, 10,447–10,466, doi:10.1029/2000JA000381.
Pellinen-Wannberg, A. (2001), The high power large aperture radar method for meteor observations, inProc. of the Meteoroids 2001 Conference, Kiruna, Sweden, vol. 495, edited by B. Warmbein, pp. 443–450, ESA Special Publication, Noordwijk, Netherlands. Pellinen-Wannberg, A., A. Westman, G. Wannberg, and K. Kaila (1998), Meteor fluxes and visual magnitudes from EISCAT radar
event rates: A comparison with cross-section based magnitude estimates and optical data,Ann. Geophys.,16, 1475–1485, doi:10.1007/s00585-998-1475-x.
Pellinen-Wannberg, A., E. Murad, B. Gustavsson, U. Brändström, C.-F. Enell, C. Roth, I. P. Williams, and Å. Steen (2004), Optical observations of water in Leonid meteor trails,Geophys. Res. Lett.,31, L03812, doi:10.1029/2003GL018785.
Pellinen-Wannberg, A., J. D. Carrillo Sánchez, I. Häggström, J. M. C. Plane, and A. Westman (2014), E region ionization enhancement over northern Scandinavia during the 2002 Leonids,Proc. of the URSI XXXIth General Assembly and Scientific Symposium, Beijing, China, 18-23 Aug.
Rietmeijer, F. J. M. (2002), Shower meteoroids: Constraints from interplanetary dust particles and Leonid meteors,Earth Moon Planets,88, 35–58, doi:10.1023/A:1013862627781.
Schult, C., G. Stober, J. L. Chau, and R. Latteck (2013), Determination of meteor-head echo trajectories using the interferometric capabilities of MAARSY,Ann. Geophys.,31, 1843–1851, doi:10.5194/angeo-31-1843-2013.
Szasz, C., J. Kero, A. Pellinen-Wannberg, J. D. Mathews, N. J. Mitchell, and W. Singer (2004), Latitudinal variations of diurnal meteor rates,
Earth Moon Planets,95, 101–107, doi:10.1007/s11038-005-9007-0.
Turunen, T., A. Westman, I. Häggström, and G. Wannberg (2002), High resolution general purpose D-layer experiment for EISCAT incoherent scatter radars using selected set of random codes,Ann. Geophys.,20, 1469–1477, doi:10.5194/angeo-20-1469-2002. Vondrak, T., J. M. C. Plane, S. Broadley, and D. Janches (2008), A chemical model of meteoric ablation,Atmos. Chem. Phys.,8, 7015–7031. Whalley, C. L., and J. M. C. Plane (2010), Meteoric ion layers in the Martian atmosphere,Faraday Discuss.,147, 349–368,
doi:10.1039/c003726e.
Williams, I. P. (1997), The Leonid meteor shower—Why are there storms but no regular annual activity?,MNRAS,292, L37–L40. Woodcock, K. R. S., T. Vondrak, S. R. Meech, and J. M. C. Plane (2006), A kinetic study of the reactions FeO++ O, Fe+N2+ O, Fe+
![Figure 3. (a) One minute integrated electron density profiles at half hours (1.30, 2.30, to 6.30 UT) from the EISCAT UHFdata in Figure 2 [Pellinen-Wannberg et al., 2014]](https://thumb-us.123doks.com/thumbv2/123dok_us/7956022.197945/4.612.175.409.538.718/figure-integrated-electron-density-proles-uhfdata-pellinen-wannberg.webp)