Int. J. Electrochem. Sci., 9 (2014) 2565 - 2574
International Journal of
ELECTROCHEMICAL
SCIENCE
www.electrochemsci.orgShort Communications
The Anodic Dissolution Processes of Copper in Sodium Fluoride
Solution
Guifei Gao1, Boyu Yuan2, Chao Wang1,*, Liang Li1, Shenhao Chen3,**
1
Jiangsu Key Laboratory of Green Synthetic Chemistry for Functional Materials, School of Chemistry and Chemical Engineering, Jiangsu Normal University, Xuzhou 221116, China
2
School of Physics and Electronic Engineering, Jiangsu Normal University, Xuzhou 221116, China
3
Department of Chemistry, Shandong University, Jinan 250100, China * E-mail: [email protected]
** E-mail: [email protected]
Received: 25 December 2013 / Accepted: 11 February 2014 / Published: 2 March 2014
The electrochemical method, digital holography and SEM have been combined to investigate the anodic dissolution of copper in 0.5 mol dm-3 NaF solution. Based on the results obtained by different techniques, the mechanism of the anodic dissolution of the Cu/NaF system is proposed. The thin Cu2O
film, rather than the CuF salt film, is formed at the initial stage. With the increase of the potential, cuprous ions are generated accompanied with the breakdown of the initial Cu2O film. Then a fresh
layer of the Cu2O oxide film is formed on the surface of the electrode, followed by a small quantity of
cupric ions generated with the dissolution of the oxide film and the precipitation of the local, sparingly soluble CuF2. The effect of pH on the system is found consistent with the above explanation.
Compared with other halide ions, such as Cl- and Br-, F- is less aggressive to copper.
Keywords: Copper, Fluoride ions, Anodic dissolution, Digital holography
1. INTRODUCTION
Being indispensable in the preparation of uranium, the element fluorine plays an important role in atomic energy industry [10]. It is also widely used in our home appliances such as refrigerators, air-conditioners and in daily necessities like toothpaste. Thus the corrosion of metals in fluoride containing solution is an urgent issue for inquiry.
The different fluoride media have been employed in many systems to study the effects of fluoride on the dissolution of copper. KF-2HF melt [11, 12] and other semi-aqueous [13] or non-aqueous solvents [14-17]containing fluoride media were the main study subjects. However, few investigations pay attention to the anodic behavior of Cu in aqueous fluoride media. The existing ones have mainly concentrated on the rapture of surface film by fluoride. Scully studied the localized corrosion of sputtered Al-Cu alloy thin film in aqueous HF solution, micro-pitting corrosion occurred at the open-circuit or corrosion potential [18]. Lee et al. [19] used the cyclic polarization connected with slow strain rate tests (SSRT) to study the film rupture-dissolution mechanism of 67/33 α-brass in NaF solution, and found that the threshold concentration of F- to induce pitting was 10-4 mol dm-3. Berlouis et al. [20] utilized the ellipsometry method to observe in situ the anodic dissolution of copper in F- containing alkaline solutions, and proved that fluoride affected the growth of the oxide layer through enhancing the dissolution of copper as the cupric species due to stress corrosion cracking (SCC). The electrochemically prepared Cu/CuF and Cu/CuF2 films were analyzed thermodynamically
in Mimoto’s work [21]. But the corrosion products of copper in aqueous solvents are quite different. The formation of the protecting oxide film on copper in aqueous solutions depends on pH, applied potential etc., which is in agreement with the thermodynamic predictions of the Pourbaix diagram [22]. In strong acid solutions, the anodic dissolution is too fast to provide a protective oxide layer [23, 24]. The composition of oxide products formed on the surface has been discussed qualitatively and quantitatively with electrochemical and surface analytical methods: the X-ray photoelectron spectroscopy (XPS)[25, 26], the atomic force micro-spectroscopy (AFM)[27], the in situ Raman [28, 29], the ion scattering spectroscopy (ISS) [25] and the in situ electrochemical scanning tunneling microscopy (ECSTM) [23, 24, 30] et al.
Various real-time optical methods, such as holographic interferometry [31-34], fringe projection [35] and digital image correlation [36], have been applied for the observation of electrochemical dynamic processes at metallic interfaces. Among them the holographic microphotography exhibits unique superiority for it is, as Klage pointed out, highly sensitive to local variations in interface concentrations, and can complement other technologies [37]. Habib employed 3D-holographic interferometry to detect the crevice corrosion of steels in seawater [31] and the growth of oxide film on aluminum samples [32]. Yuan et al. used digital holography to study the anodic dissolution mechanisms of Cu in NaCl solution [9, 33] and the electrodeposition of Cu in CuSO4
solution [34]. The phase difference obtained using digital holography is directly correlated to the refractive index changes at the interface brought about by the concentration changes of soluble species in the solution. Therefore, the dynamic processes of the diffusion layer can be vividly expressed by the phase differences and/or refractive index obtained which can testify the occurrence of the reactions and help the construction of the reaction mechanism.
dynamic changes of the concentration profile within the diffusion layer at the electrode/electrolyte interface are presented through reconstructed phase maps.These holographic maps, together with the electrochemical methods, can help deduce the generation of the ions and the formation of the surface film at the interface, which are fundamental to the illustration of the mechanism of the anodic dissolution of copper in NaF solutions.
2. EXPERIMENTAL
2.1 Voltammetric measurements
The electrochemical experiments were carried out in a three-electrode cell. The working electrode was a disk made from a Cu rod (d = 2 mm, 99.998%, Alfa-Aesar) and covered by a thin layer of epoxy resin in a glass tube, leaving only the end of the rod exposed to the electrolyte. The working electrode was polished with emery papers to a mirror-like surface, and washed with doubly distilled water in an ultrasonic bath before each experiment. As the counter electrode, a Pt sheet was used. The reference electrode was a saturated calomel electrode (SCE). All potential reported here are referred to SCE.
All solutions were prepared with analytical grades and doubly distilled water. The voltammetric measurements were performed using a CHI 660B electrochemical workstation at room temperature.
2.2 Digital holography
The experimental setup of the holographic system is referred to previous paper [38]. The digital video camera, the Sony DSR-PD150P, was used to record the dynamic process. The refractive index variation caused by the concentration changes at the interface of electrode/electrolyte led to the phase differences in the object wave. The differences were recorded in holograms subsequently. The phase maps were reconstructed from the AVI video signals by software developed with MATLAB® (copyright by The Mathworks, Inc.). The distribution of phase difference between the initial and any other time points can be reproduced continually on the PC monitors. Specific theories and the calculation methods can be found in previous papers [34].
3. RESULTS AND DISCUSSION
3.1 Anodic polarization
[image:4.596.107.490.149.333.2]
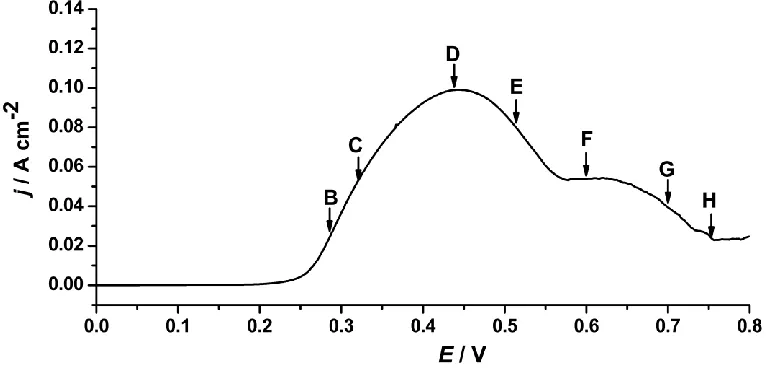
with the increase of the potential due to the formation of the surface film on the electrode as a barrier. Following the shoulder at about 0.56 V, the current dropped even lower indicating that the electrode went passive and further oxidation of copper occurred.
Figure 1. Polarization curve of the copper electrode in 0.5 mol dm-3 NaF solution at 10 mV s-1.
The anodic dissolution mechanism of Cu in NaCl and NaBr solutions has been investigated extensively [4-9, 28, 33]. It is general accepted that the first anodic current peak is associated with the formation of the CuCl/CuBr film on the surface of the electrode, and that the second peak is probably the transformation of oxidation of cuprous to soluble cupric species, and then to the formation of cupric oxide and/or hydroxide species [6, 9, 33]. However, in Cu/NaF system, the separate peaks for cuprous and cupric species are no longer distinct. Since CuF cannot be formed due to the high electronegativity of F- [11], an oxide film may be formed on the surface to cause the decrease of the current. Moreover, instead of dissolving steadily at positive potential in NaCl solution, copper tends to be passive in the NaF solution at high potential, which may have been caused by the oxide film and/or the salt film formed on the electrode surface. In order to verify our proposal, the anodic dissolution processes of the system have been examined in situ by the digital holography.
3.2 Digital holography
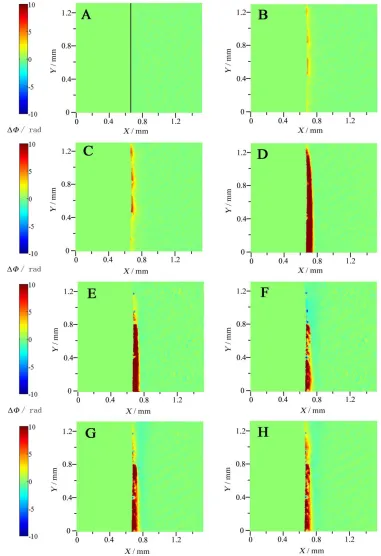
Figure 2. Phase distributions at different potentials during the anodic dissolution of copper; the labels B-H corresponding to B-H shown in Fig. 1. The X-axis is in horizontal direction from the electrode surface toward the bulk electrolyte while the Y-axis in vertical direction is parallel to the surface of the electrode. ΔΦ is the phase difference.
potential goes higher, more dissolved species diffuse to bulk solution and a diffusion layer formed gradually (Figs. 2C and 2D). Then the thickness of the diffusion layer decreases accompanying the decrease of current (Fig. 2E). Blue regions appear (Fig. 2F), which indicates the lower concentration in contrast with the bulk solution. This phenomenon is due to the consumption of ions at the interface. The current keeps almost constant and the phase remains unchanged (Fig. 2G) before the current shoulder appears at 0.56 V. Then the blue region turns yellow, indicating that the electrode is active again and consequently the phase differences (ΔΦ) go positive. But at the moment, the electrode goes passive since the diffusion layer disappears gradually (Fig. 2H).
The possible initial electrodissolution of copper in the solution with high concentration of fluoride was proposed as follows [39]:
-ads -e CuF F
Cu (1)
-sol
ads Cu F
CuF (2)
But from the results of the holograms, the phase difference at the interface does not decrease at the initial stages (Figs. 2B-2D), indicating that the consumption of F- does not occur either. As a result, the cuprous oxide film may be formed rather than CuFads. In addition, several studies have proved that
a thin Cu2O film would form on the bare surface of the copper through the reaction (3)[5, 40]:
2e 2H O Cu O H
2Cu 2 2
-
(3)
At the initial stage, the Cu2O film is so thin that it is easily damaged at high potential. After a
large amount of Cu+ ions surge into the bulk solution, pH at the interface increases to facilitate the formation of a denser Cu2O film. As the pH of 0.5 mol dm-3 NaF solution is 7.6, the concentration of
OH- is too low to induce negative phase difference. Similarly, this kind of phenomenon is observed in Cu/NaCl [33] and Fe/H2SO4 [41] systems. Moreover, extensively hydrated fluoride ions have poor
complexing ability compared with chloride and bromide ions [20]. Hence no cuprous fluoride complex would be formed at the interface.
When the potential shifts beyond the peak, the yellow region continue to be visible (Fig. 2E), indicating that Cu2+ may be formed. With the increase of the potential, the partially blue region appears (Fig. 2F), indicating that the negative phase difference occurs and the local concentration decreases at the interface. It can be deduced that the concentration of F- decreases at the interface, which may be caused by the precipitation of CuF2, for its solubility is only 0.075 g/100 g H2O at 25 oC. As the
potential shifts more positive, the current decreases and the diffusion layer turns thinner (Figs. 2G and 2H), indicating that the possible formation of the CuO/Cu(OH)2 oxide film [6, 7, 27]. The current
plateau near 0.56 V (Fig. 1) is probably at an equilibrium state between the dissolution of the electrode to Cu2+ and the formation of the oxide film. The refractive index in the region remains also unchanged (Figs. 2F-2G). The CuO/Cu(OH)2 film is stable in nearly neutral NaF solution, which proves that F
-expresses lower aggressive property to copper compared with other halide ions, such as Cl- and Br-.
3.3 Effects of pH
system, and the scan rate is 2 mV s-1 in order to obtain a quasi-steady state of copper during its dissolution in NaF solution.
According to reaction (3), the current will increase as the pH decreases for the oxide film dissolves easily in the acidic solution. In contrast, it will decrease with the increase of pH for the oxide film is easily formed on the surface of the electrode. Compared with the curve of the copper in nearly neutral NaF solution (Curve A, Fig. 3), the current decreases and the peak potential shifts positively in alkaline NaF solution (Curve C, Fig. 3). The anodic process here is similar to that in the nearly neutral solution. However, the current increases obviously in weak acidic solution (Curve B, Fig. 3). Thus, the results in Fig. 3 agree with those described above.
Figure 3. Effects of pH on the anodic polarization curves of the Cu/NaF system at 2.0 mV s-1.
3.4 SEM photographs
[image:7.596.132.468.247.409.2] [image:7.596.159.438.486.703.2]
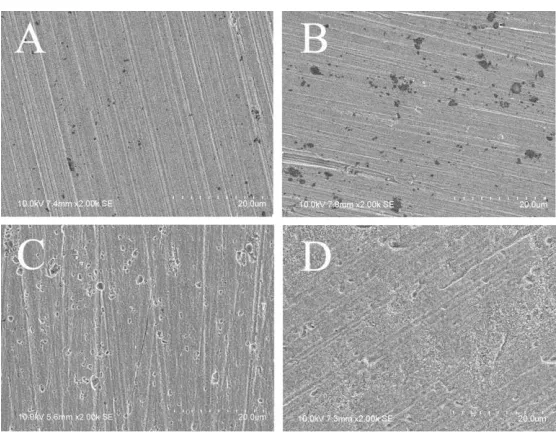
The SEM observation of the electrode surface has also been conducted. Fig. 4 shows the surface morphology of the electrode after the polarization in 0.5 mol dm-3 NaF solution from 0 V to 0.22V, 0.25 V and 0.40 V respectively at the scan rate of 2 mV s-1. Fig. 4A shows the surface morphology before the electrochemical test. As the potential is scanned from 0 V to 0.22 V, pitting is induced by F- (Fig. 4B), just as it is by other halide ions (Cl- and Br-). When it moves from 0 V to the peak (0.25 V, Fig. 4C), the oxide film is formed resulting in the healing of the pits. When it reaches 0.40 V, relatively compact oxide grains spread over the entire surface of the electrode (Fig. 4D).
4. CONCLUSIONS
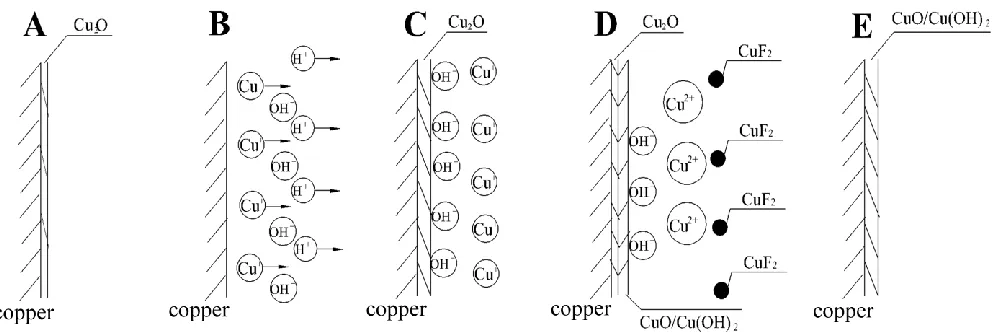
According to the results obtained by the digital holography, the electrochemical method and the SEM, the mechanism of the anodic dissolution processes of the Cu/NaF system is proposed. Fig. 5 presents the sketch of the whole anodic processes in five steps.
(A) The Cu2O film is formed at the initial stage (Fig. 5A), which is verified by the experimental
results in the weak alkaline solution (Fig. 3C).
(B) Abundant Cu+ ions are produced subsequently leading to the electromigration of H+ from the vicinity of the copper electrode to the bulk solution (Fig. 5B).
(C) A fresh layer of Cu2O film, which is denser than the one at the first step, is formed as a
barrier with the increase of pH at the interface (Fig. 5C).
(D) As the potential increases, Cu2+ ions are produced, which is verified by the decrease of the F- concentration and the precipitation of CuF2 on the outermost layer (Fig. 5D).
(E) The current decreases due to the formation of the compact CuO/Cu(OH)2 film, leading to
the passivation of the electrode (Fig. 5E).
In NaF solution, the cuprous product is Cu2O rather than CuCl/CuBr salt film in NaCl/NaBr
solution. Furthermore, the eventual passivation of copper in the system shows F- is less aggressive to copper than Cl- and Br-.
[image:8.596.53.550.554.720.2]
ACKNOWLEDGEMENTS
This work was supported by the Chinese National Science Funds (No.21073153 and No.21173180), the Priority Academic Program of Jiangsu Higher Education Institutions, Jiangsu Qing-Lan Project (10QLD005) and the Fund for Graduate Students, Jiangsu Province (CXZZ12_0983).
References
1. M.R.G. De Chialvo, R.C. Salvarezza, D.Vasquez and A.J. Arvia, Electrochim. Acta, 30 (1985) 1501.
2. L. Brossard, J. Electrochem. Soc., 131 (1984) 1847.
3. M.G. Figueroa, R.C. Salvarezza and A.J. Arvia, Electrochim. Acta, 31 (1986) 665.
4. M.M. Antonijevic, S.C. Alagic, M.B. Petrovic, M.B. Radovanovic and A.T. Stamenkovic, Int. J. Electrochem. Sci., 4 (2009) 516.
5. J.P. Lorimer, T.J. Mason, M. Plattes and D.J. Walton, J. Electroanal. Chem., 568 (2004) 379. 6. G. Kear, B.D. Barker and F.C. Walsh, Corros. Sci., 46 (2004) 109.
7. D. Tromans and J.C. Silva, J. Electrochem. Soc., 143 (1996) 458. 8. M. Itagaki, Y. Hirata and K. Watanabe, Corros. Sci., 45 (2003) 1023. 9. B.Y. Yuan, L. Li, C. Wang and S.H. Chen, Corros. Sci., 58 (2012) 69.
10.V.V. Shatalov, V.A. Seredenko, D.Yu. Kalmakov, A.V. Ivanov, O.B. Gromov and A.V. Parfienov, J. Fluorine Chem., 130 (2009) 122.
11.H. Dumont, S.Y. Qian and B.E. Conway, J. Appl. Electrochem., 27 (1997) 267. 12.B. Burrows and R. Jasinski, J. Electrochem. Soc., 115 (1968) 348.
13.N. Venkataraman and S. Raghavan, Microelectron. Eng., 87 (2010) 1689.
14.S. Sathyamoorthi, D. Velayutham, V. Suryanarayanan and M. Noel, Electrochim. Acta, 56 (2011) 7012.
15.V. Suryanarayanan and M. Noel, J. Solid State Electrochem., 13 (2009) 1913.
16.S. Sathyamoorthi, K.R. Saravanan, D. Velayutham and V. Suryanarayanan, J. Appl. Electrochem., 42 (2012) 595.
17.G.G. Totir, G.S. Chottiner, C.L. Gross and D.A. Scherson, J. Electroanal. Chem., 532 (2002) 151. 18.J.R. Scully, R.P. Frankenthal, K.J. Hanson, D.J. Siconolfi, and J.D. Sinclair, J. Electrochem. Soc.,
137 (1990) 1365.
19.C.K. Lee and H.C. Shih, J. Electrochem. Soc., 142 (1995) 731.
20.L.E.A. Berlouis, D.A. Mamman and I.G. Azpuru, Surf. Sci., 408 (1998) 173.
21.A. Mimoto, T. Miyazaki, J.P. Yamashita, S.Nagamine, M. Inaba and A.Tasakaa, J. Electrochem. Soc., 153 (2006) 149.
22.M. Pourbaix, Atlas of Electrochemical Equilibria in Aqueous Solution, NACE International, Houston, TX (1974).
23.J.K. Kunze, V.M. Maurice, L.H. Klein, H.H. Strehblow and P. Marcus, J. Electroanal. Chem., 554 (2003) 113.
24.J.K. Kunze, V.M. Maurice, L.H. Klein, H.H. Strehblow and P. Marcus, Corros. Sci., 46 (2004) 245.
25.H.H. Strehblow and B. Titze, Electrochim. Acta, 25 (1980) 839. 26.W. Kautek and J.G. Gordon, J. Electrochem. Soc., 137 (1990) 2672.
27.D. Starosvetsky, O. Khaselev, M. Auinat and Y. Ein-Eli, Electrochim. Acta, 51 (2006) 5660. 28.M.R.G. De Chialvo, S.L. Marchiano and A.J. Arvia, J. Appl. Electrochem., 14 (1984) 165. 29.S.T. Mayer and R.H. Muller, J. Electrochem. Soc., 139 (1992) 426.
30.J.K. Kunze, V.M. Maurice, L.H. Klein, H.H. Strehblow and P. Marcus, J. Phys. Chem. B,105 (2001) 4263.
32.32. K. H abib, Corros. Sci., 43 (2001) 449.
33.B. Yuan, C. Wang, L. Li and S. Chen, Electrochem. Commun., 11 (2009) 1373.
34.B. Yuan, S. Chen, X. Yang, C. Wang and L. Li, Electrochem. Commun., 10 (2008) 392. 35.P. Huang, F. Jin and F. Chiang, Opt. Laser Eng., 31 (1999) 371.
36.M. Rendon-Belmonte, J.T. Perez-Quiroz, J. Teran-Guillen, J. Porcayo-Calderon, A. Torres-Acosta, and G. Orozco-Gamboa, Int. J. Electrochem. Sci., 7 (2012) 1107.
37.P.E. Klages, M.K. Rotermund and H.H. Rotermund, Corros. Sci., 65 (2012) 128. 38.L. Li, C. Wang, B. Yuan and S. Chen, Electrochem. Commun., 10 (2008) 103. 39.M. Itagaki, M. Tagaki, T. Mori and K. Watanabe, Corros. Sci., 38 (1996) 601. 40.C.K. Lee and H.C. Shih, Corrosion, 52 (1996) 690.
41.B. Yuan , J.L. Zhang , G.F. Gao , L. Li and C. Wang, Electrochem. Commun., 27 (2013) 116.