Rochester Institute of Technology
RIT Scholar Works
Theses Thesis/Dissertation Collections
8-2018
Statistics Anxiety Towards Learning New Statistical
Software
Shahd Saad Alnofaie
Follow this and additional works at:https://scholarworks.rit.edu/theses
This Thesis is brought to you for free and open access by the Thesis/Dissertation Collections at RIT Scholar Works. It has been accepted for inclusion in Theses by an authorized administrator of RIT Scholar Works. For more information, please [email protected].
Recommended Citation
R.I.T
Statistics Anxiety Towards Learning New
Statistical Software
M.S. Master of Science
in Applied Statistics
College of Science
By
Shahd Saad Alnofaie
School of Mathematical Science Rochester Institute of Technology
Committee Approval
_________________________________________________ ___________
Robert Parody, Associate Professor, School of Mathematical Sciences Date Thesis Advisor
_________________________________________________ ___________
Carol Marchetti, Professor, School of Mathematical Sciences Date Committee Member
___________________________________________ ____________
Linlin Chen, Associate Professor, School of Mathematical Sciences Date Committee Member
Acknowledgements
I would like to offer my special thanks to Dr. Parody for his guidance and support,
and for answering countless questions whenever needed. I appreciate the feedback offered by
my Master thesis committee in addition to watching my defense. Also, I would like to thank
all the members of the Division of Applied Statistics and my classmates for their help.
Abstract
Based on previous research, statistics anxiety towards statistics were discussed. There
is a study about anxiety and attitude of graduate students in on-campus vs. online statistics courses, and student attitude toward statistics. To date, no one has seemed to examine anxiety toward statistics with regard to use of coding vs. noncoding software. The purpose of this
study was to know the level of anxiety towards learning new statistical software. Responses
from seventy-nine graduate students who have or had classes in the Applied Statistics
Division were collected. The survey made for this study had a Likert scale that included three
categories of interest: Learning Statistical Concepts, Learning Statistical Software, and Learning to Read/Interpret Results. Also, there were demographic characteristics considered as possible effective factors on the Likert scale. A repeated single measure was used for this
study. The results showed software type, gender, and major are statistically significant
Contents
Acknowledgements ... iv
Abstract ... v
Contents ... vi
1. Introduction ... 1
1.1 Ordinal Logistic Regression (OLR) ... 2
1.2 Cronbach’s alpha ... 3
2. Literature review ... 4
2.1 Anxiety scales ... 4
2.2 Related studies ... 4
3. Methods... 5
3.1 Participants ... 5
3.2 Instrumentation ... 6
4. Analysis of Data ... 7
4.1 Preliminary analysis ... 7
4.2 Cronbach's alpha ... 9
4.3 Ordinal Logistic Regression ... 9
5. Discussion and Limitations ... 15
6. Conclusions and Areas for future research ... 16
List of Tables
Table 1. Brief description of the Likert scale. ... 6
Table 2. Demographic Information. ... 8
Table 3. Learning Statistical Concepts: p-values of main effects for category responses. ... 10
Table 4. Learning Statistical Concepts: coefficients table for category responses. ... 10
Table 5. Learning Statistical Software: p-values of main effects for category responses. ... 11
Table 6. Learning Statistical Software: coefficients table for category responses.. ... 12
Table 7. Learning How to Read/Interpret Results: p-values of main effects for category responses. ... 13
1.
Introduction
The field of statistics is enormous and most studies rely on it. Researchers use
statistics by either analyzing or predicting results. In order to analyze or predict results, they
use statistical software packages. These software packages typically depend on some type of
programming. To be able to analyze the data from any research study or statistics course, researchers and students need to learn how to work with these software packages. In fact,
learning these software packages requires time and effort, and can be difficult. These
consequences may lead to statistics anxiety. Statistics anxiety can happen when students take
any statistics courses or anything related to statistics. (Cruise, Cash, and Bolton, 1985). The aim of this study is to assess the students’ anxiety levels based on whether they
learned statistics using software that was driven by programming or non-programming-menus. Also, we want to know the relationship to the anxiety of factors like gender, software type, major, etc. Surveys are the best way to know other people’s opinions, so we are using a survey in this study. To accomplish the goal of the study, we first need to discuss the idea of a Likert scale that used in the survey. Spector (1992) explained that the scale iscommonly used in social science to test attitudes, opinion, emotional states like anxiety and anger, etc. In this study, I created my won survey questions that handled the aim of the study. A Likert scale was used in the survey, and it consists of sixteen statements that was built based on three categories of interest: Learning Statistical Concepts, Learning Statistical Software, and Learning to Read/Interpret Results. Participants were asked to respond on a five-point Likert scale. The survey also asked demographic questions such as major, age, software type, etc. that we used as explanatory variables. Thus, we need to assess whether there is a
usually do with a continuous variable. But, that only works when we have many potential response values. In this case, we are using the 5-point Likert scale. Therefore, in this study we will conduct an ordinal logistic regression.
1.1 Ordinal Logistic Regression (OLR)
Before introducing the idea of OLR, the difference between Anova and Regression analysis need to be explained. Regression and Anova are statistical models usually used when the dependent variable is numerical continuous. However, the difference between the two statistical models are the input variables (predictors). Generally, in Regression analysis the input variables are continuous, and in Anova the predictors are categorical variables. Logistic Regression is a special case of regression analysis where the dependent variable is
The OLR is considered to be a special case of multinomial regression (Warner, 2007) and models the relationship between the response and the input variables (factors).
Therefore, since we have sixteen response variables and seven input variables, we will can use the ordinal logistic regression for each response, resulting in sixteen repeated OLR. Recognizing the level of multiplicity in this approach, we will first attempt to decrease this multiplicity and potentially reduce the dimensionality inside the three high-level areas in which the questions were based (Learning Statistical Concepts, Learning Statistical Software, and Learning to Read/Interpret Results).
1.2 Cronbach’s alpha
There are sixteen responses among the three categories of questions. If the responses were continuous, principal component and/or factor analysis could be used to reduce
dimensionality. The data we have in this study is discrete and ordinal, and so Cronbach's alpha is more appropriate than principal component analysis. Cronbach's alpha is used to measure the internal consistency in the Likert scale. According to Gliem and Gliem (2003) “Cronbach’s alpha is a test reliability technique that requires only a single test administration to provide a unique estimate of the reliability for a given test. Cronbach’s alpha is the average value of the reliability coefficients one would obtained for all possible combinations of items when split into two half-tests.”. The score of Cronbach’s alpha needs to be high enough (greater than or equal to 0.7) for the scales to be combined and to avoid single-variable analyses. Bland and Altman (1997) mentioned in their paper that the Cronbach’s alpha equation is:
𝛼 =$%&# (1 − +,
-+.- ) ;
“where k is the number of items, 𝑠12 is the variance of the ith item, and 𝑠
32 is the variance of
The following sections of this paper are: Literature review, Methods, Analysis,
Discussion and limitations, Conclusions, and Areas for future research.
2.
Literature review
2.1 Anxiety scales
In 1998, Kazelskis conducted a study of mathematics anxiety scales and he suggested
that researchers should be aware when they choose their tools for measuring anxiety. Also,
Kazelskis recommended that researchers calculate scores in the scale for each factor instead
of calculating the sum of scores. Hopko, Mahadevan, Bare, and Hunt (2003) improved the
Abbreviated Math Anxiety Scale (AMAS) using a large sample and replicating the sample.
The six subscales of the Statistics Anxiety Rating Scale have internal consistency (Hanna,
Shevlin, and Dempster, 2008). The six factors are fear of statistics teachers, worth of
statistics, interpretation anxiety, fearing of asking for help, test and class anxiety, and
computational self-concept.
2.2 Related studies
A great deal of previous research has focused on anxiety towards statistics.
Onwuegbuzie and Wilson (2003) claim that students who are required to register in statistics
courses record high levels of anxiety towards statistics. They also comment that up to 80% of
graduate students face unusual levels of anxiety towards statistics. In fact, statistics requires a lot of work collecting, analyzing and interpreting data. Some studies have shown that this increases anxiety towards statistics. Two articles (Cruise, Cash and Bolton, 1985;
Onwuegbuzie, Daros, and Ryan, 1997) claim that working with and interpreting data cause statistics anxiety (cited in Hanna, Mark, and Dempster, 2008). Mills (2004) mentions a study
in which the attitudes of students towards statistics were negative. In 2010, Williams
questioned the instructor immediacy and statistics anxiety relationship. He found that when
In addition, there is research focused on the attitudes and the anxiety of graduate
students who took statistics courses on-campus vs. online. It was noted that anxiety
decreases, and attitudes are more positive, when online faculty members motivate students.
The use of intelligent technologies and resources in online classes help to eliminate anxiety
and increase retention (Devaney, 2010). In 2014, Williams studied the relation between
preference for numerical information (PNI) and six types of statistics anxiety, and the results
showed that four types of statistics anxiety were positively related to PNI. Moreover,
statistics anxiety affects students’ plans of study. Anxiety about statistics could lead the
students to procrastinate taking statistics courses until immediately before graduation (Parney
and Ravid, 1990). In 2010, DeVaney compared the level of anxiety and attitude of graduate
students in on-campus vs. online statistics courses. He found that the anxiety was reduced for
students taking the online version versus the on-campus course. Despite the fact that a variety
of studies address statistics anxiety and attitudes towards statistics, statistical anxiety towards
learning new statistical software has received less attention. The purpose of this article is to
better understand the relationship between statistics anxiety for the three categories (Learning Statistical Concepts, Learning Statistical Software, and Learning to Read/Interpret Results) and learning new statistical software among graduate students.
3.
Methods
3.1 Participants
The participants are Applied Statistics and Non Applied Statistics graduate students enrolled in courses in the Division of Applied Statistics at the Rochester Institute of
looking at the data, there were some missing values, so the observations that had the missing values were deleted. Therefore, the total number of the observations (responses) decreased to seventy-nine.
3.2 Instrumentation
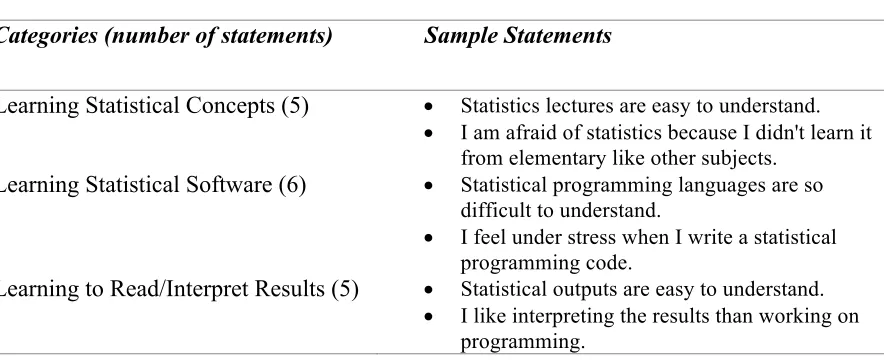
[image:14.595.81.525.432.612.2]The form of the survey was influenced by Devaney’s Anxiety and Attitude of Graduate Students in On-Campus vs. Online Statistics Courses (2010). The survey, in Appendix A, was constructed with three categories: Learning Statistical Concepts, Learning Statistical Software, and Learning to Read/Interpret Results. The statements in Table 2 were presented in random order rather than organized separately by categories. Each category has many items, so the survey consists of 16 items with a Likert scale ranging from strongly disagree to strongly agree. Table 1 gives a brief description of the Likert scale that has been used in the survey.
Table 1. Brief description of the Likert scale.
Categories (number of statements) Sample Statements
Learning Statistical Concepts (5) • Statistics lectures are easy to understand.
• I am afraid of statistics because I didn't learn it from elementary like other subjects.
Learning Statistical Software (6) • Statistical programming languages are so difficult to understand.
• I feel under stress when I write a statistical programming code.
Learning to Read/Interpret Results (5) • Statistical outputs are easy to understand.
• I like interpreting the results than working on programming.
The survey also had demographic questions like age, gender, major, etc. These
two questions have been combined to one question: Applied Statistics and Non Applied Statistics. In addition, there was a text question that asked about what software they use regularly, and the answers were software names such as Minitab, R, SAS, Python, Matlab, Excel, etc. To facilitate the analysis, the data for this question have been recorded as coding or non-coding software type.
4.
Analysis of Data
4.1 Preliminary analysis
The demographic characteristics of the seventy-nine students who completed the survey are shown in Table 2. In the table, the characteristics are summarized by software type: coding, non-coding, or both. It is clear that there are differences between the three types of software regularly used among the demographic characteristics. There are gender
differences within software type where 67.74 % of the students who used noncoding programs are males and 32.26% of the students who used noncoding programs are females. Also, in the major category, there is a considerable difference. 82.35% of the students who regularly use coding are Applied Statistics students where 80.65% of the students who
Table 2. Demographic Information.
Software Type
Demographic Coding (n=34) Noncoding (n=31) Both (n=14)
Male 18 (52.94%) 21 (67.74 %) 9 (64.29%)
Female 16 (47.06%) 10 (32.26%) 5 (35.71%)
US Citizen 24 (70.59%) 12 (38.71%) 7 (50.00%)
Not US Citizen 10 (29.41%) 19 (61.29%) 7 (50.00%)
Applied Statistics 28 (82.35%) 6 (19.35%) 13 (92.86%) Not Applied Statistics 6 (17.65%) 25 (80.65%) 1 (7.14%)
Bachelors 4 (11.76%) 1 (3.23%) 1 (7.14%)
Master 27 (79.41%) 29 (93.55%) 12 (85.71%)
Doctorate 2 (5.88%) 0 (0%) 1 (7.14%)
Certificate - 1 (3.23 %) -
Other 1 (2.94%) - -
Online 11 (32.35%) 1 (3.23 %) 2 (14.29%)
On-Campus 11 (32.35%) 9 (29.03%) 6 (42.86%)
Both 12 (35.29%) 21 (67.74%) 6 (42.86%)
Age Mean =28.44
4.2 Cronbach's alpha
Using Minitab software, the set of all questions overall had Cronbach’s alpha =
0.5856,which is an unacceptable score and suggested that there was a very large
variability in responses. In addition to Minitab, SAS software was also used. The SAS code in Appendix C Part 1 is from Gennarelli and Goodman (2013). The results in tables B1-B3 in Appendix B show the Cronbach’s alpha for questions in each category (programming,
interpreting, and learning). All three tables show unacceptable alpha scores.
4.3 Ordinal Logistic Regression
Due to the large variability indicated by Cronbach’s alpha, the sixteen responses couldn’t be combined. For this reason, the responses have been analyzed separately. SAS was used for OLR and the codes are Appendix C Part 2. The results provided a Main Effects table, indicating the significant and non-significant factors for each response, see Tables 3 through 8 for results based on each category of questions. For the factors listed across the header row in the tables, software type is coding or non-coding or both. Class type means whether the class is online or on-campus, major is either Applied Statistics or Non Applied Statistics. Lastly, Degree has five levels: Bachelors, Master, Doctorate, Certificate, Other.
Table 3 lists p-values for the seven factors in each OLR among statements (responses) in the learning category. For the first statement, “Statistics lectures are easy to understand,” both software type and gender are statistically significant: the p-value for software type is 0.0145 which is less than 𝛼 =0.05 and the p-value for gender is equal to 0.0045 < 𝛼 = 0.05. Major is close to being statistically significant since the p-value is 0.0690. For the second statement, “Learning new statistical application increases the anxiety towards statistics”, the p-value for the software type is less than 𝛼 =0.05, so it is statistically significant, and major
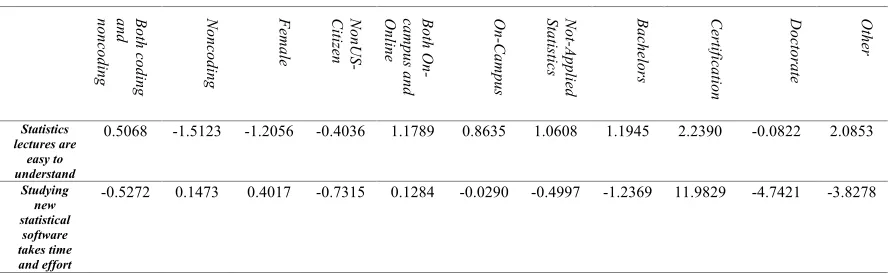
In OLR, each categorical factor (input variable) has a default value. When a value other than the default is used, there is a coefficient associated with it. Table 4 shows the coefficients for the non-default levels of each factor associated for the Learning Statistical Concepts category responses. In the first and last statements, non-coding and female (input values) are associated with less anxiety than coding and male. Non Applied Statistics students tend to face higher levels of anxiety than Applied Statistics students towards understanding the statistics lectures. For all statements, Doctorate students tend to have less anxiety level than Masters students. However, the second and the third statements represent that non-coding, female, and not-applied statistics input variables are associated with higher levels of anxiety than coding, male, and applied statistics factors.
Table 3. Learning Statistical Concepts: p-values of main effects for category responses.
Software Type
Classes types Gender Citizenship Age Major Degree
Statistics lectures are easy
to understand
0.0145 0.1446 0.0045 0.3072 0.7212 0.0690 0.2475
Learning new statistical application increases the anxiety towards statistics
0.0008 0.2362 0.1905 0.4370 0.3732 0.0575 0.6203
Studying new statistical application takes
time and effort
0.6633 0.9444 0.4384 0.2539 0.7917 0.5525 0.0177
I am afraid of statistics because
I didn't learn it from elementary
like other subjects
0.1403 0.5272 0.5222 0.3171 0.5894 0.1357 0.5832
Table 4. Learning Statistical Concepts: coefficients table for category responses.
Bo th c od in g and nonc odi ng No nc od in g Fe m ale No nU S-Ci tiz en Bo th O n-ca m pu s an d On lin e On -Ca m pu s No t-Ap pli ed St at ist ic s Ba ch elo rs Ce rti fic ati on Do cto ra te Ot he r Statistics lectures are easy to understand
0.5068 -1.5123 -1.2056 -0.4036 1.1789 0.8635 1.0608 1.1945 2.2390 -0.0822 2.0853
Studying new statistical software takes time and effort
[image:18.595.63.509.626.763.2]Learning new statistical application increases the anxiety towards statistics
0.7030 2.7547 0.5916 -0.3665 -1.1008 -1.6582 -1.4636 -0.1175 -2.6779 -0.7922 -0.0232
I am afraid of statistics because I didn't learn it from elementary like other subjects
-0.9058 -1.2069 -0.3155 0.5521 0.9847 1.0012 1.0466 -0.0374 3.3064 -15.2893 -0.5423
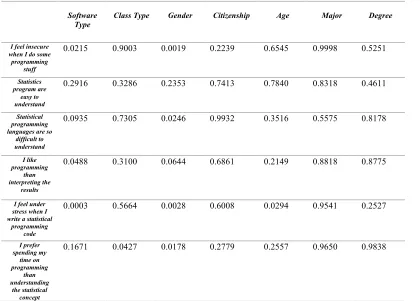
In Table 5, software type and gender are statistically significant in the first response in Learning Statistical Software category, “I feel insecure when I do some programming stuff”, with values less than 𝛼 (software type value= 0.0215 < 𝛼 = 0.05 and gender
p-value=0.0019 < 𝛼 = 0.05). Gender is the only significant variable in the third response,
“Statistical programming languages are so difficult to understand”, where the p-value is 0.0246 < 𝛼 = 0.05. In the fourth statement, “I like programming than interpreting the
[image:19.595.76.496.451.752.2]results”, software type is significant where the p-value is 0.0488 < 𝛼 = 0.05.
Table 5. Learning Statistical Software: p-values of main effects for category responses.
Software Type
Class Type Gender Citizenship Age Major Degree
I feel insecure when I do some
programming stuff
0.0215 0.9003 0.0019 0.2239 0.6545 0.9998 0.5251
Statistics program are
easy to understand
0.2916 0.3286 0.2353 0.7413 0.7840 0.8318 0.4611
Statistical programming languages are so
difficult to understand
0.0935 0.7305 0.0246 0.9932 0.3516 0.5575 0.8178
I like programming
than interpreting the
results
0.0488 0.3100 0.0644 0.6861 0.2149 0.8818 0.8775
I feel under stress when I write a statistical
programming code
0.0003 0.5664 0.0028 0.6008 0.0294 0.9541 0.2527
I prefer spending my time on programming than understanding the statistical concept
I have less anxiety when working on programming than interpreting the results
0.3110 0.1052 0.0497 0.8800 0.8942 0.7313 0.9368
Software type, Gender, and Age are the significant factors in the fifth statement, “I feel under stress when I write a statistical programming code”, where the p-values are less
than 𝛼 = 0.05. In the sixth statement, “I prefer spending my time on programming than
understanding the statistical concept”, class type and gender are statistically significant, the
p-values are equal to 0.0427 and 0.0178 respectively. Gender factor in the last statement, “I have less anxiety when working on programming than interpreting the results” , is the only
significant factor where the p-value is equal to 0.0497 which is less than 𝛼 = 0.05.
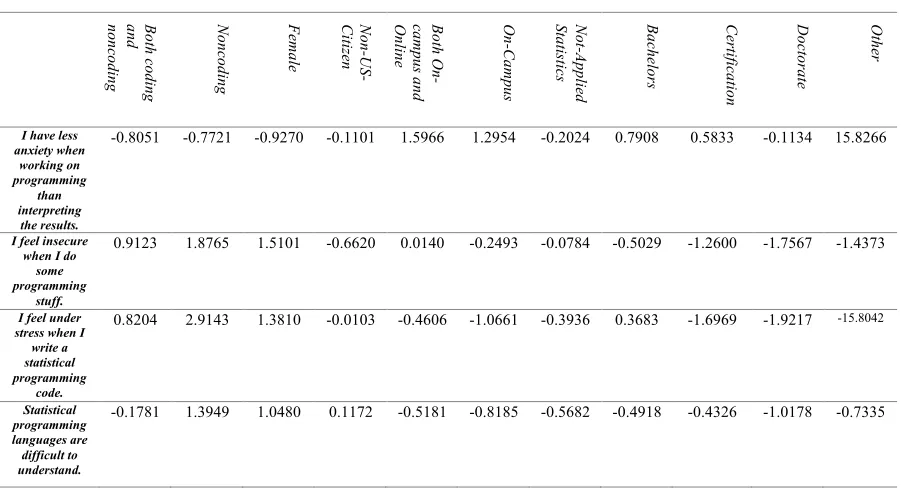
[image:20.595.72.529.518.763.2]Table 6 represents the coefficients table for Learning Statistical Software category responses. In the first, fifth, sixth and seventh statements the noncoding and female factors indicate less anxiety than coding and male factors. However, in the second, third, and fourth statements both noncoding and female input variables are facing more anxiety than coding and male factors.
Table 6. Learning Statistical Software: coefficients table for category responses.
Bo th c od in g and nonc odi ng No nc od in g Fe m ale No n-US -Ci tiz en Bo th O n-ca m pu s an d On lin e On -Ca m pu s No t-Ap pli ed St at ist ic s Ba ch elo rs Ce rti fic ati on Do cto ra te Ot he r
I have less anxiety when working on programming than interpreting the results.
-0.8051 -0.7721 -0.9270 -0.1101 1.5966 1.2954 -0.2024 0.7908 0.5833 -0.1134 15.8266
I feel insecure when I do
some programming
stuff.
0.9123 1.8765 1.5101 -0.6620 0.0140 -0.2493 -0.0784 -0.5029 -1.2600 -1.7567 -1.4373
I feel under stress when I write a statistical programming
code.
0.8204 2.9143 1.3810 -0.0103 -0.4606 -1.0661 -0.3936 0.3683 -1.6969 -1.9217 -15.8042
Statistical programming languages are difficult to understand.
I like programming
more than interpreting the results.
-0.1002 -1.5821 -0.7828 0.0440 0.9900 1.4406 0.3524 0.4278 1.4668 0.0524 16.2470
I prefer spending my time on programming than understanding the statistical concept.
-0.0333 -1.1285 -1.0816 -0.7335 1.7270 2.2773 0.2715 -0.1205 -12.5181 0.1316 16.9458
Statistics program are
easy to understand
[image:21.595.74.527.70.211.2]0.5716 -0.6237 -0.5776 0.2470 1.1284 0.8769 -0.0840 1.4029 2.1095 1.5181 17.5768
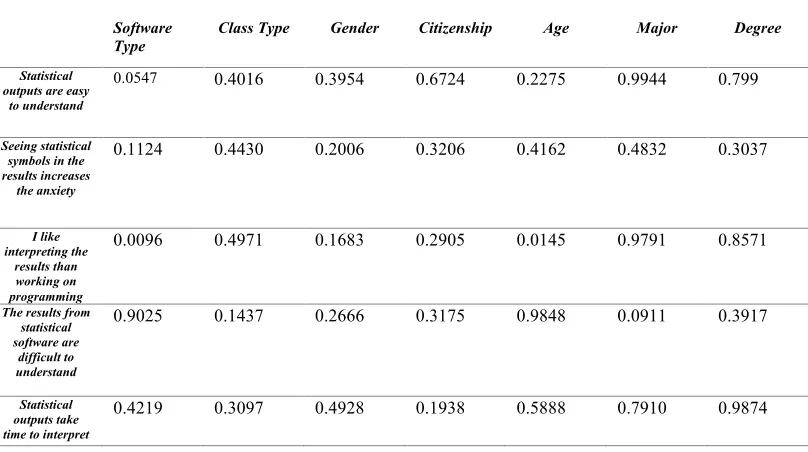
Table 7 shows the p-values for Learning to Read/Interpret Results category responses. Starting with the first statement, “Statistical outputs are easy to understand”, the p-value for the software type variable is 0.0547 which is very close to < 𝛼 = 0.05. Therefore, it might be
considered as statistically significant. Moreover, in the third statement, “I like interpreting the results than working on programming”, software type and age have significant p-values
[image:21.595.77.481.453.679.2]where software type = 0.0096 < 𝛼 = 0.05 and age=0.0145 < 𝛼 = 0.05.
Table 7. Learning to Read/Interpret Results: p-values of main effects for category responses.
Software
Type Class Type Gender Citizenship Age Major Degree
Statistical outputs are easy
to understand
0.0547 0.4016 0.3954 0.6724 0.2275 0.9944 0.799
Seeing statistical symbols in the results increases
the anxiety
0.1124 0.4430 0.2006 0.3206 0.4162 0.4832 0.3037
I like interpreting the
results than working on programming
0.0096 0.4971 0.1683 0.2905 0.0145 0.9791 0.8571
The results from statistical software are
difficult to understand
0.9025 0.1437 0.2666 0.3175 0.9848 0.0911 0.3917
Statistical outputs take time to interpret
0.4219 0.3097 0.4928 0.1938 0.5888 0.7910 0.9874
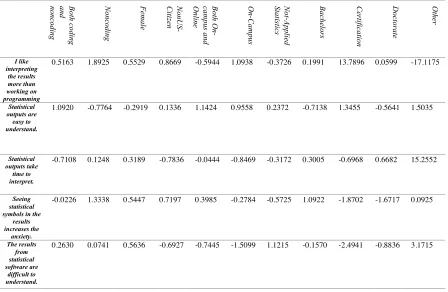
Table 8. Learning to Read/Interpret Results: coefficients table for category responses.
5.
Discussion and Limitations
In this paper, we did a study about anxiety towards learning new statistical software. As mentioned in the above sections there are three categories in the study that we want to test. In the results, we found that software type, gender, major and degree are the most effective factors in Learning Statistical Concepts category. The anxiety towards learning new statistical software would be increased by differences in the four effective factors. Also, software type, gender, and age remarkably impact the Learning Statistical Software category. In the Learning to Read/Interpret Results category, software type and age were the most effective variables.
Despite the fact that the OLR for each response produced statistically significant results, not all factors were statistically significant. The potential reason for this could be a design issue. The survey was distributed to numerous students in different classes, but not all
Bo th c od in g and nonc odi ng No nc od in g Fe m ale No nU S-Ci tiz en Bo th O n-ca m pu s an d On lin e On -Ca m pu s No t-Ap pli ed St at ist ic s Ba ch elo rs Ce rti fic ati on Do cto ra te Ot he r I like interpreting the results more than working on programming
0.5163 1.8925 0.5529 0.8669 -0.5944 1.0938 -0.3726 0.1991 13.7896 0.0599 -17.1175
Statistical outputs are
easy to understand.
1.0920 -0.7764 -0.2919 0.1336 1.1424 0.9558 0.2372 -0.7138 1.3455 -0.5641 1.5035
Statistical outputs take
time to interpret.
-0.7108 0.1248 0.3189 -0.7836 -0.0444 -0.8469 -0.3172 0.3005 -0.6968 0.6682 15.2552
Seeing statistical symbols in the
results increases the
anxiety.
-0.0226 1.3338 0.5447 0.7197 0.3985 -0.2784 -0.5725 1.0922 -1.8702 -1.6717 0.0925
The results from statistical software are difficult to understand.
the students replied with responses. The survey was sent only to the students who took classes with one professor. Also, this was an observational study where the software type and the classes could not be controlled. Moreover, Gliem and Gliem (2003) discussed analysis of single-item in Likert-Type scales is not reliable.
6.
Conclusions and Areas for future research
The purpose of this study was to discover factors affecting statistical anxiety towards learning new statistical software. The survey consisted of questions in three important categories: Learning Statistical Concepts, Learning Statistical Software and Learning to Read/Interpret Results. Each category has multiple statements that were impacted by various factors. Therefore, it appears that the anxiety towards learning new statistical software would be affected by the software type, whether it is coding or noncoding, gender and major
(Applied and Non Applied Statistics).
As mentioned in the discussion and limitations section, there are gaps in this research that might benefit from further research. I would recommend addressing differences in
References
Bland, J. M., & Altman, D. G. (1997). Statistics notes: Cronbach's alpha. Bmj, 314(7080), 572.
Cruise, R. J., Cash, R. W., & Bolton, D. L. (1985, August). Development and validation of an instrument to
measure statistical anxiety. In American Statistical Association Proceedings of the Section on Statistical
Education (Vol. 4, No. 3, pp. 92-97).
DeVaney, T. A. (2010). Anxiety and attitude of graduate students in on-campus vs. online statistics
courses. Journal of Statistics Education, 18(1).
Gennarelli, R., & Goodman, M. S. (2013). measuring internal consistency of community engagement using the
APLHA option of PROC CORR. New England SAS Users Group, 1-7.
Gliem, J. A., & Gliem, R. R. (2003). Calculating, interpreting, and reporting Cronbach’s alpha reliability coefficient for Likert-type scales. Midwest Research-to-Practice Conference in Adult, Continuing, and Community Education.
Hanna, D., Shevlin, M., & Dempster, M. (2008). The structure of the statistics anxiety rating scale: A
confirmatory factor analysis using UK psychology students. Personality and individual differences, 45(1),
68-74.
Kazelskis, R. (1998). Some dimensions of mathematics anxiety: A factor analysis across
instruments. Educational and Psychological Measurement, 58(4), 623-633.
Hopko, D. R., Mahadevan, R., Bare, R. L., & Hunt, M. K. (2003). The abbreviated math anxiety scale (AMAS)
construction, validity, and reliability. Assessment, 10(2), 178-182.
Hosmer, D. W., & Lemeshow, S. (2000). Applied Logistic Regression 2nd edn Wiley-Interscience Publication.
SAS Institute Inc. 2008. SAS/STAT® 9.2 User’s Guide. Cary, NC: SAS Institute Inc.
Spector, P. E. (1992). Summated rating scale construction: An introduction (No. 82). Sage.
Mills, J. D. (2004). STUDENTS'ATTITUDES TOWARD STATISTICS: IMPLICATIONS FOR THE
FUTURE. College Student Journal, 38(3).
Onwuegbuzie, A. J., & Wilson, V. A. (2003). Statistics Anxiety: Nature, etiology, antecedents, effects, and
treatments--a comprehensive review of the literature. Teaching in Higher Education, 8(2), 195-209
Perney, J., & Ravid, R. (1990). The Relationship between Attitudes toward Statistics, Math Self-Concept, Test Anxiety and Graduate Students' Achievement in an Introductory Statistics Course.
Warner, P. (2008). Ordinal logistic regression. BMJ Sexual & Reproductive Health, 34(3), 169-170.
Williams, A. S. (2010). Statistics anxiety and instructor immediacy. Journal of Statistics Education, 18(2).
Williams, A. (2014). An exploration of preference for numerical information in relation to math self-concept
Appendices
Appendix A. Additional Material
Copy of the Survey:
Anxiety towards Learning new statistical
software
Directions: The statements bellow are created to see your level of anxiety towards learning new statistical software. Each statement has 5 different responses. The responses range from 1 (Strongly Disagree) through 3 (Neither Agree nor Disagree) to 5 (Strongly Agree). If you have no answer or opinion chose 3. Please choose only one answer in each statement that represents your opinion. Please respond to all the statements.
1 (1) 2 (2) 3 (3) 4 (4) 5 (5)
Statistics lectures are
easy to
understand. (1)
o
o
o
o
o
I like interpreting the
results more than working
on programming.
(2)
I have less anxiety when working on programming than interpreting the results. (3)
o
o
o
o
o
Studying new statistical software takes
time and effort. (4)
o
o
o
o
o
Statistical outputs are
easy to
understand. (5)
o
o
o
o
o
I feel insecure when I do
some programming
stuff. (6)
o
o
o
o
o
Statistical outputs take
time to
interpret. (7)
o
o
o
o
o
Learning new statistical software increases the anxiety towards statistics. (8)
o
o
o
o
o
I feel under stress when I
write a statistical programming
code. (9)
o
o
o
o
o
Seeing statistical symbols in the
results increases the anxiety. (10)
o
o
o
o
o
Statistical programming languages are
difficult to
o
Q3 What software do you constantly use ? if it is more than one please list them all
________________________________________________________________
understand. (11)
I am afraid of statistics because I didn't learn it
from elementary school like other subjects.
(12)
o
o
o
o
o
I like programming
more than interpreting the
results. (13)
o
o
o
o
o
I prefer spending my
time on programming
than understanding
the statistical concept. (14)
o
o
o
o
o
Statistics program are
easy to understand.
(15)
o
o
o
o
o
The results from statistical
software are difficult to understand.
(16)
Q34 When studying statistics, I attended classes:
o
On-‐Campus only (1)
o
Online only (2)
o
Both (3)
Q4 Gender:
o
Male (1)
o
Female (2)
Q5 Citizenship:
o
US Citizen. (1)
o
Non US Citizen (2)
Q6 Age (in years):
________________________________________________________________
Q7
Choose your major, and if you are already graduated, choose your most recent major
o
Arts/Humanities (1)
o
Biology (2)
o
Chemistry (3)
o
Economics (4)
o
Engineering (5)
o
Statistics (12)
o
Mathematics (6)
o
Medicine/ pre-‐medicine (7)
o
Psychology (8)
o
Sociology / Social Work (9)
o
Mangement (10)
o
Other (11)
Q8 If your major is statistics please specify the area of interest.
o
Theoretical Statistics (1)
o
Applied statistics (2)
Q9 Degree you are currently seeking, and if you are already graduated, choose your most recent degree
o
Associate (1)
o
Bachelors (2)
o
Master (3)
o
Doctorate (4)
o
Certification (5)
o
Post-‐bachelor's Licensure (6)
o
Specialist (7)
o
Other (8)
Q10 Please write any comment that you want us to know
________________________________________________________________
Appendix B. Results Material
Table B1. Analysis of Cronbach's alpha for questions in the learning category.
Table B2. Analysis of Cronbach's alpha for questions in the programming category.
Appendix C. Coding Material
Part (1) Codes for Cronbach's alpha:
PROC print DATA=WORK.Anxiety2; RUN;
* programming;
proc corr data=WORK.Any2 alpha nomiss;
var Q2_3 Q2_6 Q2_9 Q2_11 Q2_13 Q2_14 ;
run;
*learning;
proc corr data=WORK.Any2 alpha nomiss; var Q2_1 Q2_4 Q2_8 Q2_12;
run;
*Interpreting;
Part (2) Codes for Ordinal Logistic Regression:
PROC print DATA=WORK.Any;run;
data Any2;
set any(drop=AA AB AC AD AE AF AG AH AI AJ AK AL AM AN AO AP AQ AR AS AT AU AV AW AX AY AZ BA BB BC BD BE BF BG BH BI BJ BK BL BM BN)
; run;
proc contents data=Any2;run;
proc print data=any2;run;
* discriptive;
proc sort data=any2;by q3;run;
proc freq data=any2;by q3; run; *Q1;
proc logistic data=Any2 descending plots=effectplot;
class Q3 (ref="Coding" param=ref) Q4 (ref="Male" param=ref) Q5 (ref="US_Citizen" param=ref)
Q34(ref="Online" param=ref) QQ8 (ref="Applied_statistics" param=ref) Q9(ref="Master" param=ref);
model Q2_1 = Q3|Q4|Q5|Q34|QQ8|Q9 @2 / clparm=pl lackfit aggregate rsquare scale=D;
run; quit;
proc glmselect data=Any2 ;
class Q3 (ref="Coding" param=ref) Q4 (ref="Male" param=ref) Q5 (ref="US_Citizen" param=ref)
Q34(ref="Online" param=ref) QQ8 (ref="Applied_statistics" param=ref) Q9(ref="Master" param=ref);
model Q2_1= Q3 Q4 Q5 Q34 QQ8 Q9/ selection = stepwise(select=AIC);
run; quit;
*Q2;
proc logistic data=Any2 descending plots=effectplot;
class Q3 (ref="Coding" param=ref) Q4 (ref="Male" param=ref) Q5 (ref="US_Citizen" param=ref)
Q34(ref="Online" param=ref) QQ8 (ref="Applied_statistics" param=ref) Q9(ref="Master" param=ref);
run; quit;
*Q3;
proc logistic data=Any2 descending plots=effectplot;
class Q3 (ref="Coding" param=ref) Q4 (ref="Male" param=ref) Q5 (ref="US_Citizen" param=ref)
Q34(ref="Online" param=ref) QQ8 (ref="Applied_statistics" param=ref) Q9(ref="Master" param=ref);
model Q2_3 = Q3 Q4 Q5 Q34 QQ8 Q9/ clparm=pl lackfit scale=D; run;
quit;
*Q4;
proc logistic data=Any2 descending plots=effectplot;
class Q3 (ref="Coding" param=ref) Q4 (ref="Male" param=ref) Q5 (ref="US_Citizen" param=ref)
Q34(ref="Online" param=ref) QQ8 (ref="Applied_statistics" param=ref) Q9(ref="Master" param=ref);
model Q2_4 = Q3 Q4 Q5 Q34 QQ8 Q9/ clparm=pl lackfit scale=D; run;
quit;
*Q5;
proc logistic data=Any2 descending plots=effectplot;
class Q3 (ref="Coding" param=ref) Q4 (ref="Male" param=ref) Q5 (ref="US_Citizen" param=ref)
Q34(ref="Online" param=ref) QQ8 (ref="Applied_statistics" param=ref) Q9(ref="Master" param=ref);
model Q2_5 = Q3 Q4 Q5 Q34 QQ8 Q9/ clparm=pl lackfit scale=D; run;
quit;
*Q6;
proc logistic data=Any2 descending plots=effectplot;
class Q3 (ref="Coding" param=ref) Q4 (ref="Male" param=ref) Q5 (ref="US_Citizen" param=ref)
Q34(ref="Online" param=ref) QQ8 (ref="Applied_statistics" param=ref) Q9(ref="Master" param=ref);
model Q2_6 = Q3 Q4 Q5 Q34 QQ8 Q9/ clparm=pl lackfit scale=D; run;
quit;
*Q7;
proc logistic data=Any2 descending plots=effectplot;
class Q3 (ref="Coding" param=ref) Q4 (ref="Male" param=ref) Q5 (ref="US_Citizen" param=ref)
Q34(ref="Online" param=ref) QQ8 (ref="Applied_statistics" param=ref) Q9(ref="Master" param=ref);
run; quit;
*Q8;
proc logistic data=Any2 descending plots=effectplot;
class Q3 (ref="Coding" param=ref) Q4 (ref="Male" param=ref) Q5 (ref="US_Citizen" param=ref)
Q34(ref="Online" param=ref) QQ8 (ref="Applied_statistics" param=ref) Q9(ref="Master" param=ref);
model Q2_8= Q3 Q4 Q5 Q34 QQ8 Q9/ clparm=pl lackfit scale=D; run;
quit;
*Q9;
proc logistic data=Any2 descending plots=effectplot;
class Q3 (ref="Coding" param=ref) Q4 (ref="Male" param=ref) Q5 (ref="US_Citizen" param=ref)
Q34(ref="Online" param=ref) QQ8 (ref="Applied_statistics" param=ref) Q9(ref="Master" param=ref);
model Q2_9= Q3 Q4 Q5 Q34 QQ8 Q9/ clparm=pl lackfit scale=D; run;
quit;
*Q10;
proc logistic data=Any2 descending plots=effectplot;
class Q3 (ref="Coding" param=ref) Q4 (ref="Male" param=ref) Q5 (ref="US_Citizen" param=ref)
Q34(ref="Online" param=ref) QQ8 (ref="Applied_statistics" param=ref) Q9(ref="Master" param=ref);
model Q2_10= Q3 Q4 Q5 Q34 QQ8 Q9/ clparm=pl lackfit scale=D; run;
quit;
*Q11;
proc logistic data=Any2 descending plots=effectplot;
class Q3 (ref="Coding" param=ref) Q4 (ref="Male" param=ref) Q5 (ref="US_Citizen" param=ref)
Q34(ref="Online" param=ref) QQ8 (ref="Applied_statistics" param=ref) Q9(ref="Master" param=ref);
model Q2_11= Q3 Q4 Q5 Q34 QQ8 Q9/ clparm=pl lackfit scale=D; run;
quit;
*Q12;
proc logistic data=Any2 descending plots=effectplot;
class Q3 (ref="Coding" param=ref) Q4 (ref="Male" param=ref) Q5 (ref="US_Citizen" param=ref)
Q34(ref="Online" param=ref) QQ8 (ref="Applied_statistics" param=ref) Q9(ref="Master" param=ref);
model Q2_12= Q3 Q4 Q5 Q34 QQ8 Q9/ clparm=pl lackfit scale=D; run;
*Q13;
proc logistic data=Any2 descending plots=effectplot;
class Q3 (ref="Coding" param=ref) Q4 (ref="Male" param=ref) Q5 (ref="US_Citizen" param=ref)
Q34(ref="Online" param=ref) QQ8 (ref="Applied_statistics" param=ref) Q9(ref="Master" param=ref);
model Q2_13= Q3 Q4 Q5 Q34 QQ8 Q9/ clparm=pl lackfit scale=D; run;
quit;
*Q14;
proc logistic data=Any2 descending plots=effectplot;
class Q3 (ref="Coding" param=ref) Q4 (ref="Male" param=ref) Q5 (ref="US_Citizen" param=ref)
Q34(ref="Online" param=ref) QQ8 (ref="Applied_statistics" param=ref) Q9(ref="Master" param=ref);
model Q2_14= Q3 Q4 Q5 Q34 QQ8 Q9/ clparm=pl lackfit scale=D; run;
quit;
*Q15;
proc logistic data=Any2 descending plots=effectplot;
class Q3 (ref="Coding" param=ref) Q4 (ref="Male" param=ref) Q5 (ref="US_Citizen" param=ref)
Q34(ref="Online" param=ref) QQ8 (ref="Applied_statistics" param=ref) Q9(ref="Master" param=ref);
model Q2_15= Q3 Q4 Q5 Q34 QQ8 Q9/ clparm=pl lackfit scale=D; run;
*Q16;
proc logistic data=Any2 descending plots=effectplot;
class Q3 (ref="Coding" param=ref) Q4 (ref="Male" param=ref) Q5 (ref="US_Citizen" param=ref)
Q34(ref="Online" param=ref) QQ8 (ref="Applied_statistics" param=ref) Q9(ref="Master" param=ref);
model Q2_16= Q3 Q4 Q5 Q34 QQ8 Q9/ clparm=pl lackfit scale=D; run;