THE
AUSTRALIAN NATIONAL UNIVERSITY
FACULTY
OF ENGINEERING AND INFORMATION
TECHNOLOGY
PREDICTIVE MAINTENANCE
IN A
TELECOMMUNICATION NETWORK
Daryl
Raymond Read
April,
2000
Declaration
This thesis contains no material which has been previously accepted for the award of any other degree or diploma in any university, institute or college, and contains no material previously published or written by another person, except where due reference is made.
Canberra, March 2000.
Daryl Read
Department of Engineering
Faculty of Engineering and Information Technology
Acknowledgements
There are many people that I would like to thank for their support of my work.
Firstly I would like to thank Dr Brenan McCarragher for his patience and understanding. I am very grateful for the confidence, support, knowledge and friendship he has so generously shared during my time at the ANU.
I would also like to thank Wendy for being so supportive. I could not have done this without her friendship, love and understanding.
A big thanks to Mum, Dad, Wayne and Brendan for supporting my decisions and
providing a strong and encouraging foundation for me to grow.
Thanks also to David Aitken, John Clark, Murray Blackwell and Graham Stockwell for
being so unselfish with their time and knowledge. Also thank you to Telstra for their financial support.
Finally, thank you to Barry Newell, Josephine Farmer. Sharon Goddard, Sue Cameron, Paul Stacy, Ying Guo, Zisi Liu, and Paul Malcolm for their friendship, advice and help
Abstract
This thesis is motivated by the need to explore more effective ways of maintaining a telecommunications network. Specifically we study a predictive maintenance approach that predicts which network problems customers will report in the future. To determine the operating conditions required to successfully operate a predictive maintenance scheme Telstrá s customer access network (CAN) maintenance system has been analysed and modelled as a stochastic discrete event queuing network.
An analysis of fault marked (FM) and fault blocked (FB) data to determine its suitability for predictive maintenance is presented. This analysis determines the percentage of FM/FB lines that correctly predict future customer trouble reports (TRs)
(denoted the predictive power) and examines the ability of certain FM/FB
characteristics to increase predictive power. The percentage of the mean daily TR volume that is predicted, and could possibly be prevented, is calculated along with the distributions of the delay between a FM/FB arrival and the arrival of the TR it predicts.
In an attempt to explain the low predictive power of FB lines an analysis into the consistency of FB lines is conducted. We also examine the relationship between the
number of times a line is FB and its predictive power.
Telstrá s CAN maintenance system model is simulated to determine the requirements of FM/FB data such that a predictive maintenance scheme could be used to improve the system's performance. System performance is evaluated by four performance measures:
i) customer trouble report (TR) volume; ii) mean TR system time; iii) maintenance workload; and iv) number of TRs that miss a predefined system time cut -off. These measures are used to compare the performance of the model under different operating conditions.
If Telstra is able to identify the TRs that are predicted by each FM/FB, when a mean of two TRs result from a single FM/FB, a No Priority maintenance scheme reduces all performance measures with a minimum predictive power of 51 %.
To reduce the mean TR system time and to reduce the number of times Telstra miss a
customer service guarantee (CSG) repair time an Estimated Time to Fix (ETF) Priority scheme is introduced. We show that with a system cut -off time of 16 hours the ETF Priority scheme is able to reduce all performance measures with a minimum predictive power of 50 %. It is shown that this scheme is able to reduce the number of TRs that have a system time greater than 16 hours by approximately 87 %. We also investigate the sensitivity of system performance to variations in the cut -off time and discover that
Glossary of terms
ACE Alarm Correlation Engine.
Developed by GTE and discussed in [24].
AI Artificial Intelligence.
ANSS
APCAMS
AXE
BT
C &C
CAN
Access Network Support System.
Used by British Telecom and discussed in [17].
Automatic Pressurised Cable Monitoring System.
Used by Telstra and discussed in [9].
Exchanges produced by Ericsson that report Fault Marked and
Fault Blocked data.
British Telecom.
Commercial and Consumer. A division of Telstra that are responsible for the customer access network (CAN).
Customer Access Network. The part of the network between
an exchange and a customer's premises.
CANES Customer Access Network Evaluation Scheme. Used by Telstra and discussed in [11].
CLIQ Test Customer Line Insulation Quality Test.
CPE Customer Premises Equipment.
CSG Customer Service Guarantee.
DES Discrete Event System.
DIRECTOR System which automates the programming and despatch of work to the field staff.
ETF Estimated Time to Fix. A type of maintenance priority scheme based on the estimated time to fix UTR faults.
FieIdMATE Field Mobile Access Terminal Equipment.
FIFO First In First Out. A type of queuing priority scheme.
FM Fault Marked. A customer line that has an insulation resistance greater than 20 kS2 but equal to or less than 50 kQ2.
FM /FB Both Fault Marked and Fault Blocked.
GAs Genetic Algorithms.
GTE General Telephone and Electric. A global telecommunications company.
LEN Inter Exchange Network. The cable that connects Telstra's
exchanges.
INE Intelligent Network Element. Discussed by Pierce in [ 14].
LIFO Last In First Out. A type of queuing priority scheme.
MDF Main Distribution Frame. The boundary point between an exchange and the customer acces.:network (CAN).
NBP Network Boundary Point. The boundary between the CAN
and the customer premises equipment (CPE). Usually defined
as the first telephone socket on a customer's premises.
NTG
PTR
QoS
TADS
ToW
TR
Network and Technology Group. A division of Telstra that is responsible for the maintenance of exchanges and the inter exchange network.
Predictable Trouble Report. A TR that has been predicted by
FM/FB data.
Quality of Service.
Testing And Diagnosis Server. Contains the database that
stores FM/FB data once it has been downloaded from AXE exchanges.
Ticket of Work.
Notation
and
Definitions
#FM/FB
#PTR
#TOTAL
#UTR
ß
The mean number of FM/FBs generated per unit time.
The mean number of PTRs generated per unit time.
The mean number of TRs generated per unit time.
The mean number of UTRs generated per unit time.
The mean number of common cause TRs predicted per correct FM/FB.
p
The overall mean time that faults are fixed by the maintenance system.The mean inter -arrival time of FM/FB faults.
The mean time that worker i takes to fix a fault.
The mean inter -arrival time of unpredictable trouble reports.
Denotes the arrival of the ith fault.
Denotes the departure of the ith fault.
Number of workers in the model. BFM/FB
Ft
BUTR
a;
di
n
PP
QLength
Predictive power. The percentage of FM/FB lines that are seen as
TRs within 3 weeks of becoming FM/FB.
The current length of the queue. If a fault is arriving it is the
Table of Contents
Declaration i
Acknowledgments ii
Abstract
iiiGlossary of terms y
Notation viii
List of Figures xii
List of Tables xvi
1 THE ROLE OF FAULT PREDICTION IN A TELECOMMUNICATIONS
MAINTENANCE SYSTEM 1
2
LITERATURE
SURVEY 92.1 SYSTEM MODELLING AND SIMULATION 10
2.2 FAULT IDENTIFICATION AND CORRELATION 11
2.3 PREDICTIVE MAINTENANCE 12
2.4 NETWORK MANAGEMENT 15
3 TELSTRA'S CURRENT NETWORK MAINTENANCE SYSTEM 17
3.1 A GENERAL DESCRIPTION OF FAULT MANAGEMENT
SYSTEMS 18
3.2 THE CUSTOMER ACCESS NETWORK (CAN) 20
3.3 WHAT METHODS OF FAULT DETECTION ARE USED? 22
3.3.1 Customer reported faults 23
3.3.2 Data used to predict future customer TRs 24
3.4 SCHEDULING AND FIXING FAULTS 27
3.5 PREDICTIVE MAINTENANCE AND TELSTRA'S CURRENT
4 ANALYSIS OF FAULT MARK (FM) AND FAULT BLOCK (FB) DATA.. 29
4.1 THE "PREDICTIVE POWER" OF FM/FB DATA 30 4.1.1 Identifying characteristics to improve predictive power 30 4.2 WHAT PERCENTAGE OF THE DAILY TR VOLUME CAN BE
PREDICTED? 34
4.3 ANALYSIS OF THE DELAY BETWEEN THE ARRIVAL OF A FM/FB
AND THE ARRIVAL OF THE PREDICTED TR 35
4.4 ANALYSIS OF THE CONSISTENCY OF FB LINES 37 4.5 ANALYSIS OF THE RELATIONSHIP BETWEEN THE NUMBER OF
TIMES A LINE IS FB AND THE PREDICTIVE POWER 38
4.6 SUMMARY OF FM/FB DATA ANALYSIS 41
5
MODELLING TELSTRA'S
CAN MAINTENANCE SYSTEM 435.1 SYSTEM MODELLING - THE FIRST STEP 44
5.2 CLASSIFYING A MODEL OF TELSTRA'S CAN MAINTENANCE
SYSTEM 44
5.3 MODELLING THE FIELD STAFF AND THE FAULT FIXING
PROCESS 47
5.4 DEFINING MODEL PARAMETERS 48
5.4.1 Calculating the mean UTR inter- arrival time 49 5.5 MODELLING THE RELATIONSHIP BETWEEN FM/FB AND PTR 51
5.6 MODELLING THE QUEUE AND FAULT DESPATCH SYSTEM 52
5.6.1 Different prioritisation schemes 53
5.7 MODEL ASSUMPTIONS 58
5.8 PERFORMANCE MEASURES 60
5.9 SIMULATING THE MODEL OF TELSTRA'S CAN MAINTENANCE
SYSTEM 62
5.10 SUMMARY OF MODELLING TELSTRA'S CAN MAINTENANCE
SYSTEM 67
6
IDENTIFICATION
OF OPERATING CONDITIONS THATIMPROVE SYSTEM PERFORMANCE 69
6.1.1 Reducing TR volume 71
6.1.2 Reducing maintenance workload 73
6.1.3 Reducing mean TR system time 74
6.1.4 The effect of varying /3 75
6.1.5 Different maintenance priority schemes 77
6.1.6 Experiment one conclusions 80
6.2 EXPERIMENT 2: SYSTEM PERFORMANCE WHEN PTRs ARE CLEARED WITH THE FM/FBs THAT PREDICT THEM 82
6.2.1 Reducing TR volume 83
6.2.2 Reducing maintenance workload 85
6.2.3 Reducing mean TR system time 88
6.2.4 The effect
of
varying ß 896.2.5 Different maintenance priority schemes 90
6.2.6 Experiment two conclusions 93
6.3 EXPERIMENT 3: ANALYSIS OF ESTIMATED TIME TO FIX (ETF)
PRIORITY SCHEME 95
6.3.1 Reducing TR volume 96
6.3.2 Reducing maintenance workload 97
6.3.3 Reducing mean TR system time 98
6.3.4 Reduce the number of TRs that have a system time
greater
thana predefined cut -off 100
6.3.5 Sensitivity of ETF Priority scheme to the system time cut -off 103
6.3.6 Experiment three conclusions 106
7 CONCLUSION 109
7.1 FM/FB DATA ANALYSIS 110
7.2 MODELLING AND SIMULATING TELSTRA'S CAN
MAINTENANCE SYSTEM 112
REFERENCES 115
APPENDIX A 119
List of
Figures
Figure 1.1: An example of how a fault at a shared network element may affect
multiple customers 3
Figure 1.2: A desired cycle of operation that could be produced by predictive
maintenance 6
Figure 3.1: Effects of customer and supplier fault detection 19
Figure 3.2: A typical representation of Telstra's Customer Access Network 20
Figure 3.3: The distribution of the CAN through pillars and joints. 22
Figure 3.4: Processing customer TRs. From reporting a fault to despatching to the
field 23
Figure 3.5: The FM/FB testing procedure 26
Figure 4.1: The separation of FM /FB data into groups with specific characteristics 31
Figure 4.2: The predictive power of different characteristics of FM/FB data 32
Figure 4.3: Predictive power of the tickets of work (ToWs) for each group 33
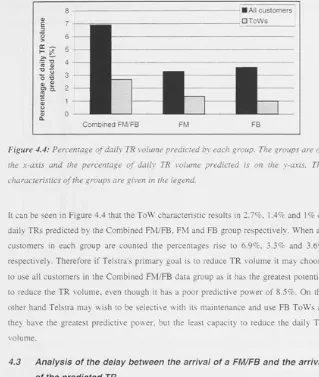
Figure 4.4: Percentage of daily TR volume predicted by each group 35
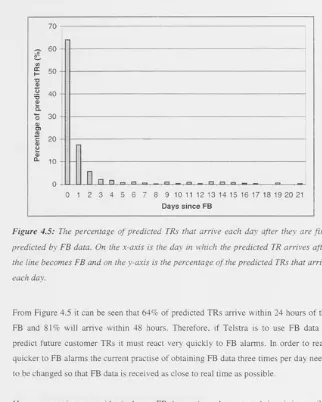
Figure 4.5: The percentage of predicted TRs that arrive each day after they are
first predicted by FB data 36
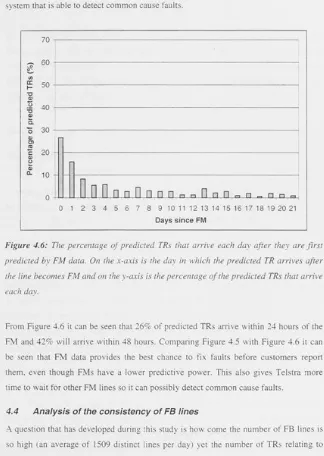
Figure 4.6: The percentage of predicted TRs that arrive each day after they are
first predicted by FM data 37
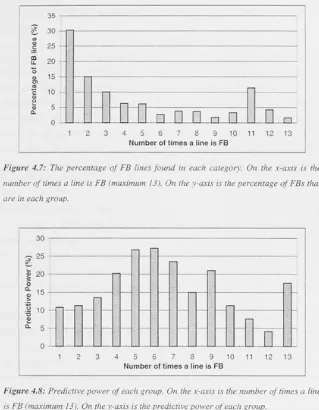
Figure 4.7: The percentage of FB lines found in each category 39
Figure 4.8: Predictive power of each group 39
Figure 5.1: A single server queuing system 45
Figure 5.2: State transitions in a fault management system 46
Figure 5.3: System model of Telstrás CAN maintenance system 47
Figure 5.5: PTR generation process 52
Figure 5.6: Example of a TR priority queue 54
Figure 5.7: Illustrating the cut -off point in every queue 55
Figure 5.8: Decision process to prioritise an arriving UTR with an ETF greater
than or equal to the cut -off 57
Figure 5.9: Example of the prioritisation of UTRs when their ETF is greater
than the cut -off. 58
Figure 5.10: Telstra's CAN maintenance system modelled in ExtendTM 63
Figure 5.11: Composition of the Telstra field worker block. 64
Figure 5.12: Composition of the Fault Generator block 65
Figure 5.13: A comprehensive model of Telstra's CAN maintenance system 67
Figure 6.1: Predictive power required to reduce TR volume 72
Figure 6.2: Predictive power required to reduce maintenance workload 73
Figure 6.3: Predictive power required to reduce
rnon
TR system time 74Figure 6.4: Predictive power required to reduce mean TR system time for
different S 76
Figure 6.5: Predictive power required to reduce maintenance workload for each
maintenance priority scheme 78
Figure 6.6: Predictive power required to reduce mean TR system time for each
maintenance priority scheme 79
Figure 6.7: The minimum predictive power required to reduce each performance
measure when /3 equals 2 81
Figure 6.8: Predictive power required to reduce TR Volume when matching
FM/FBs with the PTRs they predict 83
Figure 6.9: Predictive power required to reduce TR Volume when matching
FM/FBs with the PTRs they predict 84
Figure 6.10: Predictive power required to reduce maintenance workload when
matching FM/FBs with the PTRs they predict 85
Figure 6.11: Predictive power required to reduce maintenance workload for
Figure 6.12: Predictive power required to reduce mean TR system time when
matching FM/FBs with the PTRs they predict 88
Figure 6.13: Predictive power required to reduce mean TR system time for
different /3 when FM/FBs are matched with the PTRs they predict 89
Figure 6.14: Predictive power required to reduce maintenance workload for each
maintenance priority scheme when matching FM/FBs with the PTRs
they predict 90
Figure 6.15: Predictive power required to reduce mean TR system time for each
maintenance priority scheme when FM/FBs are matched with the
PTRs they predict 91
Figure 6.16: A break down of the TR volume for FM/FB Priority and No Priority
schemes. 92
Figure 6.17: A break down of the mean TR system time for the FM /FB Priority
and No Priority schemes. 93
Figure 6.18: The minimum predictive power required to reduce maintenance
workload and mean TR system time when /3 equals 2 95
Figure 6.19: Predictive power required to reduce TR volume 97
Figure 6.20: Predictive power required to reduce maintenance workload 98
Figure 6.21: Predictive power required to reduce mean TR system time 99
Figure 6.22: A break down of the mean TR system time for the FM/FB Priority,
No Priority and ETF Priority schemes 100
Figure 6.23: Number of TRs that have a system time greater than 16 hours 101
Figure 6.24: Number of PTRs that have a system time greater than 16 hours 102
Figure 6.25: Number of UTRs that have a system time greater than 16 hours 102
Figure 6.26: Sensitivity of mean TR system time to variations in UTR system time
cut -off 104
Figure 6.27: The sensitivity of the number of TRs with a system time greater than the cut -off to variations in cut -off time 105
Figure 6.28: The reduction in the number of TRs that miss a system time cut -off 106
Figure 6.29: The minimum predictive power required to reduce each performance
Figure A.1: Probability distribution of the number of PTRs generated for each
correct FM/FB when ß equals two 120
Figure A.2: Probability distribution of the number of PTRs generated for each correct FM /FB when
ß
equals three 120 Figure A.3: Probability distribution of the number of PTRs generated for eachcorrect FM /FB when ß equals four 121
List of
Tables
Table 4.1: Analysis to determine the consistency of FB lines 38
Table 5.1: Model assumptions 59
Chapter
1
As we reach the beginning of a new century of technological advances, deregulation of the telecommunications industry and customer expectations are rapidly changing the way that many telecommunications companies do business. Australia's Telstra is one such company investigating ways to improve its position in the market by using advanced technologies to upgrade services to customers. Telstra is Australia's largest telecommunications company. It has a customer base of 6.9 million residential lines and 2.7 million business lines and its network carries around 15 billion calls a year [21]. A key area in which Telstra is significantly able to improve service is network maintenance.
A traditional network maintenance approach, one that is still used by Telstra today, is to rely on customers to detect and report network problems. We call this a reactive maintenance scheme as companies 'react' to customer reported problems. It is hypothesised that Telstra's reactive maintenance approach is a legacy from days when it monopolised Australia's telecommunications market and basic network monitoring equipment was very primitive and expensive. The greatest advantage of a reactive maintenance scheme is that only customer affecting faults are attended. This means that resources are not wasted correcting problems that customers will not detect. Another advantage is that network monitoring and testing equipment does not need to be purchased, operated and maintained.
However, relying on customers to detect and report faults is no longer an efficient method of network management. Firstly, technological advances in all aspects of daily life have meant that Australian customers are less tolerant of faults and poor service.
Different customers will have different expectations of the telephone service they receive. When some customers detect a problem with their phone they may not be too
reactive maintenance system telecommunications companies are rarely able to identify
faults that are related by a common cause. Often a number of faults will result from a single common fault as can be seen in Figure 1.1.
Figure
Id:
An example of how afault
at a shared network element may affect multiple customers.If there is a fault at node 'A' then the three customers on the left of Figure 1.1 will all experience problems. When they detect these problems they will each individually call
their telecommunications provider to report a fault with their service. By having a reactive maintenance scheme, the company only becomes aware of faults when each customer reports them. These customer reports may not be made at the same time; they may be made over the course of several days. Therefore when the company receives the first call it will send a worker to fix that fault. It will then receive a second call and another worker will be sent to fix that fault, and similarly with the third fault. This example demonstrates how costly a reactive maintenance scheme can be as three workers are sent to fix a fault that could have been fixed by a single worker.
If the telecommunications company itself were able to detect network faults it may have
already been taken to rectify it. This would increase customer confidence, and also reduce waiting time for service restoration.
A common method that tries to prevent network faults from occurring is proactive maintenance. To be proactive is to perform a task before it is required. In a telecommunications environment, proactive maintenance means fixing network problems before they become network problems. In other words, ensuring that faults do
not arise in the network. Proactive maintenance usually involves regular servicing of network elements and replacing or upgrading parts of the network that have a high likelihood of failing. An advantage of proactive maintenance is that it prevents many faults from occurring, which results in fewer dissatisfied customers and reduces the costs of reactively repairing faults. However proactive maintenance can be relatively costly as network elements are replaced or serviced when they are not faulty. Another problem is that tampering with a telecommunications network often increases the likelihood of a fault occurring. This is because telecommunications networks are a complex web of electrical components and while servicing one part of the network a worker may inadvertently affect another part. Also wñen a customer affecting fault does occur in the network proactive maintenance does not prevent that customer from reporting the fault.
occupies resources that could be used to fix genuine faults reported by customers, thus increasing customer waiting time. Predictive maintenance should not be confused with proactive maintenance. Predictive maintenance does not prevent faults from occurring. It simply predicts which faults customers will report and attempts to correct these faults before customers detect the problem.
In this thesis the performance of three predictive maintenance schemes is compared against the performance of a reactive maintenance scheme. These three schemes use prioritisation rules so that different fault types are prioritised under different conditions.
The performance of each scheme is measured by three performance measures: 1) the TR
volume, which is the number of customer TRs received over a period of time; 2) the maintenance workload, which is the number of faults that the field staff must fix; and 3) the mean TR system time, which is the average time a customer TR must wait between being reported and being fixed.
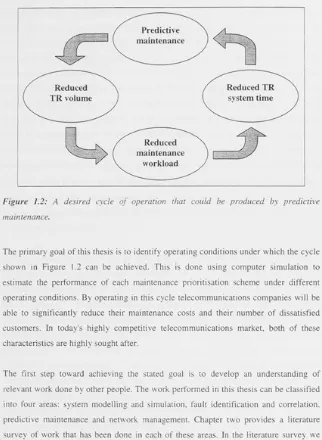
If all three performance measures can be reduced, a continuous cycle of operation may be achieved. A reduction in TR volume may reduce the maintenance workload; this depends on the percentage of false alarms and the number of common cause faults. If this occurs then a reduction in TR volume and maintenance workload may also lead to a
reduced TR system time. When all three performance measures are reduced field workers have more time for predictive maintenance and the cycle starts again. This
Reduced TR volume
\J
Predictive
\
maintenanceReduced maintenance
workload
[image:23.390.38.360.29.469.2]Reduced TR system time
Figure
1.2: A desired cycle of operation that could be produced by predictive maintenance.The primary goal of this thesis is to identify operating conditions under which the cycle shown in Figure 1.2 can be achieved. This is done using computer simulation to estimate the performance of each maintenance prioritisation scheme under different operating conditions. By operating in this cycle telecommunications companies will be able to significantly reduce their maintenance costs and their number of dissatisfied customers. In today's highly competitive telecommunications market, both of these characteristics are highly sought after.
The first step toward achieving the stated goal is to develop an understanding of relevant work done by other people. The work performed in this thesis can be classified into four areas: system modelling and simulation, fault identification and correlation, predictive maintenance and network management. Chapter two provides a literature survey of work that has been done in each of these areas. In the literature survey we look at the contributions of various authors and discuss the relevance of their work to the work presented in this thesis.
current operation of Telstra's fault management system. The chapter begins with a
description of a general fault management system, highlighting the implications of customer detected faults. Then Telstra's Customer Access Network (CAN), which is the part of the network with which this work is concerned, is described. This is followed by a comparison of two methods of fault detection, one reactive and the other predictive, currently available to Telstra. The reactive method of fault detection relies on customers to report faults while the predictive method uses Fault Marked (FM) and Fault Blocked (FB) data available from some of Telstra's exchanges. FM and FB are classifications given to a customer's line according to its insulation resistance. The cut -off insulation resistances for FMs and FBs are variable but Telstra's current rules are: if a line has an
insulation resistance equal to or less than 20 kS2 then it is FB; if a line has an insulation
resistance equal to or less than 50 k52 but greater than 20
kn
it is FM. Advantages and disadvantages of each method are discussed. Finally, an explanation of the process thatis used to assign field workers to fix the faults and how the faults are cleared from
Telstra's records is given.
Before Telstra can implement a predictive maintenance scheme using FM /FB data it must first understand the dynamics and limitations of this data. Chapter four analyses historical FM/FB and TR data to develop an understanding of how FM/FB data may best be used in a predictive maintenance scheme. An essential element of predictive maintenance is knowing the accuracy of the TR predictions. We call the percentage of FM /FBs that accurately predict future TRs the predictive power. By analysing historic FM/FB and TR data we calculate the predictive power of FB lines and FM lines to be 11.8% and 7.7% respectively. To increase these values we analyse FM/FB lines to
identify the characteristics of lines that are most likely to predict future customer TRs.
We also determine what percentage of the daily TR volume can be predicted, and possibly prevented, by a predictive maintenance scheme using FM /FB data. The time between when a line is first FM/FB and when it is reported by customers is critical as it
number of times a line is FB and its predictive power and we discuss why this result can not be practically used by Telstra.
To achieve the cycle of operation shown in Figure 1.2 we must model Telstra's CAN maintenance system and define the maintenance priority schemes that we will use. Both
of these are achieved in chapter five. We model Telstra's CAN maintenance system as a stochastic discrete event queuing network. A system model of Telstra's CAN maintenance system is presented and the implications of modelling the system in this way are discussed. The system model that we have created demonstrates a relationship between FM/FB and TR data that has not been understood before now. This relationship takes into account predictive power, mean number of common cause faults and the delay between the arrival of a FM /FB and the arrival of the TR(s) it predicts. The performance measures that are used in the simulation analysis are presented along with the maintenance priority schemes. Finally we discuss why simulation is used to evaluate the performance of our model and how this is achieved.
In chapter six we present the simulation analysis, which is divided into three separate experiments. The first experiment does not clear predicted TRs from the queue when the FM/FB that predicts them is fixed. This is analogous to Telstra not being able to identify which TRs have been predicted by which FM/FBs. This was done to initially
keep the simulation simple so that the results may be interpreted and understood. In this experiment we determine the maintenance priority scheme, predictive power and mean number of common cause faults that reduce the TR volume, the maintenance workload and the mean TR system time with the lowest predictive power. The second experiment does match FM/FBs with the TRs they predict. The results from this analysis are compared with the results from experiment one and the implications of clearing predicted TRs with the FM /FBs that predict them are highlighted. The final experiment analyses the performance of an Estimated Time to Fix (ETF) Priority scheme. This experiment is designed to minimise the number of times Telstra do not meet a Customer Service Guarantee (CSG), as well as to help reduce the mean TR system time. Again we determine the maintenance priority scheme that reduces the TR volume, the
maintenance workload and the mean TR system time with the lowest predictive power.
Chapter
2
The areas of study in this project can be divided into four key areas: system modelling and simulation, fault identification and correlation, predictive maintenance, and network
management. The following literature survey presents the contributions of various authors to these areas and discusses the relevance of this thesis in light of their work.
2.1 System
modelling
andsimulation
System modelling is a valuable engineering tool that has been used to help understand and solve real world problems for many years. Waller, Triscari and Owens [23] explain how modelling can be utilised in large engineering projects. The authors demonstrate a
use for modelling in the various stages of a project life -cycle such as risk reduction, design, technical performance measurement, verification and validation, test, evaluation and acceptance, technical transfer and research and development. In terms of our project, our model is used in the risk reduction process, the design process, and the research and development process.
In discrete event system (DES) modelling there are two common methods for determining system performance: analytical equations and computer simulation. Analytical models are discussed by both Cassandras [4] and Buzacott and Shanthikumar
[3]. Cassandras looks at modelling DES using both Markov chain theory and general queuing theory while Buzacott and Shanthikumar use queuing theory to analyse specific
manufacturing systems. Cassandras explains the importance and applications of DES in more detail than Buzacott and Shanthikumar who primarily solve many different stochastic manufacturing models. In our project we do not use analytical models as they are restrictive in the types of systems and problems they can solve. We can not define a set of analytical equations that accurately describe our system's behaviour as our analysis requires us to monitor and make decisions upon specific random events. For
example when a FM/FB fault is fixed we need to know which TRs have a common cause so that they can be fixed along with the FM/FB. Therefore, we use computer simulation to evaluate the performance of our model. Cassandras introduces the reader
to DES simulation and discusses simulation of queuing systems. Cassandras and
2.2
Fault identification and correlation
Communications networks are very complex systems composed of thousands of interconnected nodes from various manufacturers. Therefore when network failures occur it is possible that a very large number of alarm messages are generated. These alarms can be used to establish the location and cause of the fault but at the same time the high volume can make this extremely difficult. As a result fault identification and
correlation based on network alarms has become a high priority for many telecommunications companies.
Fault identification consists of three phases: fault detection, fault localisation and fault testing. Bouloutas, Calo and Finkel [1] and Katzela and Schwartz [10] are primarily concerned with fault localisation. Both present a dependency graph based approach that utilises algorithms to solve the alarm correlation and fault identification problem. Meira and Nogueira [12] propose a general model for a telecommunication network so that they can study network management applications, specifically in the development of models for alarm correlation.
Another approach to fault correlation is to utilise artificial intelligence (AI) techniques. AI techniques such as neural networks can be effectively used in the alarm correlation domain. They are adaptive systems with a parallel architecture that can learn and generalise from input data. One advantage is that neural networks can often recognise patterns even when the input data is noisy, corrupted or has a lot of variation. The disadvantage is that they require intensive training before being able to associate an output pattern with a given input pattern. This is not always convenient in a telecommunications environment where all the alarm signatures of fault occurrences
may not be known. The work performed by Wu, Bhatnagar, Epshtein, Bhandaru and Shi [24] describes a system called the alarm correlation engine (ACE) that is used by GTE
in its US local exchange networks. ACE aids network management by correlating alarms on the basis of common cause. It also has the capability to carry out prescribed responses, which greatly improves response time and increases productivity. ACE uses
the correlation language and how it is constructed. All of the fault identification and correlation approaches mentioned so far differ from our study of alarm correlation as we only receive fault alarms (FM /FB data) from a single point in the network (Telstrá s
Ericsson supplied AXE exchanges). We also do not receive different fault alarms according to different types of faults. We only obtain alarms (FM/FB) based on a line's insulation resistance. Our fault correlation is more like that used by Telstra in the early 1990's with its pressurised cable alarm monitoring system. Kashmirian and Robinson
[9] describe Telstrás automatic pressurised cable monitoring system (APCAMS) which monitors the pressurised cables in Telstra's network. The major types of alarms generated by APCAMS are for low pressure, noisy transmission, no response, high pressure and any pressure changes outside of 10 kPa. Due to the dynamic nature of the network, cable pressures are constantly varying and as a result there is a continuous stream of information and alarms. The network operators were receiving too much information and as a result many poor operating decisions were being made. This led to
the development of the alarm evaluation system that filters the alarms that are forwarded onto the network operators. The filtering of alarms in this case is very rule
based, ie certain alarm types are only transmitted if there are more than three such alarms on the same cable pair within a specified short period of time. This type of correlation is similar to the way in which we are correlating our faults. For example when we are looking for common cause faults we only count FM/FB alarms if there are two or more FM /FB lines closely situated in the network.
2.3
Predictive maintenance
The ability to predict future events has long been a desirable talent. From tea leaves to tarot cards, it was always believed that predicting future events required either luck or psychic powers. However, technological advances mean that this situation may be rapidly changing. Grayson [7] writes that Computer Associates are developing software that uses neural network technology to predict the future. Called Neugents, the technology makes its predictions by analysing vast amounts of data. Based on historical information and present conditions, it makes predictions about what will happen in a
to predictive maintenance. Predictive maintenance doesn't try to predict when devices are going to fail. Predictive maintenance is only concerned with predicting faults that customers will report.
Telstra has trialed predictive maintenance schemes in the past as described by McIntyre [11]. This scheme was the customer access network evaluation system (CANES) that was used by Telstra in the early 1990's for predictive maintenance. McIntyre states that
studies have shown that services that have an insulation resistance between 50 k12 and
500 kS2 are very likely to incur "service affecting" faults within twelve months. CANES utilised an expert system that applied a set of rules to line insulation quality data, network configuration data, ' fault history and customer fault reports. The
recommendations of the expert system were used for long term management of network upgrade programs and to assist despatch of fault repair staff. The CANES analysis was based on a combination of connectionist and rule based reasoning that was driven by the
actual network configuration. This resulted in a robust system that could diagnose and assist in the location of faults even when the knowledge base was incomplete. The CANES system was never fully implemented as the network configuration database was never completed. Both our project and CANES use line insulation quality to predict future customer reports. However our project utilises FM/FB data obtained from AXE switches while CANES used customer line insulation quality (CLIQ) tests. CLIQ tests are prohibitive in the number of lines that can be tested as they are usually only performed at night due to the occupation of a customer line for the test. Also CANES is more of a proactive maintenance scheme, detecting trouble lines that are degrading and that may be problems within the next 12 months..Our project has a much shorter time frame than that, mostly trying to predict customer TRs that will arrive in the next 3
weeks.
Other telecommunications companies such as British Telecom (BT) and GTE have also implemented predictive maintenance schemes. Potts [17] describes British Telecom's (BT's) access network support system (ANSS). Previous BT support systems were
designed to support a purely copper based network. The main aim of ANSS is to enhance and supplement these systems to support similar processes using fibre and
status reports are produced automatically. In order to reduce the number of customer reported faults, ANSS will automatically take appropriate action upon receiving fault alarms from network elements. ANSS will also analyse all the fault alarms they receive with the aim of correlating alarms and identifying a single point of failure in the network. Silver, Qian, Moghe, Eichen, Doleac, Bhatnagar and Friedman [20] discuss TCAF, an expert system that performs 24 -hour monitoring and surveillance of the customer access facilities in GTE's telephone network. The aim of the system is to identify and fix developing faults before a customer detects a problem. The key idea is to use alarms from a digital switch to trigger testing. This allows the test to be performed near the time of a failure (and hence more likely to detect intermittent faults) and also focuses the testing effort in areas of likely trouble. Results have shown that TCAF has reduced the number of customer reported faults by approximately 85 %. TCAF has also been approximately 90% accurate in detecting faults that can not be predicted such as cable cuts. Early detection of unpredictable faults allows GTE to get repair crews in place quickly, before a large number of customers become aware of the problem. The work at both BT and GTE is similar to our project as we are both attempting to reduce the number of customer reports received by fixing faults before a customer detects them. They also try to identify common cause faults. However, neither of the systems mention the effects of fixing future TR predictions that do not result in a customer reported fault. In these instances workers and resources are used while customers wait to have their faults repaired. Our project investigates the effect of fixing false alarms and we establish operating conditions that ensure more effective
utilisation of the field staff.
Schmersal [19] and Pierce [1 6] both recognise the importance of predictive maintenance
Service quality management uses the information provided by modern intelligent network elements (INEs) to detect trouble early. Our project is primarily concerned with what Pierce calls service quality management. The INEs in our network are AXE exchanges that provide FM/FB data.
2.4
Network management
To attain high levels of customer satisfaction and to assist with network maintenance, many companies are searching for ways in which to improve the management of their networks.
In the mid 1990's BT undertook numerous activities aimed at improving the performance of its telecommunications network. However, in order to improve network performance it is important to be able to measure how well it is currently working. Rogers and Hand [18] discuss how BT has changed the way in which it measures network performance. Traditionally BT has used test calls to evaluate the state of its network. Test calls were performed by a system that was able to initiate and answer calls automatically. If any problems were observed during the call
setup
and call shut down then these were recorded. Approximately 2 million test calls were made a month and from these performance reported, black spots identified and remedial action taken.Despite the success of these test calls, BT decided to replace them with live call sampling. The strength of live call sampling is that it measures calls going anywhere, needs no far -end answering equipment, and measures continuously 24 hours a day, every day. Most modern exchange systems have a live -call sampling facility as part of their management statistics package. All calls originating, terminating or passing through digital exchanges are eligible to be sampled. This approach to network measurement is analogous to the way we are attempting to use FM /NB data for predictive maintenance purposes. The old method of running batches of CLIQ tests to obtain insulation quality data can be compared to BT's test calls. While using AXE exchanges to test lines can be compared to BT's live -call sampling.
network maintenance and operations, the evaluation of new processes, the
improvements gained through automatic fault dispatch and mobile technicians. Relevant
to our work is their use of simulation to analyse the present mode of operation and to help evaluate and develop future modes of operation. This is what we are aiming to achieve with our simulation. We have a benchmark level, which is the present mode of operation, and through simulation we are investigating new operating modes that may perform better than the present mode. Another relevant activity that the authors discuss,
and is also discussed by Montana, Bidwell and Moore [13], is resource allocation. The resource allocation algorithm used by Telecom Italia takes into account several different
factors such as organisational, legal, technical, human behaviour and contractual constraints. They also have several metrics that need to be optimised including; (i) Activities waiting time: the queue time for the activities. (ii) Correct repair percentage: the percentage of correct trouble repair. (iii) Intervention time: the total time taken to complete each activity. (iv) Medium repair time: the intervention time minus the time spent for travelling, getting equipment etc. (v) Medium trouble time: the time from when the trouble arose to when the trouble was repaired. Montana, Bidwell and Moore discuss the work that has been done by GTE to use genetic algorithms (GAs) for real time scheduling. Real time scheduling can be very difficult due to large search spaces, dynamically changing problems and a variety of constraints. Genetic algorithms are suitable to solve these problems as they can search large, multimodal spaces effectively
to find nearly global optima. GAs are also flexible as to the optimisation problems they can solve and have been shown empirically to scale well with problem size. The implementation of a field service schedular for one of the largest field service
organisations in the world has shown resource efficiency improvements of 60 to 100% when measured as the number of service calls closed per day by each service representative. Our resource allocation is comparably simple as we only consider different prioritisation schemes according to the type of fault. We do not try to match jobs with field workers by taking into account any constraints on the field workers such
Chapter
3
Before we can begin to investigate how predictive maintenance can be used in Telstra's maintenance system we must first understand its current operation. The aim of this chapter is to familiarise the reader with Telstra's fault management system. Specifically we look at how faults arrive in Telstra's system, how these faults are accepted and tested and then how they are despatched to field staff to be repaired. The chapter concludes with an explanation of the network data that Telstra hope to use for predictive maintenance.
3.1 A
general description
of
fault
managementsystems
Fault management systems are found in any organisation or industry that supplies a product or service to a customer. Typically there is a supplier and a customer as well as
a medium across which the product or service is supplied. If the product or service cannot be supplied according to a specified level of performance, or to the customers expectation, then a fault exists that needs to be rectified.
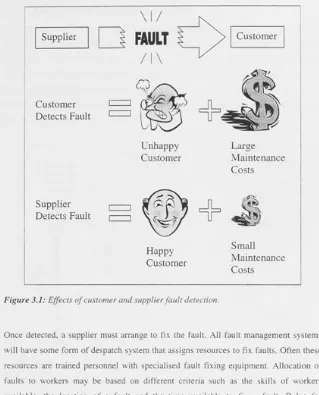
Fault detection can come from either the customer or the supplier. When a customer detects a fault the supplier must provide resources to enable that customer to report the
fault. The supplier must then quickly find and rectify the fault in order to minimise that customer's dissatisfaction with the supplier. The provision of customer fault reporting facilities can be very costly to the supplier, not to mention the costs a dissatisfied customer may bring. However, if the supplier can detect and correct faults before a
Supplier
Customer
Detects Fault
Supplier
Detects Fault
\I/
ri
FAULT
I I
I 1
Customer
Unhappy
Customer
Happy
Customer
Large
Maintenance
Costs
Small
[image:36.390.40.359.31.426.2]Maintenance
Costs
Figure
3.1: Effects of customer and supplierfault
detection.Once detected, a supplier must arrange to fix the fault. All fault management systems will have some form of despatch system that assigns resources to fix faults. Often these resources are trained personnel with specialised fault fixing equipment. Allocation of faults to workers may be based on different criteria such as the skills of workers available, the location of a fault and the time available to fix a fault. Rules for despatching faults will vary for different companies, industries and situations.
Telstra provides many products and services to its customers. However, this work is
3.2 The
Customer Access Network
(CAN)The maintenance of any physical network in Australia will encounter problems because of the large distances it must cover and the harsh climates it will inevitably be exposed to. Telstra's telecommunications network is no different. In order to maintain and support such a large network Telstra have divided its components into three sections: the Exchange and Inter Exchange Network, the Customer Access Network (CAN) and the Customer Premises Equipment (CPE). These three areas can be seen in a typical representation of Telstra's network in Figure 3.2.
Exchange and Exchange Network Exchange
X
Inter Exchange Network (IEN) InterCustomer
AccessNetwork
(CAN) Equipment Customer Premises (CPE) El
111 ql1
fl.
Main Distribution
Frame (MDF)
Pillar Joint Network
Boundary Point (NBP)
X
Main O pairCable
Figure
3.2: A typical representation of Telstra's Customer Access Network.These three distinctions are made as the technologies and processes used in each area are vastly different.. The Exchange and Inter Exchange Network is maintained by Telstra's Network and Technology Group (NTG). The CAN is defined as all the network from the Main Distribution Frame (MDF) at an exchange up to the Network Boundary Point (NBP) at a customer's premises. The part of the network to the right of the NBP is called the Customer Premises Equipment (CPE). The NBP is usually the
telephone, modem or fax that a customer has connected. While some CPE may be rented from Telstra, it is not the responsibility of Telstra to maintain this equipment.
Jones Avenue
AAA
A
Smith Street
Legend
= Pillar
O
= Joint [image:39.391.42.363.27.433.2]X= Exchange
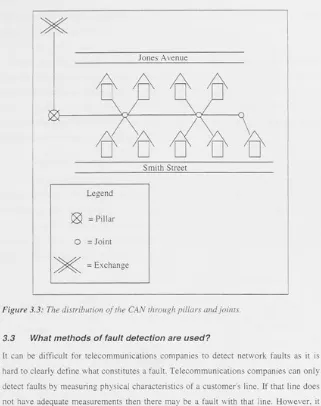
Figure
3.3: The distribution of the CAN through pillars and joints.3.3 What
methods
of
fault detection
are used?It can be difficult for telecommunications companies to detect network faults as it is
hard to clearly define what constitutes a fault. Telecommunications companies can only detect faults by measuring physical characteristics of a customer's line. If that line does not have adequate measurements then there may be a fault with that line. However, it may be the case that the line is still operating, for whatever reason, and the customer is perfectly happy. Sending field staff to correct this fault is a waste of valuable resources. There may be another customer that also has a phone line that has poor electrical measurements. However this customer's phone may be noisy and not very clear. As the
provider. Waiting for a customer to report a fault is not an adequate means of fault detection in this situation.
It can be seen that it is not acceptable to wait for customers to report problems and it may be unnecessary to send field workers to fix every line that has poor electrical measurements. Ideally Telstra needs a flexible fault detection system that is able to use both customer reported faults as well as physically measured faults. We are investigating how Telstra may be able to use physically measured line performance to predict future customer trouble reports (TRs).
3.3.1
Customer reported
faultsA customer will report a fault when they become so unhappy with the quality of their phone service that they have to report it. Currently, most of the faults in Telstra s CAN are detected and reported by customers who have noticed a decrease in the performance of their service. When a customer detects a fault with their service they will call a Telstra Call Center to report the fault and to arrange for a field worker to fix the fault. This process is shown in Figure 3.4.
Customer Telstra Call Center
Tester
Despatch
I
Field
Figure
3.4: Processing customer TRs. From reporting afault
to despatching to the field.Once the fault type has been identified the details are entered into Service Plus which is
a management database that is used by Telstra. Service Plus sends the fault to Telstra's despatch system, which allocates it to the next available field worker.
There are both advantages and disadvantages of relying on customers to report network faults. The advantage of using customers to detect faults is that maintenance is
performed only when it is necessary. Resources are not wasted fixing problems that are not customer affecting. A disadvantage is that the ability to plan network maintenance is lost. Telstra is forced to react quickly to customer reported faults as it is under a legal obligation to fix faults within time frames that are set out in Telstra's Customer Service Guarantee (CSG) [22]. Having to react so quickly means that Telstra often miss opportunities to identify groups of faults that have a common cause. When this occurs Telstra sends many field workers to fix a number of faults that could be fixed by a
single worker. Sending a field worker to fix a fault is very expensive. Therefore Telstra wants to minimise the number of times it sends workers to fix faults. Another disadvantage is the cost of customer dissatisfaction. Deregulation of the telecommunications industry has led to an increase in competition, which means that
customer satisfaction is a high priority for every telecommunications company [16]. Quantifying customer unhappiness in terms of dollars is almost impossible. Some customers will be unhappy, but they may be loyal customers or they may not know they can change their telecommunications company. However another customer may be so unhappy that not only do they switch to another company, they also talk their friends into doing the same. Another effect may be that now Telstra is a listed company on the Australian Stock Exchange consumer confidence becomes an important factor. If the general feeling is that a company's operations are smart and efficient then confidence is high and share prices usually rise. However, if confidence in a company is low then people will not want to invest their money in this company and its share prices may fall.
3.3.2
Dataused
to predict futurecustomer TRs
Fault data can be used to predict future customer TRs. The data Telstra is investigating to use for TR predictions is called Fault Marked (FM) and Fault Blocked (FB) data. This data comes from physically measuring the insulation resistance of a customer line.
up approximately 65% of Telstrás network. The other 35% consist of Alcatel supplied System 12 exchanges which do not have FM/FB reporting capabilities.
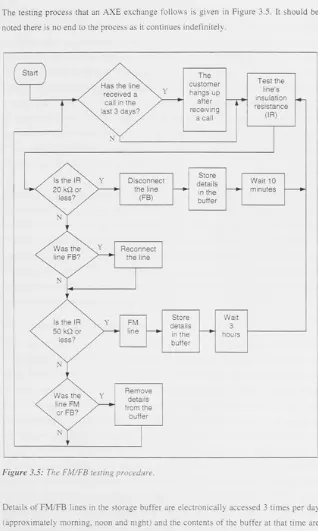
Telstra's AXE exchanges perform regular insulation resistance tests on lines that they connect. A line is tested every time a customer hangs up after receiving a call or after three days if a customer has not received a call in that time. If a line is found to have an insulation resistance of 20
k0
or less then it becomes FB. A FB line is disconnected from the network by an exchange and its details are stored in a memory buffer in the exchange. FB lines are disconnected as the low resistance causes the exchange processors to go into a loop of sending the line dial tone, then removing the dial tone. This renders the line unusable by a customer. Once FB a line is re- tested every 10minutes. If the insulation resistance changes so that it is greater than 20 k52 the line is reconnected and its details are removed from the storage buffer.
A line becomes FM if it has an insulation resistance equal to or less than 50 k52 but greater than 20 kS2. FM lines are not disconnected, they are still operable and the user
may or may not notice a difference in the quality of their service. Details of FM lines are stored in the same buffer as FB lines. FM lines are re- tested every three hours after becoming FM. If the insulation resistance changes so that it is greater than 50 k52 the line details are removed from the storage buffer.
The automatic testing capability of AXE exchanges is ideal for a predictive maintenance scheme. However, two questions that relate to it are; 1) Is it testing the most useful measure (insulation resistance)? and 2) Is it testing customer lines that are actively being used? At this stage it is not clear if insulation resistance alone is a line characteristic that greatly influences customer TRs. As FM lines are still operating, does
an insulation resistance reading between 20 k52 and 50 k52 reduce line performance to a point that is noticeable to a customer? This is a question that requires further investigation. As FB lines are disconnected, FB data can definitely identify lines that customers will detect a problem with if they try to use that line. However, if a customer does not try to use that line they will never detect and report the problem. Therefore, for
The testing process that an AXE exchange follows is given in Figure 3.5. It should be noted there is no end to the process as it continues indefinitely.
Has the line received a
call in the last 3 days?
The customer hangs up after receiving
a call
Test the line's insulation resistance (IR) Store details
in the buffer Disconnect
the line (FB)
Wait 10 minutes
Reconnect the line
Store Wait
FM details 3
line
-
in the buffer
1
hoursRemove details from the
[image:43.390.41.359.31.562.2]buffer
Figure
3.5: The FM /FB testing procedure.downloaded and stored in Telstra's Testing and Diagnosis Server (TADS) database. Andrew Wild of Telstra's NTG stated that "accessing the FM/FB buffers of all of AXE exchanges takes approximately half an hour. If an exchange is under a heavy switching load it may reject the request to access its buffers and no FM/FB data will be available"
[14]. This makes FM/FB data very unreliable as it is hard to know if a line has ceased being FM/FB or if no data was accessed from that switch. This is a problem that must be addressed if Telstra is to use FM/FB data for predictive maintenance. It is believed the frequency at which FM/FB buffers are accessed can be changed, although this has not been officially confirmed. This is also important as Telstra may need to detect when
a line is disconnected (FB) closer to real time so that it can fix the problem before a customer becomes aware of the problem.
Currently, the predictive capabilities and dynamics of FM/FB data are not very well understood by Telstra. Telstra realise that FM /FB data can potentially be used to predict future TRs. However it is unclear which FM/FB faults will become future customer
TRs, and it is also unclear how often faults enter and exit the FM/FB buffer. Chapter 4 of this thesis develops an understanding of the dynamics of FM/FB data and how it can potentially be used by Telstra to achieve the goals of this thesis. Chapters 5 and 6 use modelling and simulation to establish criteria that FM/FB data must satisfy if Telstra could potentially achieve the stated goals.
3.4
Scheduling and fixing faults
Faults are currently despatched to field workers by a computerised system called DIRECTOR. DIRECTOR is an automated process that despatches installation and repair work to the nearest available field worker that has the necessary skills to
complete the job. Each field worker has a portable computer called a FieIdMATE, which they use to electronically receive and clear jobs. At the start of each day field workers remotely connect to DIRECTOR through their FieIdMATE on Telstra's mobile data network. DIRECTOR allocates that worker the first job in the queue that they are geographically closest to. The field worker is given the customer's details as well as what the testers believe to be the fault type. The field worker then has to find the customer's premises, test the line and isolate the fault. Once they have fixed the fault they notify the customer, explaining what they have done. They also clear the fault from
describes the type of fault found as well as the actions taken to repair it. DIRECTOR will then assign the field worker a new job.
DIRECTOR is an important part of Telstrá s current fault management system as it decides which faults are assigned to which field workers. In a predictive maintenance scheme DIRECTOR would be required to prioritise faults so that certain faults are fixed before others. The prioritisation rules that we investigate are discussed in section 5.6.1 when we introduce three prioritisation schemes for predictive maintenance.
3.5
Predictive maintenance and
Telstra'scurrent system
Before it could implement a predictive maintenance scheme Telstra would need to modify its current fault management system. Modifications that would need to be made
are:
Not all lines connected to an AXE exchange should be tested. Only the lines of active customers. Non -active customer lines will never be reported as faulty by customers so they should not be tested for predictive maintenance purposes.
Current FM/FB data is not adequate for predictive maintenance as data can be missing when an AXE exchange rejects a request to access its buffer. This needs to
be addressed so that FM/FB data is always available. If not always available it is
impossible to know if a line is no longer FM/FB or if that line has not been accessed from the buffer.
The frequency that FM/FB buffers are accessed needs to be increased. If Telstra are
to fix a fault before a customer detects the problem it must respond to FM/FB data as quickly as possible.
DIRECTOR needs to be modified to assign faults based on prioritisation rules that
Chapter
4
Before a predictive maintenance scheme can be implemented Telstra must have the ability to accurately predict which faults customers will report in the future. In this chapter we analyse Telstra's FM/FB data and examine its potential to be used in a predictive maintenance scheme. Specifically we will be trying to answer the following questions: How accurately does FM/FB data predict future TRs? How can the ability of FM/FB data to predict future TRs be improved? What percentage of TRs can be predicted? How quickly do customer TRs arrive after a line has first become FM/FB? How consistently do FB lines appear over a 48 hour period? And is there a relationship between the number of times a line is FB and the ability to predict future TRs?
4.1 The
"predictive power" of
FM/FB
dataIf Telstra is to use FM/FB data for predictive maintenance it needs to know how accurately it can predict future TRs. We have called the percentage of FM/FBs that correctly predict future customer TRs the predictive power. Predictive power is defined
to be the percentage of FM/FB lines that customers report within 3 weeks of first observing a FM/FB. As an example, if there are 20 different FM/FB lines and customers report 15 of these lines as faults some time in the next 3 weeks then the predictive power is 75 %. The specification of 3 weeks is assigned on the basis that the probability of a predicted TR arriving after 3 weeks is less than 2 %1.
If using FM/FB data for predictive maintenance, a high predictive power means that there is a greater chance a FM/FB line will predict a future customer TR. If FM/FB lines can be fixed quickly enough, then a high predictive power means there is a greater chance a customer fault will be fixed before that customer detects and reports it. In terms of the aims of this thesis, this will help to reduce TR volume, although it may or
may not increase the maintenance workload. In order for Telstra to get the greatest benefit from using FM/FB data for predictive maintenance it must have predictive power as high as possible.
4.1.1 Identifying characteristics to improve predictive power
customer TR need to be identified. This can be done by querying FM/FB data to identify characteristics of lines that are most likely to predict future TRs.
During a meeting with Telstrás David Aitken, Ross Bird and Murray Blackwell [15], nine distinct characteristics were chosen for investigation. These characteristics are summarised in Figure 4.1. Starting with a combined FM/FB data set three groups can be created: the original Combined FM/FB group, a FM group and a FB group. Each of these groups are queried to identify lines that are domestic customers. The domestic customers in each group are queried to identify lines that are within a range of 30 o- pairs of each other. An o -pair number is the number assigned to a customer line at a pillar. Therefore lines that are within a 30 o -pair range are likely to be located close to each other. If there is a fault on two or more lines that are within a 30 o -pair range, Telstra believes it is likely these faults are caused by a common problem and can possibly be fixed by a single field worker.
Combined FM /FB
Domestic Customers
Within 30
o
-pairs
of a FM orFB line
FM
J
IL
Domestic
Customer
Within 30 o -pairs of
a
FM line
B.
FB
J
0-
Domestic Customers
JI
Within 30
o -pairs of a
FB line