This is a repository copy of Sampling from single cells. White Rose Research Online URL for this paper: http://eprints.whiterose.ac.uk/124246/
Version: Accepted Version
Article:
Actis, P orcid.org/0000-0002-7146-1854 (2018) Sampling from single cells. Small Methods, 2 (3). 1700300.
https://doi.org/10.1002/smtd.201700300
© 2018 WILEY VCH Verlag GmbH & Co. KGaA, Weinheim. This is the peer reviewed ‐ version of the following article: Actis, P (2018) Sampling from single cells. Small Methods, 2 (3), which has been published in final form at https://doi.org/10.1002/smtd.201700300. This article may be used for non-commercial purposes in accordance with Wiley Terms and Conditions for Self-Archiving.
[email protected] Reuse
Items deposited in White Rose Research Online are protected by copyright, with all rights reserved unless indicated otherwise. They may be downloaded and/or printed for private study, or other acts as permitted by national copyright laws. The publisher or other rights holders may allow further reproduction and re-use of the full text version. This is indicated by the licence information on the White Rose Research Online record for the item.
Takedown
If you consider content in White Rose Research Online to be in breach of UK law, please notify us by
Sampling from single cells
Paolo Actis
School of Electronic and Electrical Engineering, University of Leeds, Woodhouse Lane, Leeds
LS2 9JT, United Kingdom
Abstract
The cell is the fundamental unit of biology. Major methodological advances in engineering and
molecular biology have enabled the ‘omics analysis of individual cells and supported biologist
in understanding the deepest difference between health and disease. These advancements were
based on the assumption that a single-cell needs to be lysed or fixed before any in-depth
analysis can be performed. This review aims to paint a picture of innovative methods used for
extracting the content of living cells without affecting their viability.
These novel methods are now empowering the biological community to repeatedly interrogate
a single cell over time, thus giving a dynamic representation of the cell’s ‘omics rather than a
snapshot at a particular time point.
Introduction
The cell is the fundamental unit of biology and the building block of life. Since the invention
of optical microscopy, scientists have studied the morphology of individual cells but only very
recently has the scientific community started to fully appreciate the fundamental molecular
diversity of morphologically indistinguishable cells.
In multicellular organisms, physiology stems from an intricate and dynamic balance of
single-cell activity and intersingle-cellular connections which gets disrupted by the emergence of disease
that may give raise to abnormal cell types and states. Scientists have been interested in
identifying these cell types and states for many years and preliminary classifications have been
and molecular biology[1]. Microfluidics has enabled the parallel analysis of tens of thousands
of cells[2], while novel molecular biology techniques have allowed the analysis of the minute
amount of genetic material contained in one single cell[3-5] and sophisticated bioinformatics
analysis disentangled statistically significant results from measurement bias[6]. In 2017, tens of
thousands of single cells can be assayed simultaneously to measure their transcriptional profile
at a cost that is very rapidly decreasing[7, 8].
These advances in single-cell technologies are now culminating in one the most ambitious
projects in human biology the “Human Cell Atlas” (https://www.humancellatlas.org/) which
aims to create a complete reference map for all human cells[9].
Several recent reviews have comprehensively summarized the state of the art of the field,
including the current state of the science of single-cell genome sequencing[6], the emergence
of single-cell metabolomics[10], advances and application of single-cell sequencing
technologies[11] and the computational challenges associated with analysis of single-cell
transcriptomics data[12].
This review aims to paint a picture of the methods used for extracting the content of living cells
without affecting their viability (Figure 1). These methods are challenging the assumption that
a single cell needs to be lysed or fixed before any in-depth analysis can be performed.
Such technological advances, although at very early stages, are now enabling the biological
community to study the ‘omics of single cells with unprecedented resolution. A single living
cell can be repeatedly interrogated over time, thus giving a dynamic representation of the
genotype of interest rather than a snapshot at a particular time point. The development of these
methods is driving the further refinement of sample preparation methods for downstream
analysis of the extracted content. Next-generation sequencing has now been applied to
sequence just a fraction of a cell’s RNA[13] and the extracted contents also can be analysed with
This review will describe and critically assess the benefits and limitations of 3 different
methods employed to extract material from living cells (Figure 1):
1. Atomic force microscopy (AFM)
2. Nanopipette
3. Nanostraws
Methods based on carbon nanotubes[17, 18], nanowires[19], and nanofountain probes[20] that could
potentially be applied for the extraction of contents of living cells have been reported in
literature. These methods, however, will not be discussed in this review because their ability
to carry out such experiments has not been fully demonstrated.
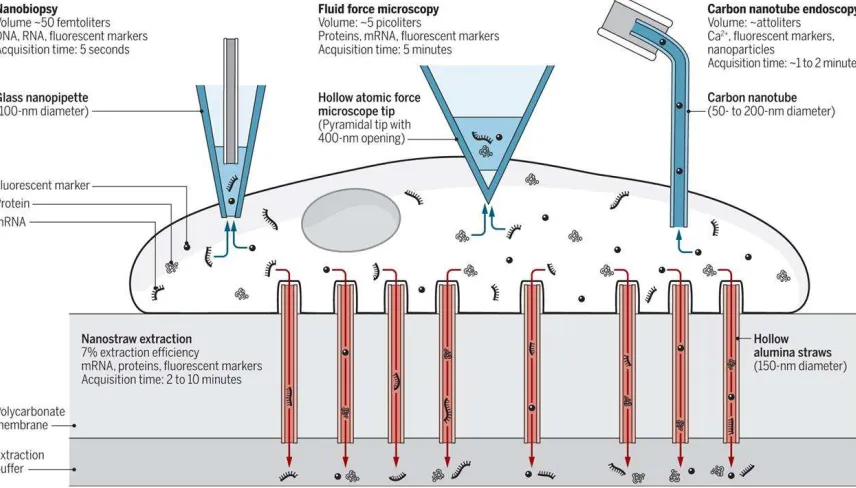
Figure 1. Schematic representation of methods for removing cell contents. Reprinted with
permission from AAAS[21]
1. AFM-based Methods
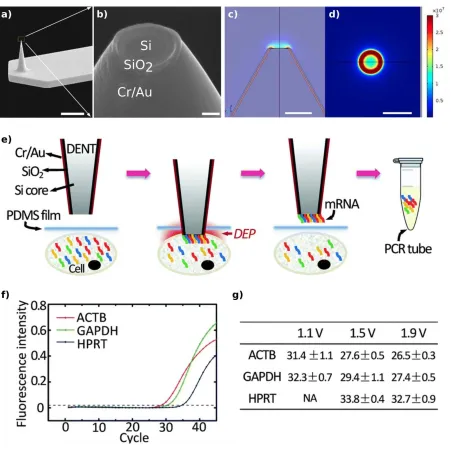
[image:4.595.76.504.381.625.2]Wickramasinghe’s group pioneered the use of Atomic Force Microscopy (AFM) to extract
nucleic acids, in particular RNA, from individual living cells.
In 2009, his group modified a standard AFM probe to comprise a dielectrophoretic
nanotweezer (DENT)[22]. The authors first deposited a thin layer of SiO2 on a highly-doped
silicon AFM probe to isolate its conductive core and then a thin layer of Cr/Au (Figure 2 a, b).
The application of an AC field (120 KHz, 5 V peak-to-peak for a duration of 60–75 s) between
the silicon core and the Cr/Au layer generates a dielectrophoretic force strong enough to attract
nucleic acids at the DENT tip (Figure 2 c,d)[23]. When this procedure is performed within the
cytoplasm of a living cells, nucleic acids can be extracted from the cell and deposited in a PCR
tube for further analysis (Figure 2 e). The integration of DENT with a conventional AFM setup
enables the precise positioning of the nanoprobe with nm resolution within the cytoplasm of a
living cell. Also, the nanometer-sized probe minimizes the mechanical disruption to the cell
membrane thus allowing high cell viability “post-surgery”. Functionalisation of the DENT with
gene specific-primers enabled the enrichment of specific populations of mRNAs which were
then released from the tip after immersion in ice-cooled de-ionized water for 45 min.
The authors employed qPCR to confirm the success of the extraction, although a control
experiment where no AC voltage was applied also showed a signal for -actin mRNA. These
results could indicate the non-specific RNA adsorption on the DENT tip and/or contamination
from cell debris present in the growth media. In their 2009 paper, the authors did not investigate
the reproducibility of their procedure nevertheless their seminal work paved the way for the
extraction of contents from living cells.
Two years later the same group produced remarkably similar data, when they again showed
via qPCR the extraction of -actin mRNA with and without the application of the AC
voltage[24]. Also, they showed the selective extraction of mRNA oncogene from transfected
In 2017, the same group demonstrated the integration of DENT with microfluidics technology,
[image:6.595.74.525.149.600.2]a key step to increase the analytical throughput[25].
Figure 2. SEM micrographs of a) AFM cantilever (scale bar: 10 m) and b) tip of the DENT
nanoprobe composed of a highly-doped silicon core, an insulating layer of SiO2 and a thin layer
of Cr/Au (scale bar: 100 nm). Side (c) and top (d) views of the finite element electrostatic
simulations of the distribution of the electric field of a DENT nanoprobe. The Si core was held
at 5 Vpp at 10 MHz while the outer Cr/Au layer was grounded (scale bar: 1 m). e) Schematic
RT-qPCR graphs of three housekeeping genes' mRNAs extracted from a single HeLa cell (AC
field: 1.5 Vpp, 10 MHz) (G) quantified Ct values of extracted mRNA molecules of 3 target
genes (ACTB, GAPDH, and HPRT) from single HeLa cells with increasing AC voltages (1.1,
1.5 and 1.9 Vpp), with a constant frequency of 10 MHz.
The authors demonstrated that DENT nanoprobes are able to penetrate a very thinly sealed (1
m) microfluidic chip and isolate mRNAs from HeLa cells as well as Circulating Tumour Cells
(CTCs). In this paper, they presented a more comprehensive study of mRNA isolation via
qPCR analysis (Figure 2f) and they investigated the effect of varying the magnitude of the AC
voltage on the efficiency of the nucleic acid isolation demonstrating that a higher AC voltage
enables the isolation of a larger number of RNA transcripts (Figure 2g).
The authors noted that the amount of mRNA extracted was much lower compared to their
previous work. The authors explained this result arguing that cells in the microfluidic chip were
in close contact with the sealing PDMS film thus avoiding any false-positive readings and
cross-contamination from cell debris in solution.
Wickramasinghe’s group pioneered the application of dielectrophoretic nanotweezers for
sampling from a living cell and their 2017 paper fully confirmed their potential for the selective
extraction of mRNA.
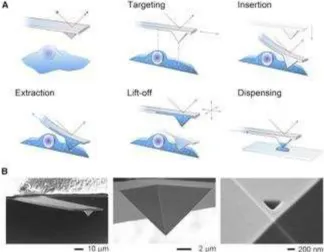
1.2 FluidFM
An alternative method to extract contents from living cells using AFM technology is based on
the so-called FluidFM. FluidFM combines a nanoscale tip, the force-controlled positioning of
a standard AFM and a pressure-driven microchannel connected to the AFM tip as shown in
Figure 3. Schematic Representation of the FluidFM technology. A) The setup consists of an
AFM mounted on top of an inverted microscope and a microfluidic nanoprobe connected to a
pressure controller. Optical, force, and pressure-monitoring are performed simultaneously
along the entire process B) SEM micrographs of a FluidFM tip with the fluidic aperture milled
by focused ion beam on the front of the pyramidal tip. Reprinted with permission from
Elsevier[14]
In 2016, Guillaume-Gentil and co-workers published a seminal paper that demonstrated the
extraction of cellular contents using the FluidFM technology combined with subsequent
molecular and structural analysis of the extracted material[14]. As with the DENT technology,
the integration with the AFM force-controlled feedback mechanism allowed the precise
positioning and penetration of the cell of interest. Cell contents were extracted via the
application of a negative pressure to the microchannel connected to the FluidFM tip.
Arguably, this study was the most comprehensive work published to date demonstrating
extraction from within a single living cells and subsequent molecular analyses.
cell nuclei with a fluorescent protein (mRuby) tagged with a nuclear localization sequence
(NLS). While mRuby has a size similar to the GFP protein, the NLS-tag leads to the active
import of the reporter protein into the cell nucleus. Following insertion of the FluidFM tip and
extraction directly from the nucleus, a decrease in fluorescence was observed, whereas no
decrease in fluorescence was detected when the same procedure was performed in the
cytoplasm. To demonstrate selective cytoplasmic aspiration, the team used the FluidFM to
inject the cell nuclei with a 70 kDa dextran-conjugated fluorophore (fluorescein isothiocyanate
[FITC]-dextran), which is unable to cross the nuclear pores without active transport. The
authors measured a decrease in FITC fluorescence following extraction from the nucleus,
whereas no noticeable change was detected when the same procedure was performed in the
cytoplasm. These results indicated that the two fluorescent markers remained confined and
were selectively extracted from the nucleus. In the same paper the authors monitored optically
the aspirated volume and estimated the rate of aspiration as 0.4 ± 0.1 pl/min for both cytoplasm
and nucleus extractions.
The authors also thoroughly investigated cell viability after cytoplasmic and nuclear
aspirations. They concluded that cytoplasmic extraction of 4.0 pL from a cell resulted in 82%
cell survival while aspirations of 4.5 pL and above resulted in 100% cell death (for reference
the reported volume for a HeLa cell ranges between 1.2 and 4.3 pl [27]). This result is quite
remarkable and indicates the cells have the ability to tolerate the loss of a large portion of the
cytoplasm. Also 86% of the cell survived a nuclear aspiration of 0.6pL but aspiration volumes
of 0.7pL and above resulted in cell death.
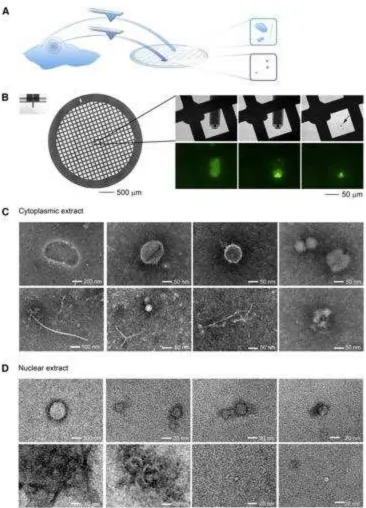
The authors also used the FluidFM to aspirate cellular contents followed by spotting on a
Transmission Electron Microscopy (TEM) grid using overpressure (Figure 4 a, b). After
staining, the contents were imaged using a TEM and showed features and structures consistent
Figure 4. (A) Schematic representation of the strategy for the molecular imaging of
cytoplasmic and nuclear extracts. (B) Images of the TEM grid and the FluidFM cantilever (left)
zoom-in of the FluidFM spotting of the cell contents on the TEM grid (right). The
phase-contrast and fluorescent micrographs demonstrate the dispensing of cell extract (arrow) on the
[image:10.595.115.481.94.602.2]negatively stained (C) cytoplasmic extracts and (D) nuclear extracts. Reprinted with permission
from Elsevier [14].
Having demonstrated controlled aspiration of cellular contents, performed in depth cell
viability studies, and analysed the aspirated nucleic acid using qPCR, the authors also validated
the viability of extracted proteins using enzymatic assays. The authors then concluded the study
with an in-depth analysis of extracted mRNAs from 3 different genes: two housekeeping genes
and one encoding for GFP extracted from both the cytoplasm and the nucleus from HeLa cells,
and GFP-transfected HeLa cells.
In a subsequent paper, the same group demonstrated that the FluidFM technology can also be
used to extract contents from living cells for subsequent Matrix-Assisted Laser
Desorption/Ionization Time Of Flight Mass Spectrometry (MALDI-TOF-MS) [27]. The
approach was similar to the one used in their previous work[14] but in this case the contents
extracted from a living cells were spotted on a MALDI target. MALDI is an ionization
technique where analytes are spotted on a solid matrix. A laser is then used to irradiate the
matrix to generate high heat which triggers the analyte desorption and ionization. The ionized
analytes (i.e. charged) are then driven to the detector via a potential difference between the
matrix and the detector. Since the applied potential is constant, ions with smaller mass to charge
ratio (m/z value) and more highly charged ions will reach the detector sooner than ions with
larger m/z value (or less charged). Consequently, the time of ion flight to the detector will
depend on the mass-to-charge ratio value of the ion.
Using this technique, the authors demonstrated that is possible to analyse cytoplasmic
metabolites from single living cells. The authors achieved the detection of several acids and
phosphorylated compounds including: ribonucleotides (cGMP, UDP, ADP, ATP), activated
The work of Guillaume Gentil and coworkers is arguably the most comprehensive study which
demonstrate that methods for extracting contents from living cells and not only suitable for the
extraction of nucleic acids but are also capable of sampling larger cellular structure which can
then be further analyse with electron microscopy. Remarkably, they have also demonstrated
the potential of FluidFM as a tool for single-cell proteomics and metabolomics[10].
2. SICM-based Methods
2.1 Nanobiopsy
An alternative method per the extraction of contents from living cells relies on nanopipettes
integrated in a Scanning Ion Conductance Microscope (SICM). SICM is a scanning probe
technique that monitors the magnitude of the ion current through a nanopipette to reconstruct
the topography of a sample in solution. A nanopipette is a very fine glass needle with a typical
pore diameter of 100nm that can easily and reproducibly fabricated without the need for
clean-room facilities (Figure 5a). Since SICM only works in solution and the feedback mechanism
is force-free, it has been very successfully applied for the imaging of living cells for well over
20 years[28, 29]. In 2014, Actis and coworkers demonstrated that SICM technology can extract
RNA and organelles from within living cells without affecting their viability[13].
Rather than using a negative pressure as with FluidFM or dielectrophoretic force as with the
DENT, the authors employed elettrowetting within a nanopipette to extract minuscule amount
of cytoplasmic material for analysis. Electrowetting is a physical effect where an applied
voltage is used to modify the surface tension of a liquid. When a nanopipette is filled with an
organic solution (i.e. dichloroethane) and it is immersed in an aqueous solution a liquid-liquid
interface forms at the tip of the nanopipette due to the immiscible nature of the two liquids.
Upon application of a small (300 mV) voltage to the electrode fitted inside the nanopipette,
aqueous solution can be drawn inside the nanopipette tip. If this procedure is performed within
depends, other that on the geometry of the nanopipette tip, on the magnitude and duration of
the applied voltage and scientists reported that attolitre resolution (10-18L) could be obtained
with this method[30].
Similarly to the DENT and FluidFM technology, the integration with scanning probe
microscopy enables the precise positioning of the nanopipette with nm resolution with respect
to the membrane of the cell of interest. The membrane can then be penetrated by a predefined
distance and the electrowetting procedure provides a very sensitive (in the fL range) and quick
(few seconds) method to manipulate ultra-low volumes within the cytoplasm of a living cell.
The authors used this method to extract minute amounts of mRNA from human fibroblasts that
were then analysed with next-generation DNA sequencing.
The sequencing data of the most abundant transcripts sampled via nanobiopsy demonstrated
that full-length RNA can be extracted from a single living cell and that the procedure is
compatible with the sample preparation techniques used for next-generation DNA sequencing.
In the same paper, the authors demonstrated that the nanobiopsy platform is capable of
extracting mitochondria from different locations of a single living cell without affecting its
viability. Mitochondria are cell organelles whose predominant role is ATP production and to
regulate cellular metabolism[31]. The mitochondrion has its own independent genome and since
most eukaryotic cells contain many hundreds of copies of mitochondrial DNA, the presence of
more than one organellar genome within a cell is very common, which is designated as
mitochondrial heteroplasmy [32].
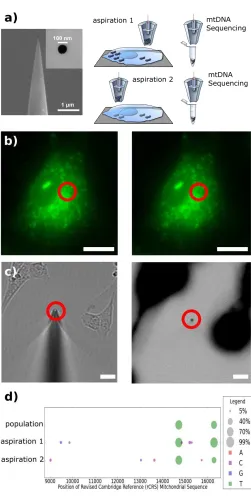
Figure 5 b) shows a fluorescent image of human fibroblasts whose mitochondria have been
stained with a green dye before (left panel) and after (right panel) nanobiopsy. The red circle
highlights the area when the biopsy took place where a diminished fluorescence intensity can
be seen. Also in figure 5 c) the left panel is an optical micrograph of the nanopipette tip after
high fluorescence) that shows high fluorescence at the nanopipette tip suggesting successful
[image:14.595.171.422.143.639.2]mitochondria aspiration.
Figure 5. Mitochondrial nanobiopsy. (a) SEM micrograph of the nanopipette tip and opening
and schematic representation of the nanobiopsy platform applied to the sampling of
were labelled with MitoTracker Green before nanobiopsy (right panel) and after nanobiopsy
(left panel). Red circles highlight the darker area following the sampling of mitochondria. Scale
bars 15 m. (c) (left panel) Bright-field image of the nanopipette tip (red circle) used for
mitochondria nanobiopsy in panel a. (Right panel) Negative fluorescent micrograph (black
areas indicate high fluorescence) of left panel showing fluorescence at the nanopipette tip
which indicates successful mitochondria extraction. Scale bars 15 m. (d) Mitochondrial
sequencing results demonstrate variable conservation of heteroplasmic frequencies in
aspirations. Heteroplasmic variants with estimated frequencies between 5% and 99% are
displayed as circles where the area of the circle is proportional to the observed frequency. The
colour of the circles specifies the nucleotide of the variant (A is red, C is violet, G is blue, and
T is green). Adapted with permission from Actis et al [13]. Copyright 2014 American Chemical
Society
The authors performed mitochondrial DNA sequencing from two mitochondrial populations
extracted from different locations within the same cell and compared the results with a
population-based analysis (Figure 5 D). The 14713 AT variant shows similar frequencies
across aspirations and population; whereas the 16278 CT variant shows a greater variance
of heteroplasmic frequencies in aspirations. Also, low frequency variants were found in both
aspirations but not in the population analysis. These results demonstrated that only using
nanobiopsy technology low heteroplasmic variants were observable.
This study was not as comprehensive as the one published by Guillaume-Gentil et al but
demonstrated that the contents extracted from a single living cells can be analysed using
next-generation sequencing technology and that the nanobiopsy technology can be employed for
One of the implicit advantage of integrating nanoprobes with scanning probe microscopies is
the ability to use the feedback mechanism to precisely position the nanoprobe with
nm-resolution in the three dimensions. All the methods discussed so far only took advantage of
z-resolution, but building upon the nanobiopsy work, Nashimoto and co-workers employed
dual-barrel nanopipettes to demonstrate high resolution topographical mapping of the cell of interest
followed by sampling[33].
Nashimoto and coworkers observed that the ion current obtained from a DCE filled nanopipette
was not sufficient to provide precise x-y positioning. To solve the issue, they employed a dual
barrel nanopipette, where one barrel was filled with an aqueous solution for topographical
mapping of a living cell and the second barrel was used for electrowetting-driven cell sampling.
With this technique, they managed to study mRNA localization in single mouse fibroblast cells
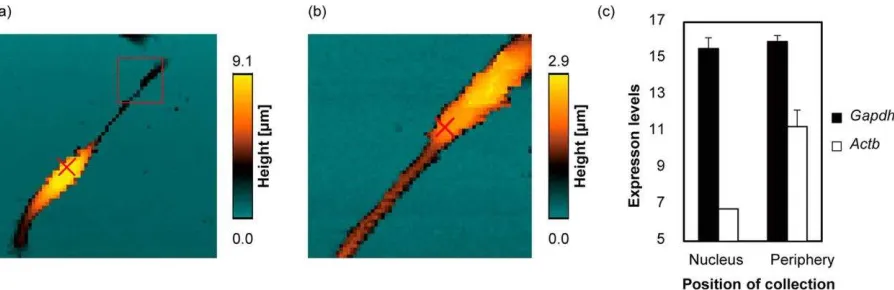
[image:16.595.76.523.458.603.2]and to determine the cellular differentiation status of mouse embryo bodies (Figure 6).
Figure 6. Nanoscale topography imaging and RNA sampling. (a) Representative SICM image
(100 × 100 m) (b) Close-up image (20 × 20 m) of the of the red square in (a). The red crosses
indicate the location where cytoplasmic samples were (c) mRNA expression levels for two
housekeeping genes for each sampled location. mRNA expression levels were defined as
35-Ct where 35-Ct indicates threshold cycle number. Reprinted with permission from Nashimoto et
2.2 Nanopipette aspiration
Baker’s group also employed nanopipettes but coupled with pressure-driven sampling to probe
single Allium cepa (Onion) cells and live Drosophila Melanogaster first instar larvae[16]. The
authors also performed lipid analyses from mouse brain tissue sections with a 50 m spatial
resolution.
In this study, the authors first characterized the volume aspirated as a function of the pressure
applied to the nanopipette and nanopipette geometry. The authors concluded that the aspiration
volume is linearly correlated with the applied pressure within the nL-L range for nanopipettes
with inner diameter larger than 200 nm. For nanopipettes smaller than 200nm the authors
observed a non-linear correlation between applied pressured and volume sample and attributed
the non-linearity to the length of the nanopipette shank. The authors established that liquid
manipulation in the low nL range required nanopipettes with 150-nm shank.
The authors then used a 600nm nanopipette to sample approximately 8 nL of the cytoplasm of
A. cepa cells which was then analysed with MALDI-MS (Figure 7 a). The peaks obtained in
the MS spectra were attributed to hexose-oligosaccharides which were observed as potassium
Figure 7. (a) Optical micrograph showing the nanopipette sampling a single A. cepa epidermal
cell. Inset: optical micrograph of the nanopipette after sampling (scale bar: 50 m). (b) Positive
ion MALDI-TOF mass spectrum of the sample extracted from a. The red asterisks mark peaks
attributed to metabolites from the cells while the high intensity peaks correspond to the internal
calibrant. (c) Schematic representation of the steps involved in segmented flow sampling with
a dual-barrel nanopipette. Inset shows a SEM micrograph of a dual-barrel nanopipette. (d)
Fluorescence micrograph of a nanopipette featuring 4 segmented samples of disodium
fluorescein. (e) Extracted ion chromatogram (EIC) from the segments shown in (d). (f)
Schematic representation of e) sampling and chemical reaction within the acidified electrolyte
barrel and direct electrospraying of the sampled content to the vacuum inlet of a mass
spectrometer. (g) Mass spectra of a single red Allium Cepa cell before (top panel) and after
(lower panel) acid-catalysed degradation of oligosaccharides. Peaks marked with a star showed
significant enhancement upon chemical degradation. The peaks labelled in red are
anthocyanins, in blue are oligosaccharides, and flavonoids are in black. Adapted from
Saha-Shah et al[16, 34, 35] with permission from the Royal Society of Chemistry.
To demonstrate the versatility of the technique for sampling complex biological samples, the
authors sampled the haemolymph of first instar D. melanogaster and mouse brain tissue and
analysed the extracted content with MALDI-MS. The article very interestingly expanded the
range of application of sampling technologies to plant cells, tissue slices and larvae and also
demonstrated that is fully compatible with state of the art mass spectrometry techniques.
Baker’s group also developed a method for the segmented flow sampling using double barrel
nanopipettes. Segmented flow sampling was achieved by filling both barrels of a dual-barrel
nanopipette with perfluorodecalin (PFD). The dual barrel nanopipette was first inserted into
content. Positive pressure from barrel 2 causes formation of an outward PFD meniscus than is
then aspirated in barrel 1 thanks to the application of a negative pressure[34]. This procedure
can then be repeated to create segment of sampled content sandwiched between immiscible
PFD layers a shown in Figure 7 c, d.
The sampled content can then be directly “electrosprayed” to the vacuum inlet of the mass
spectrometer without any transfer step (Figure 7f). The authors are still investigating the
mechanism of electrospraying from nanopipettes but indicated that a stable electrospray was
routinely achieved during MS analysis. Also in a subsequent publication, the same group
demonstrated that this method can also be used for the enrichment of specific oligosaccharide
via acid treatment within the nanopipette barrel[35]. The top panel of Figure 7g shows the mass
spectrum following the sampling from an Allium Cepa cell in a nanopipette barrel filled with
ultrapure water while the bottom panel shows the sampling into a methanol–water–acetic acid
(70:30:0.1) solution which induced an acid-catalysed degradation of oligosaccharides.
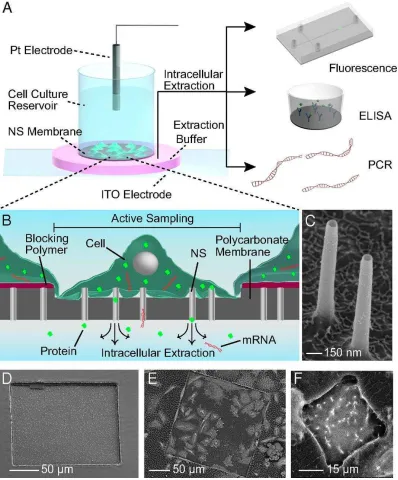
Nanostraws
An alternative approach to nanoprobe-based methods for extracting material from living cells
relies on nanostraws protruding from a polycarbonate membrane (Figure 8 a, b) [36].
Nanostraws are 150-nm wide, 1 m long cylindrical channels that are fabricated starting from
commercially available track-etched polycarbonate membrane. A thin layer of Al2O3 is
deposited on the membrane including the track etched tracks which will become the nanostraws
walls after careful etching. Photolithography is then used to define a precise sampling region
within the 1m - 1mm range (Figure 8 c, d, e, f).
Cells of interest can be cultured directly on the nanostraws-embedded substrate and in several
studies Melosh’s group demonstrated that nanostraws indeed penetrate the cell membrane and
diameter of 100 nm or smaller spontaneously penetrate the cell membrane, allowing the
delivery of small molecules into cells while nanostraws with a diameter of 150 nm and above
are engulfed by the cell without causing membrane rupture.
Cao et al demonstrated that the nanostraws platform is suitable for the longitudinal studies of
few cells (20/30 cells) but it can also be applied to single-cell sampling.
The authors employed 150-nm wide nanostraws that were engulfed by the cells but did not
provide a continuous fluidic intracellular access. Cytoplasmic access could be gained
temporary (2-5 minutes) thanks to the application of short electric pulses (10-35V) that cause
membrane poration and enable fluidic access. The authors demonstrated the feasibility of this
approach by longitudinally sampling GFP and RFP from CHO cells (38 cells were sampled
simultaneously) and confirming the successful extraction with fluorescence microscopy while
maintaining cell viability post-sampling of 95%. The authors also reduced the sampling
window to 100 m x 100 m which allowed the sampling from a single CHO cell expressing
RFP.
The authors also demonstrated that the nanostraws platform is suitable for sampling cells
derived in vitro from human induced pluripotent stem cells, cells that are notoriously delicate
while being an invaluable resource for drug discovery, disease modelling and cell therapy[40].
To demonstrate longitudinal sampling the authors employed an enzyme linked immunosorbent
assay (ELISA) to track the change in intracellular concentration of non-fluorescent heat-shock
protein 27 (HSP27) from hiPSC-derived cardiomyocytes (hiPSCCMs) upon exposure to heat
Figure 8. Schematic Representation of the nanostraws sampling platform. (A and B) The
platform is based on a polycarbonate membrane with protruding 150-nm diameter nanostraws
supported on a cell-culture dish. Sampling is performed by application of short voltage pulses
that temporarily electroporate the cells, allowing cellular content to diffuse through the NS and
into the underlying fluidic reservoir (highlighted in pink) which is then analysed using
fluorescence imaging, ELISA, or qPCR. (C) SEM micrographs of the 150-nm-diameter NS
and (D) the 200×200 µm active sampling region. Cells outside this window are unaffected by
[image:22.595.101.499.71.551.2]region containing 42 cells and (F) a 30×30 µm sampling region used to isolate and sample from
a single cell.
Moreover, the authors employed the nanostraws platform to track mRNA expression from
living hiPSCCMs for 3 days. Currently the sensitivity of mRNA sequencing systems is not able
to measure nanostraws extractions from single cells, instead requiring approximately 15–20
cells.
This article for the first time demonstrate longitudinal sampling from living cells and this
technology can sample cells in parallel rather than sequentially as with the scanning
probe-based methods.
Conclusion and Perspectives
This review highlighted the creative applications of nanoprobe-based methods for extracting
the consent of living cells without affecting their viability. These methods can be essentially
divided in two classes:
1. Mobile nanoprobe
2. Static nanoprobe
The mobile nanoprobe techniques such as DENT, FluidFM, and nanopipettes enable the
precise positioning of the nanoprobe with respect of the cell of interest. These methods are
generally integrated with nanomanipulators which allow automated positioning with nanoscale
resolution. Cells to be analysed can be cultured in “standard” environments such as Petri dishes
and these methods could also be amenable to the study of tissue slices and 3D cell cultures.
However, since the sampling has the be performed in a serial fashion these methods generally
lack of throughput.
polycarbonate membrane. Cells, however, need to be grown on the nanostraws substrate which
could prove difficult for tissue slices or 3D cell cultures.
The precise control over the amount of contents (or volume) extracted from a single cell is a
fundamental requirement to enable quantitative longitudinal sampling. This condition requires
the precise manipulation of liquids with sub pL resolution which is not trivial.
Guillaume-Gentil et al took advantage of the semitransparency of the FluidFM cantilevers to visualize and
quantify the extracted volume with 100fL resolution[14]. Actis et al also attempted to estimate
the volume aspirated with the nanobiopsy platform but only when aspirating from a buffer
solution and never while attempting a cell biopsy[13]. Nevertheless, Laforge et al analytically
derived an equation that correlates the nanopipette resistance with the amount of aqueous
solution drawn in the nanopipette during electrowetting which, in principle, could be used to
monitor the volume aspirated during nanobiopsy[30]. With the nanostraws technology, Cao et
al estimated the extracted GFP by measuring the difference in fluorescence intensity from cells
before and after sampling[36]. Similarly, Li et al used qPCR to correlate the voltage applied to
the DENT nanoprobes with the amount of nucleic acids extracted[41]. Despite all these efforts
for the accurate volume control during sampling, more work is needed to achieve the accuracy
necessary to move away from proof-of-concept studies and start tackling fundamental
biological questions.
Also, sub-cellular sampling opens up the question is the extracted sample is representative of
the cell. It is very likely that a 1-10% cytoplasmic subsample will not be truly representative
of the cytoplasm because sub-cellular localization of RNA is known to occur[42]. However,
techniques that visualise transcripts in situ, indicate that such localization does not occur for
all transcripts within a cell, and the methods described in this review have the ability to study
whether transcripts relevant to biological process (e.g drug treatment resistance) are localized
to noise within the system making true signal harder to distinguish but not impossible as long
as a careful power analysis is implemented.
Furthermore, the nanopipettes used for nanobiopsy experiments are fundamentally ultra-sharp
patch-clamp electrodes. Recent studies demonstrated that automated patch-clamp can be
performed in-vivo[43] indicating that nanopipette-based techniques can be employed for in-vivo
single-cell sampling.
A fundamental question that needs to be asked is why do we need to extract contents from
living cells? It can be argued that the interest lays in the information carried by these contents
more on the contents per se. Recently, optical methods for in-situ RNA sequencing with
sub-cellular resolution have been reported [44, 45] which enabled the high throughput study of the
spatial organization of RNA transcripts both in cultured cells and in tissue slices. Although
these methods have not been discussed in this review, they hold tremendous potential for
“sampling” information from cells and tissue with nanoscale resolution.
However, physically extracting contents from a single living cells still holds some key
advantages. It allows the downstream analysis of the extracted content with large analytical
tools such as electron microscopy or mass spectrometry while preserving cell viability and
spatial information. Also, it could enable “single-cell transplantation” where content from cell
A are transferred into cell B or, organelles transfer from cell to cell as a model to study the
evolution of eukaryotic cells[46]. The ability to physically extract contents underlies the ability
of perturbing a single cell by injecting foreign material. All the methods described in this
review except for the DENT technology have been used for the introduction of foreign material
in cells[26, 38, 47] and perturbation coupled with single-cell sampling is another frontier of this
References
1. A. Giladi; I. Amit, Nature 2017, 547 (7661), 27-29.
2. J. S. Marcus; W. F. Anderson; S. R. Quake, Anal Chem 2006, 78 (9), 3084-9. 3. I. C. Macaulay; W. Haerty; P. Kumar; Y. I. Li; T. X. Hu; M. J. Teng; M. Goolam; N. Saurat; P. Coupland; L. M. Shirley; M. Smith; N. Van der Aa; R. Banerjee; P. D. Ellis; M. A. Quail; H. P. Swerdlow; M. Zernicka-Goetz; F. J. Livesey; C. P. Ponting; T. Voet, Nat Methods
2015, 12 (6), 519-22.
4. S. Picelli; A. K. Bjorklund; O. R. Faridani; S. Sagasser; G. Winberg; R. Sandberg, Nat
Methods 2013, 10 (11), 1096-8.
5. M. Stoeckius; C. Hafemeister; W. Stephenson; B. Houck-Loomis; P. K. Chattopadhyay; H. Swerdlow; R. Satija; P. Smibert, Nat Methods 2017.
6. C. Gawad; W. Koh; S. R. Quake, Nat Rev Genet 2016, 17 (3), 175-88.
7. K. Shekhar; S. W. Lapan; I. E. Whitney; N. M. Tran; E. Z. Macosko; M. Kowalczyk; X. Adiconis; J. Z. Levin; J. Nemesh; M. Goldman; S. A. McCarroll; C. L. Cepko; A. Regev; J. R. Sanes, Cell 2016, 166 (5), 1308-+.
8. C. Ziegenhain; B. Vieth; S. Parekh; B. Reinius; A. Guillaumet-Adkins; M. Smets; H. Leonhardt; H. Heyn; I. Hellmann; W. Enard, Mol Cell 2017, 65 (4), 631-+.
9. S. T. Aviv Regev, Eric S. Lander, Ido Amit, Christophe Benoist, Ewan Birney, Bernd Bodenmiller, Peter Campbell, Piero Carninci, Menna Clatworthy, Hans Clevers, Bart
Deplancke, Ian Dunham, James Eberwine, Roland Eils, Wolfgang Enard, Andrew Farmer, Lars Fugger, Berthold Gottgens, Nir Hacohen, Muzlifah Haniffa, Martin Hemberg, Seung K. Kim, Paul Klenerman, Arnold Kriegstein, Ed Lein, Sten Linnarsson, Joakim Lundeberg, Partha Majumder, John Marioni, Miriam Merad, Musa Mhlanga, Martijn Nawijn, Mihai Netea, Garry Nolan, Dana Pe'er, Anthony Philipakis, Chris P. Ponting, Stephen R. Quake, Wolf Reik, Orit Rozenblatt-Rosen, Joshua R. Sanes, Rahul Satija, Ton Shumacher, Alex K. Shalek, Ehud Shapiro, Padmanee Sharma, Jay Shin, Oliver Stegle, Michael Stratton, Michael J. T.
Stubbington, Alexander van Oudenaarden, Allon Wagner, Fiona M. Watt, Jonathan S. Weissman, Barbara Wold, Ramnik J. Xavier, Nir Yosef, bioRxiv 2017.
10. R. Zenobi, Science 2013, 342 (6163), 1201-+.
11. Y. Wang; N. E. Navin, Mol Cell 2015, 58 (4), 598-609.
12. O. Stegle; S. A. Teichmann; J. C. Marioni, Nature Reviews Genetics 2015, 16 (3), 133-145.
13. P. Actis; M. M. Maalouf; H. J. Kim; A. Lohith; B. Vilozny; R. A. Seger; N. Pourmand,
ACS Nano 2014, 8 (1), 546-53.
14. O. Guillaume-Gentil; R. V. Grindberg; R. Kooger; L. Dorwling-Carter; V. Martinez; D. Ossola; M. Pilhofer; T. Zambelli; J. A. Vorholt, Cell 2016, 166 (2), 506-16.
15. O. Guillaume-Gentil; T. Rey; P. Kiefer; A. J. Ibanez; R. Steinhoff; R. Bronnimann; L. Dorwling-Carter; T. Zambelli; R. Zenobi; J. A. Vorholt, Anal Chem 2017, 89 (9), 5017-5023. 16. A. Saha-Shah; A. E. Weber; J. A. Karty; S. J. Ray; G. M. Hieftje; L. A. Baker, Chem Sci
2015, 6 (6), 3334-3341.
17. R. Singhal; Z. Orynbayeva; R. V. Kalyana Sundaram; J. J. Niu; S. Bhattacharyya; E. A. Vitol; M. G. Schrlau; E. S. Papazoglou; G. Friedman; Y. Gogotsi, Nat Nanotechnol 2011, 6 (1), 57-64.
18. Z. Yang; L. Deng; Y. Lan; X. Zhang; Z. Gao; C. W. Chu; D. Cai; Z. Ren, Proc Natl Acad Sci
19. R. Yan; J. H. Park; Y. Choi; C. J. Heo; S. M. Yang; L. P. Lee; P. Yang, Nat Nanotechnol
2011, 7 (3), 191-6.
20. J. P. Giraldo-Vela; W. Kang; R. L. McNaughton; X. M. Zhang; B. M. Wile; A. Tsourkas; G. Bao; H. D. Espinosa, Small 2015, 11 (20), 2386-2391.
21. S. G. Higgins; M. M. Stevens, Science 2017, 356 (6336), 379-380.
22. D. Nawarathna; T. Turan; H. K. Wickramasinghe, Appl Phys Lett 2009, 95 (8). 23. Y. L. Tao; H. K. Wickramasinghe, Appl Phys Lett 2017, 110 (7).
24. D. Nawarathna; R. Chang; E. Nelson; H. K. Wickramasinghe, Anal Biochem 2011, 408
(2), 342-4.
25. X. Li; Y. L. Tao; D. H. Lee; H. K. Wickramasinghe; A. P. Lee, Lab on a Chip 2017, 17 (9), 1635-1644.
26. O. Guillaume-Gentil; E. Potthoff; D. Ossola; P. Dorig; T. Zambelli; J. A. Vorholt, Small
2013, 9 (11), 1904-7.
27. L. Zhao; C. D. Kroenke; J. Song; D. Piwnica-Worms; J. J. H. Ackerman; J. J. Neil, Nmr
Biomed 2008, 21 (2), 159-164.
28. P. Novak; C. Li; A. I. Shevchuk; R. Stepanyan; M. Caldwell; S. Hughes; T. G. Smart; J. Gorelik; V. P. Ostanin; M. J. Lab; G. W. J. Moss; G. I. Frolenkov; D. Klenerman; Y. E. Korchev,
Nat Methods 2009, 6 (12), 935-935.
29. Y. E. Korchev; C. L. Bashford; M. Milovanovic; I. Vodyanoy; M. J. Lab, Biophysical
Journal 1997, 73 (2), 653-658.
30. F. O. Laforge; J. Carpino; S. A. Rotenberg; M. V. Mirkin, P Natl Acad Sci USA 2007, 104
(29), 11895-11900.
31. J. R. Friedman; J. Nunnari, Nature 2014, 505 (7483), 335-343.
32. Y. P. He; J. Wu; D. C. Dressman; C. Iacobuzio-Donahue; S. D. Markowitz; V. E. Velculescu; L. A. Diaz; K. W. Kinzler; B. Vogelstein; N. Papadopoulos, Nature 2010, 464
(7288), 610-U175.
33. Y. Nashimoto; Y. Takahashi; Y. S. Zhou; H. Ito; H. Ida; K. Ino; T. Matsue; H. Shiku, ACS
Nano 2016, 10 (7), 6915-6922.
34. A. Saha-Shah; C. M. Green; D. H. Abraham; L. A. Baker, Analyst 2016, 141 (6), 1958-1965.
35. A. Saha-Shah; J. A. Karty; L. A. Baker, Analyst 2017, 142 (9), 1512-1518.
36. Y. H. Cao; M. Hjort; H. D. Chen; F. Birey; S. A. Leal-Ortiz; C. M. Han; J. G. Santiago; S. P. Pasca; J. C. Wu; N. A. Melosh, P Natl Acad Sci USA 2017, 114 (10), E1866-E1874.
37. J. J. VanDersarl; A. M. Xu; N. A. Melosh, Nano Letters 2012, 12 (8), 3881-3886. 38. X. Xie; A. M. Xu; S. Leal-Ortiz; Y. H. Cao; C. C. Garner; N. A. Melosh, Acs Nano 2013, 7
(5), 4351-4358.
39. A. M. Xu; A. Aalipour; S. Leal-Ortiz; A. H. Mekhdjian; X. Xie; A. R. Dunn; C. C. Garner; N. A. Melosh, Nature Communications 2014, 5.
40. V. Tabar; L. Studer, Nature Reviews Genetics 2014, 15 (2), 82-92.
41. X. Li; Y. Tao; D. H. Lee; H. K. Wickramasinghe; A. P. Lee, Lab Chip 2017, 17 (9), 1635-1644.
42. N. Battich; T. Stoeger; L. Pelkmans, Nat Meth 2013, 10 (11), 1127-1133.
43. S. B. Kodandaramaiah; G. T. Franzesi; B. Y. Chow; E. S. Boyden; C. R. Forest, Nat
Methods 2012, 9 (6), 585-7.
45. F. Chen; A. T. Wassie; A. J. Cote; A. Sinha; S. Alon; S. Asano; E. R. Daugharthy; J. B. Chang; A. Marblestone; G. M. Church; A. Raj; E. S. Boyden, Nat Methods 2016, 13 (8), 679-84.
46. P. Tiefenboeck; J. A. Kim; F. Trunk; T. Eicher; E. Russo; A. Teijeira; C. Halin; J. C. Leroux, ACS Nano 2017.
47. R. Adam Seger; P. Actis; C. Penfold; M. Maalouf; B. Vilozny; N. Pourmand, Nanoscale
2012, 4 (19), 5843-6.