This is a repository copy of
Search for dark matter and other new phenomena in events
with an energetic jet and large missing transverse momentum using the ATLAS detector
.
White Rose Research Online URL for this paper:
http://eprints.whiterose.ac.uk/132858/
Version: Published Version
Article:
Aaboud, M, Aad, G, Abbott, B et al. (966 more authors) (2018) Search for dark matter and
other new phenomena in events with an energetic jet and large missing transverse
momentum using the ATLAS detector. Journal of High Energy Physics (1). 126. ISSN
1029-8479
https://doi.org/10.1007/JHEP01(2018)126
Reuse
This article is distributed under the terms of the Creative Commons Attribution (CC BY) licence. This licence allows you to distribute, remix, tweak, and build upon the work, even commercially, as long as you credit the authors for the original work. More information and the full terms of the licence here:
https://creativecommons.org/licenses/
Takedown
If you consider content in White Rose Research Online to be in breach of UK law, please notify us by
JHEP01(2018)126
Published for SISSA by SpringerReceived: November 10, 2017 Revised: December 14, 2017 Accepted: January 14, 2018 Published: January 25, 2018
Search for dark matter and other new phenomena in
events with an energetic jet and large missing
transverse momentum using the ATLAS detector
The ATLAS collaboration
E-mail: [email protected]
Abstract: Results of a search for new phenomena in final states with an energetic jet
and large missing transverse momentum are reported. The search uses proton-proton collision data corresponding to an integrated luminosity of 36.1 fb−1 at a centre-of-mass energy of 13 TeV collected in 2015 and 2016 with the ATLAS detector at the Large Hadron Collider. Events are required to have at least one jet with a transverse momentum above 250 GeV and no leptons (e or µ). Several signal regions are considered with increasing requirements on the missing transverse momentum above 250 GeV. Good agreement is observed between the number of events in data and Standard Model predictions. The results are translated into exclusion limits in models with pair-produced weakly interacting dark-matter candidates, large extra spatial dimensions, and supersymmetric particles in several compressed scenarios.
Keywords: Hadron-Hadron scattering (experiments)
JHEP01(2018)126
Contents1 Introduction 1
2 ATLAS detector 5
3 Monte Carlo simulation 5
3.1 Signal simulation 6
3.2 Background simulation 7
4 Event reconstruction 8
5 Event selection 9
6 Background estimation 10
6.1 Control samples 11
6.2 Multijet background 12
6.3 Non-collision background 12
6.4 Background fit 12
7 Systematic uncertainties 13
7.1 Background systematic uncertainties 13
7.2 Signal systematic uncertainties 17
8 Results and interpretation 17
8.1 Model-independent exclusion limits 20
8.2 Weakly interacting massive particles 20
8.3 Squark-pair production 25
8.4 Large extra spatial dimensions 27
9 Conclusions 28
The ATLAS collaboration 36
1 Introduction
This paper presents the results of a search for events containing an energetic jet and large missing transverse momentum ~pTmiss (with magnitude E
miss
T ) in a data sample cor-responding to a total integrated luminosity of 36.1 fb−1. The data were collected by the ATLAS Collaboration at the Large Hadron Collider (LHC) from proton-proton collisions at a centre-of-mass energy (√s) of 13 TeV. The final-state monojet signature of at least one energetic jet, Emiss
JHEP01(2018)126
signature for new physics beyond the Standard Model (SM) at colliders. The monojet signature has been extensively studied at the LHC in the context of searches for large extra spatial dimensions (LED), supersymmetry (SUSY), and weakly interacting massive particles (WIMPs) as candidates for dark matter (DM) [1–3]. The results of the analy-sis are therefore interpreted in terms of each of these models, which are described in the following paragraphs.
A range of astrophysical measurements, such as the rotational speed of stars in galaxies and gravitational lensing, point to the existence of a non-baryonic form of matter [4–6]. The existence of a new, weakly interacting massive particle is often hypothesized [7], as it leads to the correct relic density for non-relativistic matter in the early universe [8] as measured from data from the Planck [9] and WMAP [10] Collaborations, if the mass is between a few GeV and one TeV and if it has electroweak-scale interaction cross sections. WIMPs may be pair-produced at the LHC and when accompanied by a jet of particles, for example from initial-state radiation (ISR), these events produce the signature of a jet and missing transverse momentum.
As with the initial results obtained in this search channel at√s= 13 TeV [1], simplified models are used to interpret the results, providing a framework to characterize the new particles acting as mediators of the interaction between the SM and the dark sector [11–
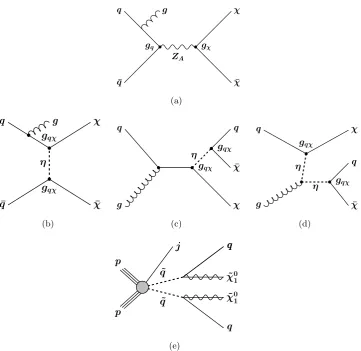
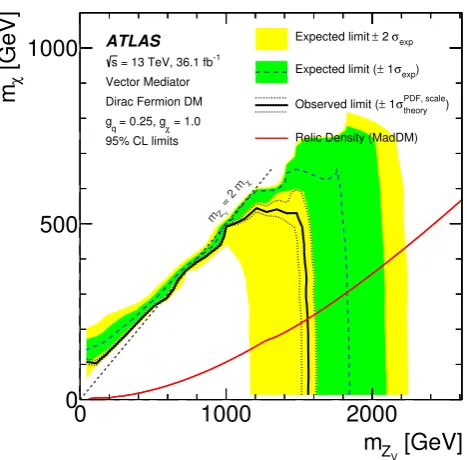
13]. The results from simplified models involving s-channel Feynman diagrams such as the one shown in figure1(a) are comparable to those previously obtained [14] by using an effective-field-theory approach [15] when the mediator mass considered is above 10 TeV [16]. Results are presented for DM models where Dirac fermion WIMPs (χ) are pair-produced from quarks via s-channel exchange of a spin-1 mediator particle (ZA) with axial-vector couplings, a spin-1 mediator particle (ZV) with vector couplings, or a spin-0 pseudoscalar (ZP). These models are defined by four free parameters: the WIMP mass (mχ); the mediator mass (mZA, mZV or mZP, depending on the model); the
flavour-universal coupling to quarks (gq), where all three quark generations are included; and the coupling of the mediator to WIMPs (gχ). Couplings to other SM particles are not consid-ered. In each case, a minimal mediator width is defined, as detailed in refs. [12,13], which in the case of the axial-vector mediator takes the form:
Γ(mZA)min= g2
χmZA
12π β
3
χθ(mZA−2mχ) +
X
q 3g2
qmZA
12π β
3
qθ(mZA −2mq),
where θ(x) denotes the Heaviside step function and βf =
q
1−4m2f/m2Z
A is the velocity
in the mediator rest frame of fermionf (eitherχorq) with massmf. The quark sum runs over all flavours. The monojet signature in this model emerges from initial-state radiation of a gluon as shown in figure1(a).
JHEP01(2018)126
q g
¯
q gq
ZA
χ
¯
χ gχ
(a)
q g
¯ q
η gqχ
χ
¯ χ gqχ
(b)
q
g
η gqχ
χ
¯
χ gqχ
q
(c)
q
gqχ
η
g
η
χ
¯
χ gqχ
q
(d)
q q
˜
χ0 1
˜
χ0 1
q
j
˜
q
˜
q
p
p
[image:5.595.119.481.78.429.2](e)
Figure 1. (a) Diagram for the pair-production of weakly interacting massive particles χ, with a
mediatorZAwith axial-vector couplings exchanged in thes-channel. (b)(c)(d)Example of diagrams
for the pair-production of weakly interacting massive particlesχ via a coloured scalar mediatorη.
(e) A generic diagram for the pair-production of squarks with the decay mode ˜q →q+ ˜χ01. The
presence of a gluon from initial-state radiation resulting in a jet is indicated for illustration purposes.
mediators, leading to a different phenomenology. A set of representative diagrams relevant for a monojet final state are collected in figures 1(b)–1(d). A model with simplified as-sumptions is defined by the following three parameters: mχ, a single mediator mass (mη), and a flavour-universal coupling to quarks and WIMPs (gqχ ≡ g). The mediator is also assumed to couple only to the first two generations of quarks, with minimal decay widths of the form:
Γ(η)min=
g2
16πm3 η
m2η−m2q−m2χ r
m2
η−(mq+mχ)2 m2η−(mq−mχ)2
,
where, to ensure that the DM particle is stable and the mediator width is always defined,
m2
χ+m2q < m2η and 4m2χ/m2η < 1−m2q/m2η+m2χ/m2η
2
are required.
JHEP01(2018)126
field is associated with each left- or right-handed quark state. Two squark mass eigenstates ˜
q1 and ˜q2 result from the mixing of the scalar fields for a particular flavour. Naturalness arguments suggest that the third-generation squarks should be light, with masses below about 1 TeV [29]. In addition, many SUSY scenarios have a significant mass difference be-tween the two eigenstates in the bottom-squark (sbottom) and top-squark (stop) sectors, which leads to light sbottom ˜b1 and stop ˜t1 masses. In supersymmetric extensions of the SM that assume R-parity conservation [30–34], sparticles are produced in pairs and the lightest supersymmetric particle (LSP) is stable. The LSP is assumed to be the lightest neutralino ˜χ01.
The results are interpreted in terms of searches for squark production using simplified models in scenarios for which the mass difference ∆m≡ mq˜−mχ˜0
1 is small
(compressed-mass scenario). Four such scenarios with compressed (compressed-mass spectra are considered: stop-pair production, where the stop decays into a charm quark and the LSP (˜t1 →c+ ˜χ
0
1), stop-pair
production in the four-body decay mode ˜t1 →b+f f
′
+ ˜χ01, sbottom-pair production with ˜b1 → b+ ˜χ01, and squark-pair production with ˜q → q+ ˜χ01 (q = u, d, c, s). For relatively small ∆m (. 25 GeV), both the transverse momenta of the quark jets and the ETmiss in the final state are small, making it difficult to fully reconstruct the signal given the kinematic thresholds for reconstruction. The presence of jets from ISR is thus used to identify signal events (see figure 1(e)). In this case, the squark-pair system is boosted, leading to larger ETmiss.
The final model considered is that of extra spatial dimensions, the existence of which has been postulated to explain the large difference between the electroweak unification scale atO(102) GeV and the Planck scaleMPlatO(1019) GeV. In the Arkani-Hamed, Dimopou-los, and Dvali (ADD) model of LED [35], the presence ofnextra spatial dimensions of size
R leads to a fundamental Planck scale in 4 +n dimensions given by MPl2 ∼ MD2+nRn, where MD is the fundamental scale of the 4 +n-dimensional theory. Motivation for the theory comes from the possibility thatMD is of order 1 TeV, a scale accessible at the LHC. In this model, SM particles and gauge interactions are confined to the usual 3+1 space-time dimensions, whereas gravity is free to propagate through the entire multidimensional space, which effectively dilutes its perceived strength. The extra spatial dimensions are compactified, resulting in a Kaluza-Klein tower of massive graviton modes (KK graviton). If produced in high-energy proton-proton collisions, a KK graviton escaping into the extra dimensions can be inferred fromETmiss, and can lead to a monojet event signature.
JHEP01(2018)126
2 ATLAS detectorThe ATLAS detector [36] covers almost the whole solid angle1 around the collision point
with layers of tracking detectors, calorimeters and muon chambers. The ATLAS inner detector covers the pseudorapidity range|η|<2.5. It consists of a silicon pixel detector, a silicon microstrip detector, and a straw-tube tracker that also measures transition radiation for particle identification, all immersed in a 2 T axial magnetic field produced by a solenoid. During the first LHC long shutdown, a new tracking layer, known as the insertable B-Layer [37], was added just outside a narrower beam pipe at a radius of 33 mm.
High-granularity lead/liquid-argon (LAr) electromagnetic sampling calorimeters cover the pseudorapidity range|η|<3.2. Hadronic calorimetry in the range|η|<1.7 is provided by a steel/scintillator-tile calorimeter, consisting of a large barrel and two smaller extended barrel cylinders, one on either side of the central barrel. In the endcaps (|η|> 1.5), cop-per/LAr and tungsten/LAr hadronic calorimeters match the outer |η|limits of the endcap electromagnetic calorimeters. The LAr forward calorimeters provide both the electromag-netic and hadronic energy measurements, and extend the coverage to |η|<4.9.
The muon spectrometer measures the deflection of muons in the magnetic field provided by large superconducting air-core toroidal magnets in the pseudorapidity range |η|<2.7, instrumented with separate trigger and high-precision tracking chambers. Over most of the
η range, a measurement of the track coordinates in the bending direction of the magnetic field is provided by monitored drift tubes. Cathode strip chambers with higher granularity are used in the innermost plane over 2.0<|η|<2.7. The muon fast trigger detectors cover the pseudorapidity range |η| < 2.4 and provide a measurement of the coordinate in the non-bending plane.
The data were collected using an online two-level trigger system [38] that selects events of interest and reduces the event rate from an average of 33 MHz to about 1 kHz for recording and offline processing.
3 Monte Carlo simulation
Monte Carlo (MC) simulated event samples are used to compute detector acceptance and reconstruction efficiencies, determine signal and background contributions, and estimate systematic uncertainties in the final results. Samples are processed with the full ATLAS detector simulation [39] based on Geant4 [40]. Simulated events are then reconstructed
and analysed with the same analysis chain as for the data, using the same trigger and event selection criteria. The effects of multiple proton-proton interactions in the same or neighbouring bunch-crossings (pile-up) are taken into account by overlaying simulated minimum-bias events fromPythia8.205 [41] onto the hard-scattering process, distributed
according to the frequency in data.
JHEP01(2018)126
3.1 Signal simulation
WIMPs-channel signal samples are simulated inPowheg-Box v2 [42–44] (revision 3049)
using two implementations of simplified models, introduced in ref. [45]. The DMV model of WIMP-pair production is used fors-channel spin-1 axial-vector or vector mediator exchange at next-to-leading order (NLO) in the strong coupling, and the DMS tloop model is used for WIMP-pair production with thes-channel spin-0 pseudoscalar mediator exchange with the full quark-loop calculation at leading order (LO) [46]. Renormalization and factorization scales are set to HT/2 on an event-by-event basis, where HT =
q
m2
χχ+p2T,j1 +pT,j1 is defined by the invariant mass of the WIMP pair (mχχ) and the transverse momentum of the highest-pT parton-level jet (pT,j1). The mediator propagator is described by a Breit-Wigner distribution. Events are generated using the NNPDF30 [47] parton distribution functions (PDFs) and interfaced to Pythia 8.205 with the A14 set of tuned parameters
(tune) [48] for parton showering, hadronization and the underlying event. Couplings of the mediator to WIMP particles and those of the SM quarks are set to gχ = 1 and gq = 1/4 for the DMV model whereas both couplings are set to one in the case of the DMS tloop model. A grid of samples is produced for WIMP masses ranging from 1 GeV to 1 TeV and mediator masses between 10 GeV and 10 TeV.
Samples for DM production in the coloured scalar mediator model are generated with MG5 aMC@NLO v2.3.3 [49] at LO using NNPDF23LO [50] PDFs and interfaced toPythia8.186 with the A14 tune for modelling of parton showering, hadronization and
the underlying event. The generation of the different subprocesses is performed following a procedure outlined in ref. [18]. Specifically, the generation is split between DM produc-tion with an off-shell mediator and on-shell mediator producproduc-tion followed by decay, and the associated production of up to two partons in the final state is included. As already mentioned, only diagrams involving the first two quark generations are considered and pro-cesses with electroweak bosons are suppressed. The matching between MadGraph and Pythiais performed following the CKKW-L prescription [51]. The parton matching scale
is set to mη/8, where mη denotes the mass of the mediator, in the case of mediator-pair production, and to 30 GeV otherwise. This particular choice of matching scales optimizes the generation of the samples in the full phase space, and minimizes the impact from scale variations on the shape of the predicted kinematic distributions. The coupling is set to
g= 1, and a grid of samples is produced for WIMP masses ranging from 1 GeV to 1 TeV and mediator masses between 100 GeV and 2.5 TeV.
SUSY signals for stop-pair production are generated with MG5 aMC@NLO v2.2.3 and interfaced to Pythia 8.186 with the A14 tune for modelling of the squark decay,
parton showering, hadronization, and the underlying event. The PDF set used for the generation is NNPDF23LO, and the renormalization and factorization scales are set to
µ=P
i
q
m2 i +p
2
cou-JHEP01(2018)126
pling constant, adding the resummation of soft-gluon emission at next-to-leading-logarithm (NLO+NLL) accuracy [52–54]. The nominal cross section and its uncertainty are taken from an envelope of cross-section predictions using different PDF sets and factorization and renormalization scales, as described in ref. [55]. Simulated samples are produced with squark masses in the range between 250 GeV and 700 GeV, and squark-neutralino mass differences ∆m varying between 5 GeV and 25 GeV.
Simulated samples for the ADD LED model with different numbers of extra dimen-sions in the range n = 2–6 and a fundamental scale MD in the range 3.0–5.3 TeV are generated using Pythia8.205 with NNPDF23LO PDFs. The renormalization scale is set
to the geometric mean of the squared transverse masses of the two produced particles,
q
(p2
T,G+m 2 G)(p
2
T,p+m2p), where pT,G and mG (pT,p and mp) denote, respectively, the mass and the transverse momentum of the KK graviton (parton) in the final state. The factorization scale is set to the minimum transverse mass, qp2T+m2, of the KK graviton and the parton.
3.2 Background simulation
After applying the selection described in section5, the primary SM background contribut-ing to monojet event signatures is Z(→νν¯)+jets. There are also significant contributions fromW+jets events, primarily fromW(→τ ν)+jets. Small contributions are expected from
Z/γ∗(→ℓ+ℓ−)+jets (ℓ=e, µ, τ), multijet,t¯t, single-top, and diboson (W W, W Z, ZZ) pro-cesses. Contributions from top-quark production associated with additional vector bosons (tt¯+W,tt¯+Z, ort+Z+q/bprocesses) are negligible and not considered in this analysis. Events containing W or Z bosons with associated jets are simulated using the
Sherpa 2.2.1 [56] event generator. Matrix elements (ME) are calculated for up to two
partons at NLO and four partons at LO using OpenLoops [57] and Comix [58], and merged with theSherpa parton shower (PS) [59] using the ME+PS@NLO prescription [60]. The
NNPDF3.0NNLO [47] PDF set is used in conjunction with a dedicated parton-shower tun-ing developed by the authors of Sherpa. The MC predictions are initially normalized to
next-to-next-to-leading-order (NNLO) perturbative QCD (pQCD) predictions according to DYNNLO [61,62] using the MSTW2008 90% CL NNLO PDF set [63].
The W+jets and Z+jets MC predictions are reweighted to account for higher-order QCD and electroweak corrections as described in ref. [64], where parton-level predictions for
W/Z+jets production, including NLO QCD corrections and NLO electroweak corrections supplemented by Sudakov logarithms at two loops, are provided as a function of the vector-boson pT, improving the description of the measured Z-boson pT distribution [65]. The predictions are provided separately for the differentW+jets andZ+jets processes together with the means for a proper estimation of theoretical uncertainties and their correlations (see section 7). The reweighting procedure takes into account the difference between the QCD NLO predictions as included already inSherpa and as provided by the parton-level
calculations.
For the generation of t¯t and single top quarks in the W t-channel and s-channel, the
JHEP01(2018)126
single-top-quark events are generated using the Powheg-Box v1 event generator. This
event generator uses the four-flavour scheme to calculate NLO matrix elements, with the CT10 four-flavour PDF set. The parton shower, hadronization, and underlying event are simulated usingPythia8.205 with the A14 tune. The top-quark mass is set to 172.5 GeV.
The EvtGen v1.2.0 program [68] is used to model the decays of the bottom and charm hadrons. Alternative samples are generated using MadGraph5 aMC@NLO (v2.2.1) [49]
interfaced to Herwig++ (v2.7.1) [69] in order to estimate the effects of the choice of matrix-element event generator and parton-shower algorithm.
Diboson samples (W W, W Z, and ZZ production) are generated using either
Sherpa 2.2.1 or Sherpa 2.1.1 with NNPDF3.0NNLO or CT10nlo PDFs, respectively,
and are normalized to NLO pQCD predictions [70]. Diboson samples are also generated using Powheg-Box [43] interfaced to Pythia8.186 and using CT10 PDFs for studies of
systematic uncertainties.
4 Event reconstruction
Jets are reconstructed from energy deposits in the calorimeters using the anti-kt jet al-gorithm [71, 72] with the radius parameter (in y–φ space) set to 0.4. The measured jet transverse momentum is corrected for detector effects by weighting energy deposits arising from electromagnetic and hadronic showers differently. In addition, jets are corrected for contributions from pile-up, as described in ref. [73]. Jets with pT >20 GeV and|η|<2.8 are considered in the analysis. Track-based variables to suppress pile-up jets have been developed, and a combination of two such variables, called the jet-vertex tagger [74], is constructed. In order to remove jets originating from pile-up collisions, for central jets (|η|<2.4) with pT <50 GeV a significant fraction of the tracks associated with each jet must have an origin compatible with the primary vertex, as defined by the jet-vertex tagger. Jets with pT>30 GeV and|η|<2.5 are identified as b-jets if tagged by a multivariate algorithm which uses information about the impact parameters of inner-detector tracks matched to the jet, the presence of displaced secondary vertices, and the reconstructed flight paths of b- and c-hadrons inside the jet [75,76]. A 60% efficient b-tagging working point, as determined in a simulated sample of t¯tevents, is chosen. This corresponds to a rejection factor of approximately 1500, 35 and 180 for light-quark and gluon jets, c-jets, and τ-leptons decaying hadronically, respectively.
The presence of electrons or muons in the final state is used in the analysis to de-fine control samples and to reject background contributions in the signal regions (see sec-tions5 and 6).
Electrons are found by combining energy deposits in the calorimeter with tracks found in the inner detector, and are initially required to have pT > 20 GeV and |η| < 2.47, to satisfy the ‘Loose’ electron shower shape and track selection criteria described in refs. [77], and must also be isolated. The latter uses track-based isolation requirements with an efficiency of about 99%, as determined using Z/γ∗(→ e+e−) data. Overlaps between identified electrons and jets with pT > 30 GeV in the final state are resolved. Jets are discarded if they are not b-tagged and their separation ∆R = p
JHEP01(2018)126
identified electron is less than 0.2. Otherwise, the electron is removed as it most likely originates from a semileptonic b-hadron decay. The electrons separated by ∆R between 0.2 and 0.4 from any remaining jet are removed.
Muon candidates are formed by combining information from the muon spectrometer and inner tracking detectors. They are required to pass ‘Medium’ identification require-ments, as described in ref. [78], and to have pT > 10 GeV and |η| < 2.5. Jets with
pT > 30 GeV and fewer than three tracks with pT > 0.5 GeV associated with them are discarded if their separation ∆R from an identified muon is less than 0.4. The muon is discarded if it is matched to a jet withpT >30 GeV that has at least three tracks associated with it.
The ETmiss value is reconstructed using all energy deposits in the calorimeter up to pseudorapidity |η| = 4.9. Clusters associated with either electrons, photons or jets with
pT > 20 GeV make use of the corresponding calibrations. Softer jets and clusters not associated with electrons, photons or jets are calibrated using tracking information [79]. As discussed below, in this analysis the missing transverse momentum is not corrected for the presence of muons in the final state.
5 Event selection
The data sample considered corresponds to a total integrated luminosity of 36.1 fb−1, and was collected in 2015 and 2016. The uncertainty in the combined 2015+2016 integrated luminosity is 3.2%. It is derived, following a methodology similar to that detailed in ref. [80], from a calibration of the luminosity scale using x–y beam-separation scans performed in August 2015 and May 2016. The data were collected using a trigger that selects events with ETmiss above 90 GeV, as computed from calorimetry information at the final stage of the two-level trigger system. After analysis selections, the trigger was measured to be fully efficient for events with ETmiss > 250 GeV, as determined using a data sample with muons in the final state. Events are required to have at least one reconstructed primary vertex consistent with the beamspot envelope and that contains at least two associated tracks of pT > 0.4 GeV. When more than one such vertex is found, the vertex with the largest summedp2
Tof the associated tracks is chosen. Events having identified muons with
pT >10 GeV or electrons with pT>20 GeV in the final state are vetoed.
Events are selected with ETmiss > 250 GeV, a leading jet with pT,j1 > 250 GeV and
|η| < 2.4, and a maximum of four jets with pT > 30 GeV and |η| < 2.8. Separation in the azimuthal angle of ∆φ(jet, ~pTmiss) > 0.4 between the missing transverse momentum direction and each selected jet is required to reduce the multijet background contribution, where a large Emiss
T can originate from jet energy mismeasurement.
Jet quality criteria [81] are imposed, which involve selections based on quantities such as the pulse shape of the energy depositions in the cells of the calorimeters, electromagnetic fraction in the calorimeter, calorimeter sampling fraction, and the charged-particle frac-tion.2 Loose selection criteria are applied to all jets withpT >30 GeV and|η|<2.8, which remove anomalous energy depositions due to coherent noise and electronic noise bursts in
2The charged-particle fraction is defined asf
ch=Pptrack,jetT /p jet T, where
P
JHEP01(2018)126
Inclusive (IM) IM1 IM2 IM3 IM4 IM5 IM6 IM7 IM8 IM9 IM10
Emiss
T [GeV] >250 >300 >350 >400 >500 >600 >700 >800 >900 >1000
Exclusive (EM) EM1 EM2 EM3 EM4 EM5 EM6 EM7 EM8 EM9 EM10
Emiss
[image:12.595.104.493.85.134.2]T [GeV] 250–300 300–350 350–400 400–500 500–600 600–700 700–800 800–900 900–1000 >1000
Table 1. Inclusive (IM1–IM10) and exclusive (EM1–EM10) signal regions with increasing Emiss
T
thresholds from 250 GeV to 1000 GeV. In the case of IM10 and EM10, both signal regions contain the same selected events in data. In the case of the IM10 signal region, the background predictions are computed considering only data and simulated events withETmiss>1 TeV, whereas the EM10
background prediction is obtained from fitting the full Emiss
T shape in data and simulation, as
described in section6.
the calorimeter [82]. Events with any jet not satisfying the loose criteria, as described in ref. [81], are discarded.
Non-collision backgrounds, for example energy depositions in the calorimeters due to muons of beam-induced or cosmic-ray origin, are suppressed by imposing tight selection criteria on the leading jet and the ratio of the jet charged-particle fraction to the calorimeter sampling fraction,3 fch/fmax, is required to be larger than 0.1. These requirements have a negligible effect on the signal efficiency.
The analysis uses two sets of signal regions, with inclusive and exclusive Emiss T se-lections, where the regions are defined with increasing ETmiss thresholds from 250 GeV to 1000 GeV (table 1). The inclusive selections are used for a model-independent search for new physics, and the exclusive selections are used for the interpretation of the results within different models of new physics.
6 Background estimation
The W+jets, Z+jets, and top-quark-related backgrounds are constrained using MC event samples normalized with data in selected control regions. By construction, there is no overlap between events in the signal and the different control regions. The control regions are defined using the same requirements forETmiss, leading-jet pT, event topologies, and jet vetoes as in the signal regions, such that no extrapolation in ETmissor jetpT is needed from control to signal regions. The normalization factors are extracted simultaneously using a global fit that includes systematic uncertainties, to properly take into account correlations. Different control samples are used to help constrain the yields of the W+jets and
Z+jets background processes in the signal regions. This includes W(→ µν)+jets, W(→
eν)+jets, and Z/γ∗(→ µ+µ−)+jets control samples, enriched in W(→ µν)+jets, W(→
eν)+jets, and Z/γ∗(→ µ+µ−)+jets background processes, respectively. The dominant
Z(→ νν¯)+jets and W(→ τ ν)+jets background contributions are constrained in the fit by using both W+jets control regions and the Z/γ∗(→ µ+µ−)+jets control region. As
of the transverse momenta of tracks associated with the primary vertex within a cone of radius ∆R = 0.4 around the jet axis, andpjetT is the transverse momentum of the jet as determined from calorimetric measurements.
3The variable f
JHEP01(2018)126
discussed in section6.4, this translates into a reduced uncertainty in the estimation of the main irreducible background contribution, due to a partial cancelling out of systematic uncertainties and the superior statistical power of the W+jets control sample in data, compared to that of theZ/γ∗(→µ+µ−)+jets control sample. A smallZ/γ∗(→e+e−)+jets and Z/γ∗(→τ+τ−)+jets background contribution is also constrained via the W+jets and
Z/γ∗(→µ+µ−)+jets control samples.4
Finally, a top control sample constrains top-quark-related background processes. The remaining SM backgrounds from diboson processes are determined using MC simulated samples, while the multijet background contribution is extracted from data. The con-tributions from non-collision backgrounds are estimated in data using the beam-induced background identification techniques described in ref. [82].
In the following subsections, details of the definition of the W/Z+jets and top control regions, and of the data-driven determination of the multijet and beam-induced back-grounds are given. This is followed by a description of the background fits.
6.1 Control samples
AW(→µν)+jets control sample is selected by requiring a muon consistent with originating from the primary vertex with pT >10 GeV, and transverse mass in the range 30 < mT < 100 GeV. The transverse mass mT =
q
2pℓ
TpνT[1−cos(φℓ−φν)] is defined by the lepton and neutrino transverse momenta, where the (x, y) components of the neutrino momentum are taken to be the same as the corresponding ~pmiss
T components. Events with identified electrons in the final state are vetoed. In addition, events with an identifiedb-jet in the final state are vetoed in order to reduce the contamination from top-quark-related processes. Similarly, a Z/γ∗(→ µ+µ−)+jets control sample is selected by requiring the presence of two muons withpT>10 GeV and invariant mass in the range 66< mµµ<116 GeV. In the
W(→µν)+jets and Z/γ∗(→µ+µ−)+jets control regions, the Emiss
T value is not corrected for the presence of the muons in the final state, motivated by the fact that these control regions are used to estimate the Z(→νν¯)+jets, W(→µν)+jets and Z/γ∗(→µ+µ−)+jets backgrounds in the signal regions with no identified muons. TheETmiss-based online trigger used in the analysis does not include muon information in the Emiss
T calculation. This allows the collection of W(→µν)+jets andZ/γ∗(→µ+µ−)+jets control samples with the same trigger as for the signal regions.
A W(→ eν)+jets-dominated control sample was collected using online triggers that select events with an electron in the final state. The control sample is defined with an isolated electron candidate with pT > 30 GeV, 30 < mT < 100 GeV, and no additional identified leptons in the final state. Electron candidates in the transition region between the barrel and endcaps of the electromagnetic calorimeter, 1.37<|η|<1.52, are excluded. The Emiss
T value is corrected by subtracting the contribution from the electron cluster in the calorimeter. In this way, the measuredETmiss in the event better reflects the magnitude of theW-bosonpT in the final state, which is necessary for a proper implementation of the
4The use of an additionalZ/γ∗(→e+e−)+jets control sample to help constrain theZ/γ∗(→e+e−)+jets
JHEP01(2018)126
W-bosonpTreweighting procedure, as explained in section3, that accounts for higher-order QCD and electroweak corrections. In order to suppress backgrounds from multijet processes with jets faking high-pTelectrons, the events are required to have ETmiss/
√
HT >5 GeV1/2, where in this case ETmiss still includes the contribution from the electron energy deposits in the calorimeter and HT denotes the scalar sum of the pT of the identified jets in the final state.
Finally, a control sample enriched in tt¯events is constructed using the same selection criteria as in the case of the W(→ µν)+jets but requiring that at least one of the jets is
b-tagged.
6.2 Multijet background
The multijet background with large Emiss
T mainly originates from the misreconstruction of the energy of a jet in the calorimeter and to a lesser extent is due to the presence of neutrinos in the final state from heavy-flavour hadron decays. In this analysis, the multijet background is determined from data, using the jet smearing method as described in ref. [83], which relies on the assumption that the ETmiss value of multijet events is dominated by fluctuations in the jet response in the detector, which can be measured in the data. For the IM1 and EM1 selections, the multijet background constitutes about 0.3% and 0.4% of the total background, respectively, and it is negligible for the other signal regions.
6.3 Non-collision background
Remaining non-collision background contributions in the signal regions, mostly from muons originating in the particle cascades due to beam-halo protons intercepting the LHC colli-mators, are estimated following closely the methods set out in ref. [82]. In particular, the jet timing, tj, calculated from the energy-weighted average of the time of the jet energy deposits, defined with respect to the event time in nominal collisions, is used. A dedicated region enhanced in beam-induced background, defined by inverting the tight jet-quality selection imposed on the leading jet, is used to estimate the amount of non-collision back-ground from the fraction of events with a leading-jet timing|tj|>5 ns. The results indicate an almost negligible contribution from non-collision backgrounds in the signal regions.
6.4 Background fit
The use of control regions to constrain the normalization of the dominant background contributions reduces the relatively large theoretical and experimental systematic uncer-tainties, of the order of 20%–40%, associated with purely simulation-based background predictions in the signal regions. A complete study of systematic uncertainties is carried out, as detailed in section 7. To determine the final uncertainty in the total background, all systematic uncertainties are treated as Gaussian-distributed nuisance parameters in a fit based on the profile likelihood method [84], which takes into account correlations among systematic variations. The likelihood also takes into account cross-contamination between different background sources in the control regions.
The ETmiss distribution is the observable used. A simultaneous background-only like-lihood fit to the Emiss
JHEP01(2018)126
µ+µ−)+jets, and top control regions is performed to normalize and constrain the back-ground estimates in the signal regions. In the analysis, two different fitting strategies are considered, potentially giving slightly different results. A binned likelihood fit is per-formed using simultaneously all the exclusive ETmiss regions EM1–EM10, as described in section 5. The fit includes a single floating normalization factor common to all W+jets andZ+jets processes, and a single floating normalization factor for top-quark-related pro-cesses. The nuisance parameters, implementing the impact of systematic uncertainties, are defined bin-by-bin and correlations across ETmiss bins are taken into account. As a result, the fit exploits the information of the shape of the Emiss
T distribution in constraining the normalization ofW/Z+jets and top-quark-related background. In addition, one-bin likeli-hood fits are performed separately for each of the inclusive regions IM1-IM10. In this case, the two normalization factors forW/Z+jets and top-quark-related processes, respectively, and the nuisance parameters related to systematic uncertainties refer to the given ETmiss inclusive region.
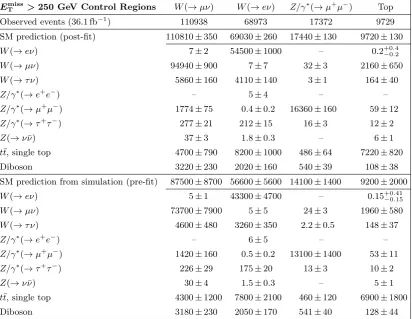
The results of the background-only fit in the control regions are presented in table 2
for theETmiss>250 GeV inclusive selection. TheW/Z+jets background predictions receive a multiplicative normalization factor of 1.27. Similarly, top-quark-related processes receive a normalization factor of 1.06. When the binned likelihood fit is performed simultaneously over the different exclusive ETmiss regions, thus including information from the shape of the measured Emiss
T distribution, the normalization factor of the W/Z+jets background predictions remains essentially unchanged, dominated by the low-ETmiss region, and that of the top-quark-related processes becomes 1.31, correlated with a less than 1σ pull of the top-quark-related uncertainties within the fit.
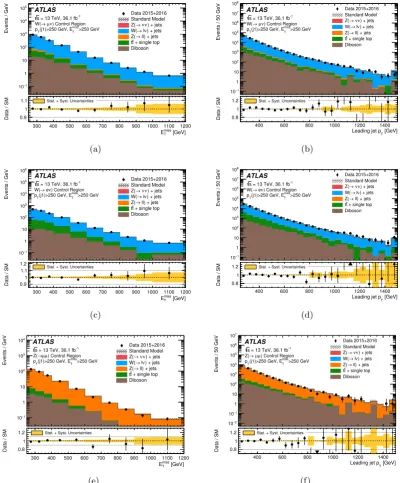
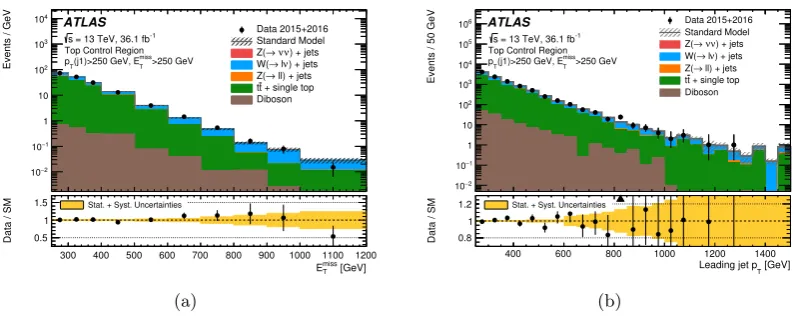
Figures2and 3show the distributions of theEmissT and the leading-jet pT in data and MC simulation in the different control regions. In this case, the MC predictions include the data-driven normalization factors as extracted from the binned likelihood fit to the different exclusive ETmiss bins. Altogether, the MC simulation provides a good description, within uncertainties, of the shape of the measured distributions in the different control regions.
7 Systematic uncertainties
In this section, the systematic uncertainties for both the background and signal models are presented. The impacts of the various sources of systematic uncertainty on the total background predictions are determined by the likelihood fits described in section 6.4. In-clusive and exIn-clusiveETmiss selections are considered separately. For the latter, correlations of systematic uncertainties across Emiss
T bins are taken into account. The impact of the different sources of uncertainty in representative inclusive ETmiss bins, as determined using one-bin likelihood fits, is presented below. Experimental and theoretical uncertainties in the signal model predictions are also presented.
7.1 Background systematic uncertainties
JHEP01(2018)126
Events / GeV
1 − 10 1 10 2 10 3 10 4 10 5 10 Data 2015+2016 Standard Model
) + jets ν ν → Z(
) + jets ν l → W(
ll) + jets → Z(
+ single top t t Diboson ATLAS
-1 = 13 TeV, 36.1 fb s
) Control Region
ν µ → W( >250 GeV miss T (j1)>250 GeV, E T p [GeV] miss T E 300 400 500 600 700 800 900 1000 1100 1200 Data / SM 0.9
1
1.1 Stat. + Syst. Uncertainties
(a)
Events / 50 GeV
1 − 10 1 10 2 10 3 10 4 10 5 10 6 10 7 10 8 10 ATLAS -1
= 13 TeV, 36.1 fb s
) Control Region
ν µ → W( >250 GeV miss T
(j1)>250 GeV, E
T
p
Data 2015+2016 Standard Model
) + jets
ν ν →
Z( ) + jets
ν
l
→
W( ll) + jets
→
Z( + single top t t Diboson
[GeV] T Leading jet p 400 600 800 1000 1200 1400 Data / SM 0.8
1
1.2 Stat. + Syst. Uncertainties
(b)
Events / GeV
1 − 10 1 10 2 10 3 10 4 10 5 10 6 10 Data 2015+2016 Standard Model
) + jets
ν ν →
Z( ) + jets
ν
l
→
W( ll) + jets
→
Z( + single top t t Diboson ATLAS
-1 = 13 TeV, 36.1 fb s
) Control Region
ν e → W( >250 GeV miss T (j1)>250 GeV, E T p [GeV] miss T E 300 400 500 600 700 800 900 1000 1100 1200 Data / SM 0.9
1 1.1 1.2
Stat. + Syst. Uncertainties
(c)
Events / 50 GeV
1 − 10 1 10 2 10 3 10 4 10 5 10 6 10 7 10 8 10 ATLAS -1
= 13 TeV, 36.1 fb s
) Control Region
ν e → W( >250 GeV miss T
(j1)>250 GeV, E
T
p
Data 2015+2016 Standard Model
) + jets
ν ν →
Z( ) + jets
ν
l
→
W( ll) + jets
→
Z( + single top t t Diboson
[GeV] T Leading jet p 400 600 800 1000 1200 1400 Data / SM 0.8
1
1.2 Stat. + Syst. Uncertainties
(d)
Events / GeV
1 − 10 1 10 2 10 3 10 4 10 Data 2015+2016 Standard Model
) + jets ν ν → Z(
) + jets ν l → W(
ll) + jets → Z(
+ single top t t Diboson ATLAS
-1 = 13 TeV, 36.1 fb s
) Control Region
µ µ → Z( >250 GeV miss T (j1)>250 GeV, E T p [GeV] miss T E 300 400 500 600 700 800 900 1000 1100 1200 Data / SM 0.8
1
1.2 Stat. + Syst. Uncertainties
(e)
Events / 50 GeV
2 − 10 1 − 10 1 10 2 10 3 10 4 10 5 10 6 10 7 10 ATLAS -1
= 13 TeV, 36.1 fb s
) Control Region
µ µ → Z( >250 GeV miss T
(j1)>250 GeV, E
T
p
Data 2015+2016 Standard Model
) + jets
ν ν →
Z( ) + jets
ν
l
→
W( ll) + jets
→
Z( + single top t t Diboson
[GeV] T Leading jet p 400 600 800 1000 1200 1400 Data / SM 0.8
1
1.2 Stat. + Syst. Uncertainties
[image:16.595.94.495.106.590.2](f)
Figure 2. The measured (a),(c),(e) Emiss
T and (b),(d),(f) leading-jet pT distributions in the W(→µν)+jets,W(→eν)+jets, andZ/γ∗(→µ+µ−)+jets control regions, for theEmiss
T >250 GeV
inclusive selection, compared to the background predictions. The latter include the global nor-malization factors extracted from the fit. The error bands in the ratios include the statistical and systematic uncertainties in the background predictions as determined by the binned-likelihood fit to the data in the control regions. The last bin of theEmiss
T and leading-jetpTdistributions contains
JHEP01(2018)126
EmissT >250 GeV Control Regions W(→µν) W(→eν) Z/γ∗(→µ+µ−) TopObserved events (36.1 fb−1) 110938 68973 17372 9729
SM prediction (post-fit) 110810±350 69030±260 17440±130 9720±130
W(→eν) 7±2 54500±1000 – 0.2+0.4
−0.2
W(→µν) 94940±900 7±7 32±3 2160±650
W(→τ ν) 5860±160 4110±140 3±1 164±40
Z/γ∗(→e+e−) – 5±4 – –
Z/γ∗(→µ+µ−) 1774±75 0.4±0.2 16360±160 59±12
Z/γ∗(→τ+τ−) 277±21 212±15 16±3 12±2
Z(→ν¯ν) 37±3 1.8±0.3 – 6±1
t¯t, single top 4700±790 8200±1000 486±64 7220±820
Diboson 3220±230 2020±160 540±39 108±38
SM prediction from simulation (pre-fit) 87500±8700 56600±5600 14100±1400 9200±2000
W(→eν) 5±1 43300±4700 – 0.15+0.41−0.15
W(→µν) 73700±7900 5±5 24±3 1960±580
W(→τ ν) 4600±480 3260±350 2.2±0.5 148±37
Z/γ∗(→e+e−) – 6±5 – –
Z/γ∗(→µ+µ−) 1420±160 0.5±0.2 13100±1400 53±11
Z/γ∗(→τ+τ−) 226±29 175±20 13±3 10±2
Z(→ν¯ν) 30±4 1.5±0.3 – 5±1
t¯t, single top 4300±1200 7800±2100 460±120 6900±1800
[image:17.595.92.505.85.404.2]Diboson 3180±230 2050±170 541±40 128±44
Table 2. Data and background predictions in the control regions before and after the fit is
per-formed for the Emiss
T >250 GeV inclusive selection. The background predictions include both the
statistical and systematic uncertainties. The individual uncertainties are correlated, and do not necessarily add in quadrature to the total background uncertainty. The dash “–” denotes negligible background contributions.
Uncertainties related to jet quality requirements, pile-up description and corrections to the jet pT and ETmiss introduce a 0.9% to 1.8% uncertainty in the background predictions. Uncertainties in the b-tagging efficiency, relevant for the definition of the W(→ µν)+jets and t¯t control regions, translate into an uncertainty in the total background that varies between 0.9% for IM1 and 0.5% for IM10. Uncertainties in soft contributions to Emiss
T translate into an uncertainty in the total background yields that varies between 0.4% for IM1 and 1.7% for IM10.
Uncertainties in the simulated lepton identification and reconstruction efficiencies, en-ergy/momentum scale and resolution [78,85,86] translate into an uncertainty in the total background which varies between 0.2% and 1.7% for IM1 and between 0.3% and 2.3% for IM10 selection.
Uncertainties inW/Z+jets predictions [65,87] related to the modelling of parton show-ers inSherpaand the choice of PDFs translate into an uncertainty in the total background
JHEP01(2018)126
Events / GeV
2 − 10 1 − 10 1 10 2 10 3 10 4 10 Data 2015+2016 Standard Model
) + jets
ν ν →
Z( ) + jets
ν
l
→
W( ll) + jets
→
Z( + single top t t Diboson ATLAS
-1 = 13 TeV, 36.1 fb s
Top Control Region >250 GeV miss T (j1)>250 GeV, E T p [GeV] miss T E 300 400 500 600 700 800 900 1000 1100 1200 Data / SM 0.5
1
1.5 Stat. + Syst. Uncertainties
(a)
Events / 50 GeV
2 − 10 1 − 10 1 10 2 10 3 10 4 10 5 10 6 10 ATLAS -1
= 13 TeV, 36.1 fb s
Top Control Region >250 GeV
miss T
(j1)>250 GeV, E
T
p
Data 2015+2016 Standard Model
) + jets
ν ν →
Z( ) + jets
ν
l
→
W( ll) + jets
→
Z( + single top t t Diboson
[GeV] T Leading jet p
400 600 800 1000 1200 1400
Data / SM 0.8 1
1.2 Stat. + Syst. Uncertainties
[image:18.595.95.493.89.247.2](b)
Figure 3. The measured (a)Emiss
T and(b)leading-jet pTdistributions in the top control region,
for the Emiss
T >250 GeV inclusive selection, compared to the background predictions. The latter
include the global normalization factors extracted from the fit. The error bands in the ratios include the statistical and systematic uncertainties in the background predictions as determined by the binned-likelihood fit to the data in the control regions. The last bin of theEmiss
T and leading-jet
pTdistributions contains overflows. The contributions from multijet and non-collision backgrounds
are negligible and are not shown in the figures.
as described in ref. [64], include: uncertainties in the QCD renomalization/factorization scales, affecting both the normalization and the shape of the predicted boson-pT distribu-tion; uncertainties associated with the non-universality of QCD corrections acrossW+jets and Z+jets processes; uncertainties in electroweak corrections beyond NNLO, unknown electroweak NLO correction terms at very high boson-pT, and limitations of the Sudakov approximation adopted in the calculation; uncertainties in the QCD and electroweak inter-ference terms; and uncertainties on the implementation of the higher-order QCD corrections in Sherpa, affected by a limited MC statistics at large boson-pT. Altogether, this
trans-lates into an uncertainty in the total background that varies between 0.4% for IM1 and 2% for IM10.
Theoretical uncertainties in the predicted background yields for top-quark-related pro-cesses include variations in parton-shower parameters and the amount of initial- and final-state soft gluon radiation, and the difference between predictions from different MC event generators [88]. This introduces an uncertainty in the total background of about 0.3% for IM1, becoming negligible at very highETmiss.
Uncertainties in the diboson contribution are estimated as the difference between the yields of the Sherpa and Powheg event generators [89], after taking into account the
difference between the cross sections, which is then summed in quadrature with a 6% theory uncertainty in the NLO cross section. This translates into an uncertainty on the total background of about 0.2% for IM1 and about 0.8% for IM10.
JHEP01(2018)126
of the SM background and translates into an uncertainty in the total background yield of about 0.1% for IM1.
7.2 Signal systematic uncertainties
Sources of systematic uncertainty in the predicted signal yields are considered separately for each model of new physics using a common set of procedures. The procedures are described here, while the numerical uncertainties are given with the associated results for each model in section 8. Experimental uncertainties include those related to the jet and
ETmiss reconstruction, energy scales and resolutions, and the integrated luminosity. Other uncertainties related to the jet quality requirements are negligible.
Uncertainties affecting the signal acceptance in the generation of signal samples in-clude: uncertainties in the modelling of the initial- and final-state gluon radiation, de-termined using simulated samples with modified parton-shower parameters (by factors of two or one half); uncertainties due to PDFs and variations of the αs(mZ) value employed, as computed from the envelope of CT10, MMHT2014 [90] and NNPDF30 error sets; and uncertainties due to the choice of renormalization and factorization scales. In addition, the-oretical uncertainties in the predicted cross sections, including PDF and renormalization-and factorization-scale uncertainties, are assessed separately for the different models.
8 Results and interpretation
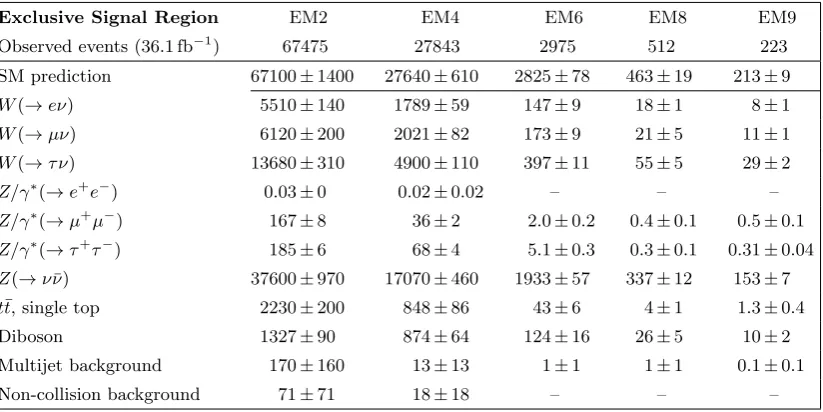
The number of events in the data and the individual background predictions in several inclusive and exclusive signal regions, as determined using the background estimation pro-cedure discussed in section6.4, are presented in tables3and4. The results for all the signal regions are summarized in table5. Good agreement is observed between the data and the SM predictions in each case. The SM predictions for the inclusive selections are determined with a total uncertainty of 2.4%, 2.7%, and 9.7% for the IM1, IM5, and IM10 signal regions, respectively, which include correlations between uncertainties in the individual background contributions.
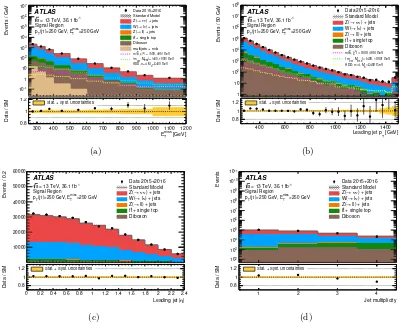
Figure 4 shows several measured distributions compared to the SM predictions in the regionETmiss>250 GeV, for which the normalization factors applied to the MC predictions, and the related uncertainties, are determined from the global fit carried out in exclusive
ETmissbins. For illustration purposes, the distributions include the impact of example ADD, SUSY, and WIMP scenarios. In general, the SM predictions provide a good description of the measured distributions. The differences observed in the jet multiplicity distribution do not have an impact in the results. Statistical tests using the binned profile likelihood fit described above, and considering different scenarios for new physics, give p-values for a background-only hypothesis in the range 0.01–0.04, corresponding to agreement with the SM predictions within approximately 2.1σ to 1.7σ.
JHEP01(2018)126
Inclusive Signal Region IM1 IM3 IM5 IM7 IM10
Observed events (36.1 fb−1) 255486 76808 13680 2122 245
SM prediction 245900±5800 73000±1900 12720±340 2017±90 238±23
W(→eν) 20600±620 4930±220 682±33 63±8 7±2
W(→µν) 20860±840 5380±280 750±44 115±13 17±2
W(→τ ν) 50300±1500 12280±520 1880±63 261±13 24±3
Z/γ∗(→e+e−) 0.11±0.03 0.03±0.01 – – –
Z/γ∗(→µ+µ−) 564±32 107±9 10±1 1.8±0.5 0.2±0.2
Z/γ∗(→τ+τ−) 812±32 178±8 24±1 3.5±0.5 0.4±0.1
Z(→ν¯ν) 137800±3900 45700±1300 8580±260 1458±76 176±18
t¯t, single top 8600±1100 2110±280 269±42 26±10 0±1
Diboson 5230±400 2220±170 507±64 88±19 13±4
Multijet background 700±700 51±50 8±8 1±1 0.1±0.1
[image:20.595.91.508.95.302.2]Non-collision background 360±360 51±51 4±4 – –
Table 3. Data and SM background predictions in the signal region for several inclusive Emiss
T
selections, as determined using separate one-bin likelihood fits in the control regions. For the SM prediction, both the statistical and systematic uncertainties are included. In each signal region, the individual uncertainties for the different background processes can be correlated, and do not necessarily add in quadrature to the total background uncertainty. The dash “–” denotes negligible background contributions.
Exclusive Signal Region EM2 EM4 EM6 EM8 EM9
Observed events (36.1 fb−1) 67475 27843 2975 512 223
SM prediction 67100±1400 27640±610 2825±78 463±19 213±9
W(→eν) 5510±140 1789±59 147±9 18±1 8±1
W(→µν) 6120±200 2021±82 173±9 21±5 11±1
W(→τ ν) 13680±310 4900±110 397±11 55±5 29±2
Z/γ∗(→e+e−) 0.03±0 0.02±0.02 – – –
Z/γ∗(→µ+µ−) 167±8 36±2 2.0±0.2 0.4±0.1 0.5±0.1
Z/γ∗(→τ+τ−) 185±6 68±4 5.1±0.3 0.3±0.1 0.31±0.04
Z(→ν¯ν) 37600±970 17070±460 1933±57 337±12 153±7
t¯t, single top 2230±200 848±86 43±6 4±1 1.3±0.4
Diboson 1327±90 874±64 124±16 26±5 10±2
Multijet background 170±160 13±13 1±1 1±1 0.1±0.1
Non-collision background 71±71 18±18 – – –
Table 4. Data and SM background predictions in the signal region for several exclusive Emiss
T
[image:20.595.93.505.419.625.2]JHEP01(2018)126
Events / GeV
1 − 10 1 10 2 10 3 10 4 10 5 10 6 10 7 10 Data 2015+2016 Standard Model ) + jets ν ν → Z(
) + jets ν l → W(
ll) + jets → Z(
+ single top t t Diboson multijets + ncb
) = (500, 495) GeV
0 ) χ ∼ , b ~ m(
)= (400, 1000) GeV
med , M DM (m =6400 GeV D
ADD, n=4, M
ATLAS
-1
= 13 TeV, 36.1 fb s
Signal Region
>250 GeV
miss T
(j1)>250 GeV, E
T p [GeV] miss T E
300 400 500 600 700 800 900 1000 1100 1200
Data / SM
0.8 1 1.2
Stat. + Syst. Uncertainties
(a)
Events / 50 GeV
1 10 2 10 3 10 4 10 5 10 6 10 7 10 8 10 ATLAS -1
= 13 TeV, 36.1 fb s
Signal Region
>250 GeV miss T (j1)>250 GeV, E T p
Data 2015+2016 Standard Model
) + jets
ν ν →
Z( ) + jets
ν
l
→
W( ll) + jets
→
Z( + single top t t Diboson
) = (500, 495) GeV
0 χ ∼ , b ~ m(
)= (400, 1000) GeV
med , M DM (m =6400 GeV D
ADD, n=4, M
[GeV]
T
Leading jet p
400 600 800 1000 1200 1400
Data / SM 0.8
1
1.2 Stat. + Syst. Uncertainties
(b)
Events / 0.2
10000 20000 30000 40000 50000 60000 ATLAS -1 = 13 TeV, 36.1 fb s
Signal Region
>250 GeV
miss T
(j1)>250 GeV, E
T
p
Data 2015+2016 Standard Model
) + jets
ν ν →
Z( ) + jets
ν
l
→
W( ll) + jets
→
Z( + single top t t Diboson
|
η
Leading jet | 0 0.2 0.4 0.6 0.8 1 1.2 1.4 1.6 1.8 2 2.2 2.4 Data / SM 0.8
1
1.2 Stat. + Syst. Uncertainties
(c) Events 2 10 3 10 4 10 5 10 6 10 7 10 8 10 9 10 10 10 11 10 ATLAS -1
= 13 TeV, 36.1 fb s
Signal Region
>250 GeV miss T (j1)>250 GeV, E T p
Data 2015+2016 Standard Model
) + jets ν ν → Z(
) + jets ν l → W(
ll) + jets → Z(
+ single top t t Diboson
Jet multiplicity
1 2 3 4
Data / SM 0.8
1
1.2 Stat. + Syst. Uncertainties
[image:21.595.94.495.91.414.2](d)
Figure 4. Measured distributions of the (a) Emiss
T ,(b) leading-jet pT, (c) leading-jet |η|, and(d)
jet multiplicity for the Emiss
T > 250 GeV selection compared to the SM predictions. The latter
are normalized with normalization factors as determined by the global fit that considers exclusive
Emiss
T regions. For illustration purposes, the distributions of example ADD, SUSY, and WIMP
scenarios are included. The error bands in the ratios shown in the lower panels include both the statistical and systematic uncertainties in the background predictions. The last bin of theEmiss
T and
leading-jet pT distributions contains overflows. The contributions from multijet and non-collision
backgrounds are negligible and are only shown in the case of the Emiss
T distribution.
Inclusive Signal Region Exclusive Signal Region
Region Predicted Observed Region Predicted Observed
IM1 245900±5800 255486 EM1 111100±2300 111203
IM2 138000±3400 144283 EM2 67100±1400 67475
IM3 73000±1900 76808 EM3 33820±940 35285
IM4 39900±1000 41523 EM4 27640±610 27843
IM5 12720±340 13680 EM5 8360±190 8583
IM6 4680±160 5097 EM6 2825±78 2975
IM7 2017±90 2122 EM7 1094±33 1142
IM8 908±55 980 EM8 463±19 512
IM9 464±34 468 EM9 213±9 223
IM10 238±23 245 EM10 226±16 245
Table 5. Data and SM background predictions in the signal region for the different selections. For
[image:21.595.88.505.539.686.2]JHEP01(2018)126
Selection hσi95
obs[fb] Sobs95 S95exp
IM1 531 19135 11700+4400
−3300
IM2 330 11903 7000+2600−2600
IM3 188 6771 4000+1400−1100
IM4 93 3344 2100+770
−590
IM5 43 1546 770+280
−220
IM6 19 696 360+130−100
IM7 7.7 276 204+74
−57
IM8 4.9 178 126+47
−35
IM9 2.2 79 76+29−21
[image:22.595.87.505.84.246.2]IM10 1.6 59 56+21−16
Table 6. Observed and expected 95% CL upper limits on the number of signal events, S95
obs and
S95
exp, and on the visible cross section, defined as the product of cross section, acceptance and
efficiency,hσi95
obs, for the IM1–IM10 selections.
used to set model-independent exclusion limits, and the exclusive regions are used for the interpretation of the results within different models of new physics. In general, the observed exclusion limits are worse than the expected sensitivity due to the slight excess of events in the data compared to the SM predictions, as shown in table 5.
8.1 Model-independent exclusion limits
A likelihood fit is performed separately for each of the inclusive regions IM1–IM10. As a result, model-independent observed and expected 95% confidence level (CL) upper limits on the visible cross section, defined as the product of production cross section, acceptance and efficiency σ×A×ǫ, are extracted from the ratio between the 95% CL upper limit on the number of signal events and the integrated luminosity, taking into consideration the systematic uncertainties in the SM backgrounds and the uncertainty in the integrated luminosity. The results are presented in table6. Values ofσ×A×ǫabove 531 fb (for IM1) and above 1.6 fb (for IM10) are excluded at 95% CL.
8.2 Weakly interacting massive particles
The results are translated into exclusion limits on WIMP-pair production. Different sim-plified models are considered with the exchange of an axial-vector, vector or a pseudoscalar mediator in the s-channel. In addition, a model with the exchange of a coloured scalar mediator is considered, as described in section 1.
In the case of the exchange of an axial-vector mediator, and for WIMP-pair production withmZA >2mχ, typical A×ǫvalues for the signal models with a 1 TeV mediator range
JHEP01(2018)126
from 35% to 0.7% are obtained for IM1 and IM10 selections, respectively, for a mediator mass of 1 TeV andmη ≫mχ.
The experimental uncertainties related to the jet and Emiss
T scales and resolutions introduce similar uncertainties in the signal yields for axial-vector, vector and pseudoscalar models. They vary between 2% and 7% for the IM1 selection and between 3% and 9% for the IM10 selection, depending on the parameters of the model. In the case of the coloured scalar mediator model, these uncertainties vary between 2% and 6% for IM1 and between 4% and about 10% for IM10. The uncertainty related to the modelling of the initial- and final-state radiation translates into a 20% uncertainty in the signal acceptance, common to all the s-channel models. In the case of the coloured scalar mediator model, this uncertainty varies between 10% and 30%, depending on the kinematic selection. The choice of different PDF sets results in up to a 20% uncertainty in the acceptance and up to a 10% uncertainty in the cross section, depending on the model considered. Varying the renormalization and factorization scales introduces up to 25% variations of the cross section and up to 10% change in the acceptance, depending on the model considered. In addition, the uncertainty in the integrated luminosity is included.
A simultaneous fit to the signal and control regions in the exclusive Emiss
T bins is performed, and used to set observed and expected 95% CL exclusion limits on the param-eters of the model. Uncertainties in the signal acceptance times efficiency, the background predictions, and the luminosity are considered, and correlations between systematic uncer-tainties in signal and background predictions are taken into account. The fit accounts for the contamination of the control regions by signal events which a priori is estimated to be very small.
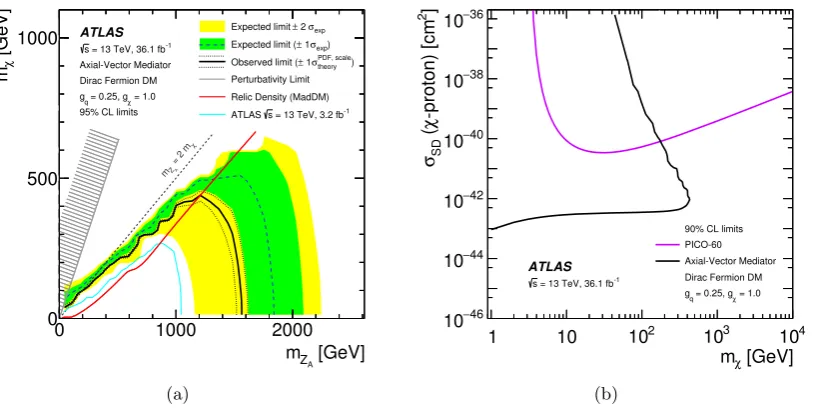
Figure 5(a)shows the observed and expected 95% CL exclusion contours in the mZA– mχ parameter plane for a simplified model with an axial-vector mediator, Dirac WIMPs, and couplings gq = 1/4 and gχ = 1. In addition, observed limits are shown using ±1σ theoretical uncertainties in the signal cross sections. In the on-shell regime, the models with mediator masses up to 1.55 TeV are excluded for mχ = 1 GeV. For mχ < 1 GeV, the monojet analysis maintains its sensitivity for excluding DM models. This analysis loses sensitivity to the models in the off-shell regime, where cross sections are suppressed due to the virtual production of the mediator. Perturbative unitarity is violated in the parameter region defined bymχ>
p
π/2mZA [92]. The masses corresponding to the relic
density [93] as determined by the Planck and WMAP satellites [9,10], within the WIMP dark-matter model and in the absence of any interaction other than the one considered, are indicated in the figure as a line that crosses the excluded region at mZA ∼1200 GeV
and mχ ∼440 GeV. The region towards lower WIMP masses or higher mediator masses corresponds to dark-matter overproduction.
JHEP01(2018)126
[GeV]
A
Z
m
0 1000 2000
[GeV]χ
m
0 500
1000 Expected limit ± 2 σexp ) exp σ 1 ± Expected limit (
) PDF, scale theory σ 1 ± Observed limit (
Perturbativity Limit
Relic Density (MadDM) -1 = 13 TeV, 3.2 fb s
ATLAS ATLAS
-1 = 13 TeV, 36.1 fb s
Axial-Vector Mediator Dirac Fermion DM
= 1.0
χ
= 0.25, g q g 95% CL limits
χ
= 2 m
A Z m (a) [GeV] χ m
1 10 102 103 104
] 2 -proton) [cm χ ( SD σ 46 − 10 44 − 10 42 − 10 40 − 10 38 − 10 36 − 10 PICO-60 Axial-Vector Mediator 90% CL limits
Dirac Fermion DM = 1.0
χ
= 0.25, g q g
ATLAS
-1 = 13 TeV, 36.1 fb s
[image:24.595.96.503.94.300.2](b)
Figure 5. (a) Axial-vector 95% CL exclusion contours in the mZA–mχ parameter plane. The
solid (dashed) curve shows the observed (expected) limit, while the bands indicate the±1σtheory uncertainties in the observed limit and±1σand ±2σ ranges of the expected limit in the absence of a signal. The red curve corresponds to the set of points for which the expected relic density
is consistent with the WMAP measurements (i.e. Ωh2 = 0.12), as computed with MadDM [94].
The region on the right of the curve corresponds to higher predicted relic abundance than these measurements. The region excluded due to perturbativity, defined bymχ >
p
π/2mZA, is indicated
by the hatched area. The dotted line indicates the kinematic limit for on-shell production mZA=
2×mχ. The cyan line indicates previous results at 13 TeV [1] using 3.2 fb−1. (b) A comparison
of the inferred limits (black line) to the constraints from direct detection experiments (purple line) on the spin-dependent WIMP-proton scattering cross section in the context of the simplified model with axial-vector couplings. Unlike in themZA–mχ parameter plane, the limits are shown at 90%
CL. The results from this analysis, excluding the region to the left of the contour, are compared
with limits from the PICO [95] experiment. The comparison is model-dependent and solely valid
in the context of this model, assuming minimal mediator width and the coupling values gq = 1/4
andgχ = 1.
values mZA = 45 GeV and mχ = 45 GeV of the mediator and dark matter masses
dis-played in figure5(a). This comparison is model-dependent and solely valid in the context of this particular model. In this case, stringent limits on the scattering cross section of the order of 2.9×10−43 cm2 (3.5×10−43cm2) for WIMP masses below 10 GeV (100 GeV) are inferred from this analysis, and complement the results from direct-detection experiments formχ<10 GeV. The kinematic loss of model sensitivity is expressed by the turn of the WIMP exclusion line, reaching back to low WIMP masses and intercepting the exclusion lines from the direct-detection experiments at around mχ= 200 GeV.