Int. J. Electrochem. Sci., 8 (2013) 2656 - 2669
International Journal of
ELECTROCHEMICAL
SCIENCE
www.electrochemsci.orgAFM Analysis of Polypyrrole Films Synthesized in the Presence
of Selected Doping Agents
U. Paramo-García1,2, J. G. Ibanez3
, N. Batina.,
1,*1 Lab. de Nanotecnología e Ing. Molecular, Área de Electroquímica, Depto. de Química, CBI,
Universidad Autónoma Metropolitana-Iztapalapa, Av. San Rafael Atlixco 186, Col. Vicentina, 09340 México D.F. MEXICO
2 División de Estudios de Posgrado e Investigación, Instituto Tecnológico de Cd. Madero, Juventino
Rosas y Jesús Ureta S/N, Col. Los Mangos, 89440 Cd. Madero, Tamps., MEXICO
3
Centro Mexicano de Química Verde y Microescala. Departamento de Ingeniería y Ciencias Químicas, Universidad Iberoamericana, Prol. Paseo de la Reforma 880, Lomas de Santa Fe, 01219 México, D.F. MEXICO
*E-mail: [email protected]
Received: 21 November 2012 / Accepted: 18 December 2012 / Published: 1 February 2013
This paper analyzes surface changes of polypyrrole films deposited on vitreous carbon substrates by electrochemical methods in the presence of different doping anions: I-, Br-, Cl-, F-, NO3-, ClO4- and
SO42-. Surface characterization of each electrode modified by electrodeposition at constant potential is
performed by atomic force microscopy, AFM. The thickness of PPy films is observed to increase with anion size in halide electrolytes. AFM analysis confirms that the dopant involved in the electrosynthesis of PPy determines the topographic characteristics of the film deposited on a vitreous carbon electrode. The quantitative analysis of the surface roughness of different PPy films, [RMS]Rq establishes definite differences among the various synthesis conditions. Larger anions result in more uniform structures, as the associated nodular sizes are found to be more homogenous. Thick films and large nodule areas result in high film roughness.
Keywords: polypyrrole, AFM, conducting polymer, electrodeposition, anion dopants.
1. INTRODUCTION
Int. J. Electrochem. Sci., Vol. 8, 2013
2657 polymerization. The latter is generally preferred because cleaner polymers are produced and it provides a better film thickness and morphology control when compared to chemical oxidation [1]. Many physical and (electro)-chemical properties of synthesized PPy films depend on the dopant ion and solvent used. The nature and size of the dopant ion influence PPy´s mechanical properties (e.g., tensile strength, Young´s modulus, and viscoelasticity), electrical properties (e.g., conductivity), hydrophobicity/hydrophilicity and other properties mainly related to film porosity (e.g., pore size, film density, distance between PPy chains, degree of structural order, degree of electrostatic cross-linking, isotropy/anisotropy, and permeability to gases/ions) [6-11].
Surface properties and morphologic characteristics of polymers are related -among other factors- to the type of dopant used during electropolymerization [12,13]. Li and Wang [14] used AFM and STM to understand the relationship between the surface morphology of the polypyrrole film and its thermal stability and ionic conductivity. The polypyrrole film used in these studies was prepared with p-toluensulfonate as the dopant and using different substrates (i.e., highly-oriented pyrolytic graphite, HOPG vitreous or glassy carbon, VC and Pt). The topography relative to the thickness of the films was similar in the different substrates used. However, the microstructure of the PPy film changed significantly when p-toluensulfonate was replaced by another dopant (chlorate or perchlorate ions) [14]. The disorder in the topography of the film varied from granular characteristics (when using p-toluensulfonate) to the presence of regularly ordered microparticles with voids (wells, with chlorate species). For the perchlorate anion the surface presented features corresponding to large clusters, but the films had many fractures along the surface [14].
Stankovic [15] used SEM to show the morphological differences among PPy films associated to the nature of the counterion (perchlorate, nitrate and p-toluensulfonate ions). Differences in nodule size, packing order, and shape were observed.
Silk [16] studied the influence of film thickness and nature of the dopant ion on the morphology of the polymer. By using atomic force microscopy (AFM), they studied thicknesses in the range of 100 to 4000 nm. The films were prepared potentiostatically using different electrolytes (Cl-, ClO4-, SO42- and dodecylsulfate anion, DDS-). Diameters, heights, globular-shapes, and cauliflower
structures formed onto the polymer surface were observed to depend on the nature of the anion [16]. Images obtained by AFM and scanning tunneling microscopy, STM have been used to evaluate quantitatively the surface morphology of polypyrrole films via determination of roughness and fractal dimension [16-20]. Surface roughness of the polymer is expressed by the root-mean square factor, RMS [Rq].
The meaning and extent of the dopant-morphology relationship is not clear yet and remains under investigation. Therefore, the aim of this study is to use AFM for surface characterization of polypyrrole films synthesized electrochemically with the constant potential technique, using different dopant anions.
2. EXPERIMENTAL
temperature. A vitreous carbon minidisk (Bioanalytical Systems, MF-2012, The Electrosynthesis, Co., GICR-10 rod, 0.07 cm2) was used as the working electrode (WE). It was previously polished with 0.10 and 0.05 m alumina suspensions and sonicated in distilled water for 10 to 15 min (Branson, 2510R-MT). A Pt wire was used as the auxiliary (counter) electrode (99.99 %). All potentials refer to an Ag/AgCl(sat) reference electrode (BAS, MF-2052) separated from the medium by a Vycor frit. All the
experiments were performed with a BAS potentiostat (Bioanalytical Systems, Model CW50W) at room temperature.
The electrolytes used were 0.10 M solutions of KF, KCl, KBr, KI, KNO3, KClO4 and K2SO4 (J.
T. Baker, reagent grade). The pyrrole monomer (Py, Aldrich, 98% reagent grade) was used after distillation in nitrogen atmosphere. In all cases the solutions were prepared with Millipore water (18.2 M at 22.7 oC) and deareated during 10-15 min with N2 (Praxair, 99.99%) before experimentation.
3. RESULTS AND DISCUSSION
The electrodeposits of PPy films on glassy carbon electrodes were completed using a constant potential technique, varying the applied potential from 0.6 to 1.0 V vs. Ag/AgCl. The PPy films synthesized at 0.90 V vs. Ag/AgCl consumed the highest charge for most electrolytes, which translates into thicker films. In addition, at this potential the overoxidation effects were essentially insignificant. This is convenient since overoxidation breaks electronic conjugation, disturbs the conduction of charge carriers, and under extreme conditions, it completely cancels the electroactive capacity of the material [21, 22].
Int. J. Electrochem. Sci., Vol. 8, 2013
2659
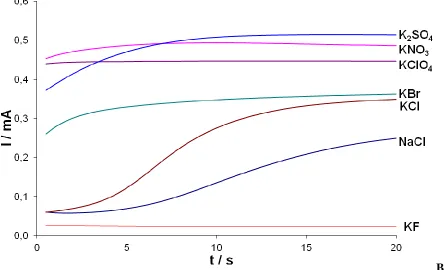
B Figure 1. a) I vs. t curves obtained during the electrosynthesis of PPy films with different dopant
anions, and b) inset of Figure 1a.
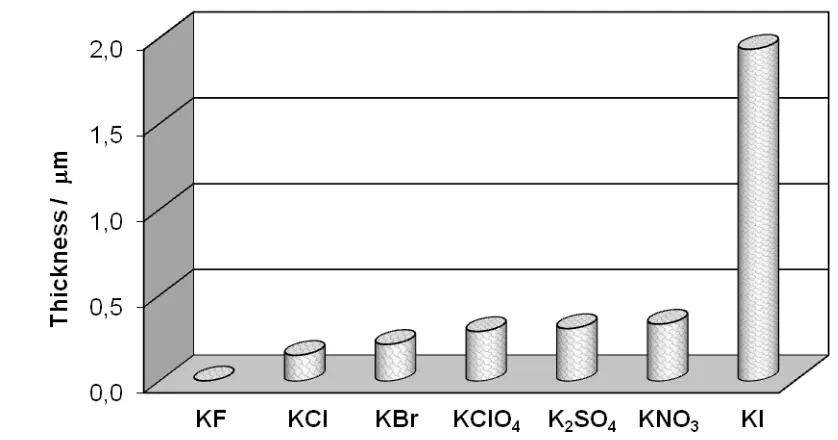
Figures 1a and 1b show I vs. t curves for the synthesized films using different dopant anions at 0.90 V vs. Ag/AgCl for 20 s. Compared to the rest of the electrolytes, the films synthesized in KI and KF solutions showed the highest and the lowest charge requirement, respectively, which suggests that thick or thin films can be obtained when using I- or F- as the doping anions. PPy film thickness varies linearly with charge [23].
Curtin used Auger spectroscopy to study the controlled diffusion of dopant ions during the exchange process in thin PPy films, synthesized electrochemically in a ClO4- solution [24]. A
spontaneous exchange of the original dopant with other anions was observed during immersion of the film in other solutions, although no evidence was rendered of F- exchange, even after long immersion periods in a KF solution. This fact could be related to not obtaining an acceptable polypyrrole film in this electrolyte and confirms that the anion present in the synthesis is determinant in the film properties.
The area under I vs. t curves for the synthesis of polypyrrole films represents the required charge by using the accepted estimates that a charge of 1.00 C/cm2 results in a PPy film 2.50 m thick [6, 25] or that a 410 mC/cm2 charge causes a thickness of 1 m [26].
[image:4.596.79.524.96.366.2]
Figure 2. Polypyrrole film thickness prepared in different electrolytes at constant potential (0.90 V vs. Ag / AgCl for 20 s).
Int. J. Electrochem. Sci., Vol. 8, 2013
2661
[image:6.596.63.531.76.303.2]Figure 3. a) Top view image of a clean vitreous carbon substrate; area = 2.60 x 2.60 m, and b) cross section analysis.
Figure 3-a shows a top view of a 2.60 m x 2.60 m area of clean vitreous carbon substrate. It was obtained in a z-axis range of 20 nm. A completely amorphous surface is noted, in agreement with the typical morphology of this material. Deformations or nodules with a tendency to rectangular and/or ellipsoidal shape are observed. Figure 3-b shows the corresponding cross sectional analysis, providing the height dimensions of these nodules (ca. 11,931 nm). In this analysis the measurements of other surface sections are observed. Relating such analysis to the identified geometries, nodules’ dimensions are between 840 nm2 and 12,994 nm2.
[image:6.596.191.400.512.720.2]
B
C
Int. J. Electrochem. Sci., Vol. 8, 2013
2663
E
F
H
I
Int. J. Electrochem. Sci., Vol. 8, 2013
2665
K
L
N
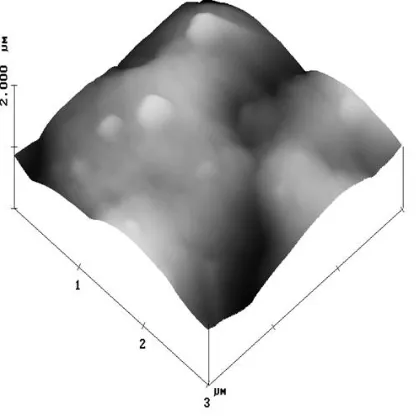
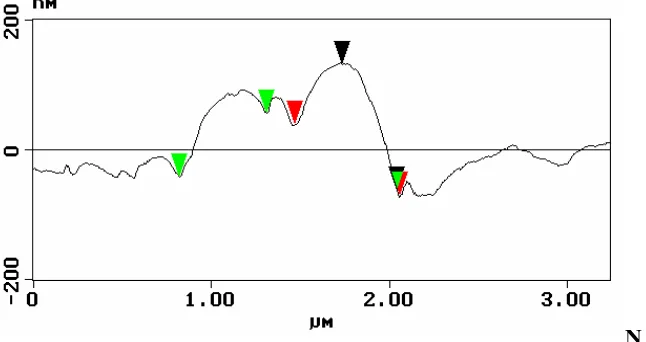
Figure 4. AFM images obtained of PPy films synthesized at a constant potential of 0.90 V vs. Ag /AgCl for 20 s, in a 0.10 M pyrrole solution with different electrolytes (0.10 M): a) KI, c) KBr, e) KCl, g) KF, i) KClO4, k) KNO3, m) K2SO4, and their corresponding cross section analyses
(Figures 4b, d, f, h, j, l and n).
The following figures show the AFM micrographs of a substrate modified by electrodeposition of a PPy film.
Figure 4 shows 3D images (4-a, 4-c, 4-e, 4-g, 4-i, 4-k and 4-m) and their corresponding cross-sectional analyses (4-b, 4-d, 4-f, 4-h, 4-j, 4-l and 4-n) obtained by AFM of the PPy films formed on vitreous carbon substrates by the constant potential technique (0.90 V vs. Ag/AgCl for 20 s). It is confirmed that surface characteristics (i.e., nodular size and shape) of the deposits depend on the electrolyte used [12-16].
Figure 4-a corresponds to the PPy film deposited in a KI solution. The deposit is irregular with a completely amorphous structure. There is a large deposit which covers completely the electrode surface visualized here. The cross-section analysis shows the existence of peaks having areas between 0.70 – 2.08 m2, as well as rectangular and elliptical formations between 75,504 – 122,640 nm2. These data corroborate a large area deposition, corresponding to a nodular area 10 to 100 times larger than the area of the substrate.
Figures 4-c and 4-d correspond to the PPy film prepared in a KBr solution. The film shows shapes in a rectangular and elliptical fashion with aggregate´s areas varying from 31,886 and up to 124,100 nm2. The topography is different from that of the film formed in a KI solution: it has smaller sizes and completely different shapes and design.
Figure 4-e shows the image of a PPy film formed in KCl solution. The areas identified on this surface are between 5,005 – 134,408 nm2. The largest particles show irregular shapes without consistency; that is, such agglomerations or mountains have neither a regular size nor order and spread unevenly over the surface.
[image:11.596.137.460.74.245.2]Int. J. Electrochem. Sci., Vol. 8, 2013
2667 Figure 4-i shows images of the film containing KClO4 in the electrolyte solution. The areas of
the agglomerations range from 81,312 – 416,624 nm2. Very large particle sizes are observed, together with well-ordered aggregates and nodules with circular and ellipsoidal geometries.
Figure 4-k displays the AFM image of a film obtained in KNO3 solution. It shows a good
ordering of the particles, with semicircular shapes and surface area ranging from 2,463– 72,106 nm2. Figures 4-m and 4-n correspond to the PPy film formed in the K2SO4 solution. The AFM image
shows large shapeless aggregates. Among the predominant shapes within these aggregates are ellipses whose dimensions range from 41,860 – 140,130 nm2. Outside the aggregate´s area, elliptical and circular shapes can be identified, with areas between 11,750 – 25,254 nm2.
The results obtained herein are in agreement with the published literature [17] in that a larger anion provides a more uniform structure, as is the case of PPy films synthesized in perchlorates (Figure 4-i) and nitrates (Figure 4-k), in which associated nodular sizes are more homogenous. As for the films synthesized in chlorides and perchlorates, they have cauliflower-like structures. Even though other observations and results are also similar, it is difficult to draw an overall conclusion and identify general trends.
Kaynak [18] found that dopant concentration and reaction time change the roughness of synthesized PPy films in a stainless steel electrode. If dopant concentration changes from 0.025 to 0.300 M for a 30-min synthesis, the RMS increases from 70 to 350 nm. Besides, for larger synthesis times, roughness is also increased.
[image:12.596.186.411.418.720.2]
Silk [16] reported the roughness of polypyrrole films formed with different thicknesses and with different dopants (chloride, sulfate, perchlorate and dodecylsulfate). The research was performed by ex-situ AFM, using a Pt electrode as the substrate. The roughness was found to depend on the film thickness, and the evolution of the surface morphology (including changes in RMS [Rq]) was evidenced to be different for diverse types of dopants used. This is in agreement with the results of the present work using vitreous carbon substrates. The literature suggests that the roughness is directly proportional to the thickness of the PPy film formed or deposited on the substrate [24].
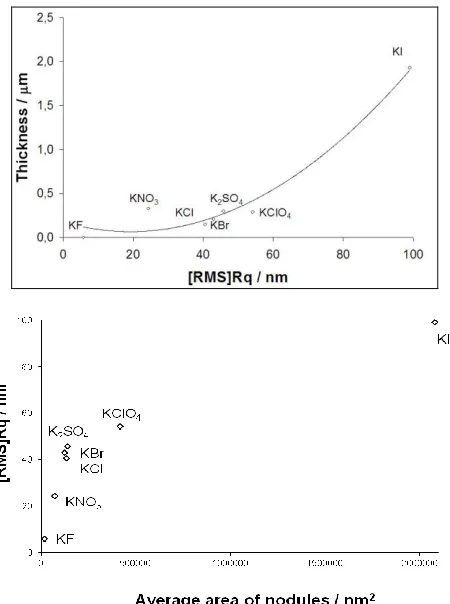
Figures 5a and 5b show roughness as a function of PPy film thickness and of the average nodule area, respectively. In the case of the clean substrate (vitreous carbon), roughness is given by [RMS] Rq = 3.62 nm. These graphs suggest that thick films and large nodule areas result in high roughness, in agreement with findings reported elsewhere [24]. Such results confirm that the final characteristics of PPy films depend on the method and conditions used for the formation of the conductive film deposition. Therefore, the electrosynthesis method has to be defined in terms of the final application of the polymer. For example, in order to get a thick film with a large area, the use of a KI electrolyte would be required. If a thin, low-conductive film is to be synthesized, it must be formed in a KF solution. The design will depend on the intended use for the PPy film.
4. CONCLUSIONS
In the case of halide electrolytes, the thickness of the electrosynthesized PPy film grows with anion size. Atomic force microscopy (AFM) was used to confirm that the dopant involved in the electrosynthesis of polypyrrole determines the topographic characteristics of the film deposited on a vitreous carbon electrode.
The quantitative analysis of the surface morphology, [RMS]Rq of different PPy films allowed establishing the differences among the various samples. Larger anions provide more uniform structures, as the associated nodular sizes are more homogenous. Thick films and large nodule areas result in high film roughness.
ACKNOWLEDGEMENTS
U. Páramo thanks Mexico for the Postdoctoral scholarship granted. Project CONACyT-Mexico No. CB-2006-1-61242. Helpful comments and suggestions by Claudia Camacho-Zuniga (U. Iberoamericana) are gratefully acknowledged.
References
Int. J. Electrochem. Sci., Vol. 8, 2013
2669 5. E. Bravo-Grimaldo, S. Hachey, C.G. Cameron and M.S. Freund, Macromolecules, 40 (2007)
7166.
6. A. Agostino, M. Caselli, M. DellaMonica and S. Laera, Electrochim. Acta, 38 (1993) 2581. 7. E. Beelen, J. Riga and J.J. Verbist, Synth. Met., 41 (1991) 449.
8. K. Imanishi, M. Satho, Y. Yasuda, R. Tsushima and S. Aoki, J. Electroanal. Chem., 242 (1988) 203.
9. J. Wang, Y. Xu, X. Chen, X. Du and X. Li, Acta Phys-Chim. Sin., 23 (2007) 299.
10. S.H. Song, D.S. Han, H.J. Lee, H.S. Cho, S.M. Chang, J.M. Kim and H. Muramatsu, Synth. Met., 117 (2001) 137.
11. A. Hallik, A. Alumaa, H. Kurig, A. Jänes, E. Lust and J. Tamm, Synth. Met., 157 (2007) 1085. 12. R. Bull, R. Fan and A. Bard, J. Electrochem. Soc., 129 (1982) 1009.
13. Z. Qi, N. Rees and P. Pickup, Chem. Mater., 8 (1996) 701. 14. J. Li, E. Wang, M. Green and P. West, Synth. Met., 74 (1995) 12.
15. R. Stankovic, O. Pavlovic, M. Vojnovic and S. Jovanovic, Eur. Polym. J., 30 (1994) 385. 16. T. Silk, Q. Hong, J. Tamm and R. Compton, Synth. Met., 93 (1998) 59.
17. E. Chainet and M. Billon, Synth. Met., 99 (1999) 21. 18. A. Kaynak, Mater. Res. Bull., 32 (1997) 271.
19. Ch. Froeck, A. Bartl and L. Dunsch, Electrochim. Acta, 40 (1995)1421.
20. G. Merle, A. Grillet, J. Allemand and D. Lesueur, Polym. Test., 18 (1999) 217. 21. C. Hsuch and A. Brajter-Toth, Anal. Chem., 66 (1994) 2458.
22. A. Alumaa, A. Hallik, V. Sammelselg and J. Tamm, Synth. Met., 157 (2007) 485. 23. J. Barisci, R. Stella, G. Spinks and G. Wallace, Electrochim. Acta, 46 (2000) 519. 24. L. Curtin, G. Komplin and W. Pietro, J. Phys. Chem., 92 (1988) 12.
25. Y. Wang and K. Rajeshwar, J. Electroanal. Chem., 425 (1997) 183.
26. B. Negler, N. Laxmeshwar and K. Santhanam, Ind. J. Chem., 33A (1994) 547.
27. U. Paramo-García, J. G. Ibanez and N. Batina, Int. J. Electrochem. Sci., 6 (2011) 5172. 28. Y. Li, J. Electroanal. Chem., 43 (1997) 181.