This is a repository copy of Increasing inequality in childhood obesity in primary schools in a northern English town.
White Rose Research Online URL for this paper: http://eprints.whiterose.ac.uk/128557/
Version: Accepted Version
Article:
Black, M. orcid.org/0000-0002-8358-9150, Joseph, V., Mott, L. et al. (1 more author) (2018) Increasing inequality in childhood obesity in primary schools in a northern English town. Public Health, 158. pp. 9-14. ISSN 0033-3506
https://doi.org/10.1016/j.puhe.2018.01.033
eprints@whiterose.ac.uk https://eprints.whiterose.ac.uk/ Reuse
This article is distributed under the terms of the Creative Commons Attribution-NonCommercial-NoDerivs (CC BY-NC-ND) licence. This licence only allows you to download this work and share it with others as long as you credit the authors, but you can’t change the article in any way or use it commercially. More
information and the full terms of the licence here: https://creativecommons.org/licenses/
Takedown
If you consider content in White Rose Research Online to be in breach of UK law, please notify us by
1
Increasing inequality in childhood obesity in primary schools
in a northern English town
M. Black a,*, V. Joseph b, L. Mott b, R. Maheswaran c
a School of Health and Related Research, The University of Sheffield, Regent Court, 30 Regent Street, Sheffield S1 4DA, UK
b Doncaster Metropolitan Borough Council, Civic Office, Waterdale, Doncaster DN1 3BU, UK
c Public Health GIS Unit, School of Health and Related Research, The
University of Sheffield, Regent Court, 30 Regent Street, Sheffield S1 4DA, UK
* Corresponding author: Michelle Black
Tel.: +44 (0) 114 222 0851; fax: +44 (0) 114 222 0749
E-mail addresses:
michelle.black1@nhs.net
2 Abstract
Objective
To undertake an analysis of National Child Measurement Programme (NCMP) data to quantify the obesity prevalence gap over time between children in primary schools in the most and least deprived areas of Doncaster.
Study Design
The research design for this study was retrospective quantitative analysis of secondary data.
Method
The study undertook secondary analysis of NCMP data on obesity prevalence in children in Reception Year and Year 6 in primary schools in Doncaster for the period 2006/7 to 2014/15. Data was combined into three three-year periods (2006/07 to 2008/09; 2009/10 to 2011/12; and 2012/13 to 2014/15) and schools grouped by deprivation based on the national Indices of Multiple Deprivation (IMD) 2015. Analysis was undertaken to assess whether there is a difference in obesity prevalence for Reception Year and Year 6 children in schools in the most deprived areas compared to the least deprived
(prevalence gap), over time.
Results
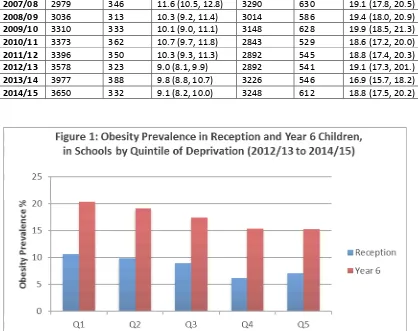
The difference in obesity prevalence between children attending schools in the most and least deprived areas has increased over time. For Reception Year children the prevalence gap has widened from a difference of 1.01 % higher in the most deprived schools in 2006/07 - 2008/09 to 3.64% higher in 2012/13 – 2014/15. In the same time periods, for Year 6 children, the obesity prevalence gap has also increased over time from 2.82% to 5.08%.
Conclusion
There is inequality in relation to obesity in primary school children in Doncaster with those in schools in the most deprived areas carrying the greatest burden. Research is needed to understand why the plateau seen nationally is not reaching the most deprived children.
Keywords
3 Introduction
Childhood obesity is a high priority public health area across the UK, with a quarter of 2 to 10 year olds and a third of 11-15 year olds overweight or obese.1 The adverse impact on health, social care and the economy are well documented; obesity increases the risk of type 2 diabetes, coronary heart disease, stroke, many cancers and reduces life expectancy.2.3 Adverse social consequences include social isolation and discrimination.4 The direct cost to the National Health Service (NHS) in 2006/07 was estimated to be £5.1 billion,5 which was 6% of the NHS budget that year. This is expected to double to £10 billion per year by 2050, with wider economic costs, such as loss of productivity, modeled at almost £50 billion per year by 2050.6
The prevalence of childhood obesity in England has trebled since the 1980s,7 reaching a peak of 19% in 2-15 year olds in 2005.8 Since then prevalence has plateaued. However this plateau is not uniform across society. National
reports in England, using data sourced from the National Child Measurement Programme (NCMP), highlight that the obesity burden is increasing for
children from the most deprived areas and this is increasing over time.9 This emerging and increasing obesity prevalence gap highlights the growing disparity between the most and least deprived children in society.10,11
NCMP is the national epidemiological tool for monitoring weight in children in England. The programme is not in place in the rest of the UK. It involves all primary school children being measured (weight and height) on starting school at age 4-5 years and leaving school at age 10-11 years in order to assess whether they are underweight, of normal weight, overweight or obese. NCMP started in 2006 and this research aimed to analyse 9 years of the data for Doncaster, a Northern English town, to assess whether there was a local obesity prevalence gap between the most and least deprived children and to determine what the gap was, using this to inform local policy and practice. This was done retrospectively undertaking quantitative analysis of Health and Social Care Information Centre (HSCIC) data. The HSCIC is the national information, data and IT system provider to the health and care system in England and is now known as NHS Digital.
Doncaster is a metropolitan borough council located in the North of England. It is coterminous with the area Clinical Commissioning Group (CCG), the body responsible for commissioning health services. The 2011 national census in the UK recorded the population of Doncaster at 302,400. Doncaster is
4 Method
The research design for this study was retrospective quantitative analysis of secondary data. At the time of the study there was nine years of NCMP data available for analysis, from the initial year of the NCMP programme in
2006/07 to 2014/15. Data was analysed for the two school years measured by NCMP, Reception Year (children aged 4-5 years) and Year 6 (children aged 10-11 years) for all primary schools in Doncaster over the 9-year period.
Body Mass Index (BMI) (weight(kg)/height(m)2) is the tool used, by NCMP, to assess whether a child is of healthy weight, overweight or obese. Fixed BMI thresholds such as those used for adults are not used for children because the relationship between a child’s BMI and fatness changes over time. Therefore, children’s BMI is categorised using variable thresholds that take into account the child’s age and sex. These thresholds are derived from a reference population and defined in terms of centile on a child growth
reference chart. An individual child’s BMI centile is compared to the reference chart to determine whether it is above or below the defined thresholds for healthy weight, overweight or obese. In England the NCMP use the British 1990 growth reference (UK90) chart to classify children’s weight status. For population monitoring purposes children are identified as overweight if their BMI is above the 85th centile and obese if it is above the 95th centile of the growth reference chart, according to their sex and age. Data for children classified as obese was analysed at primary school level to identify obesity prevalence by school on starting (Reception Year) and leaving (Year 6) primary school. Schools were organized into quintiles of deprivation, for analysis of obesity prevalence in relation to deprivation.
NCMP data was provided by HSCIC after permission was sought by
Doncaster Council. The data comprised 9 datasets pertaining to each of the years in the study. Continuous variables on obesity were computed in SPSS to generate prevalence data for each year group. These variables were then condensed into quintiles of deprivation to allow for comparison between the most and least deprived schools. In order to minimize the effect of small number variation, inherent in small area analysis, the 9-year study period was combined into three 3-yearly time periods; 2006/07 to 2008/09, 2009/10 to 2011/12 and 2012/13 to 2014/15, for analysis.
Obesity prevalence for each year group was analysed in relation to deprivation using the Index of Multiple Deprivation (IMD) 201512 score
5
All primary schools in Doncaster Metropolitan Borough were ranked into quintile of deprivation using the IMD 2015. This included all primary schools in operation during the period 2006/07 to 2014/15. To organise the schools into quintiles of deprivation national cut-offs were used. This was done by using the school’s postcode to identify in which LSOA it resided and the associated IMD score from the 2015 Indices of Deprivation was then assigned. The schools were organized into quintiles of deprivation with 1 being the most deprived 20% of LSOAs and 5 being the least deprived 20% of LSOAs
nationally. Obesity prevalence per quintile of schools over time was analysed to identify any prevalence gap between the schools in the most and least deprived areas, quintiles 1 and 5 respectively.
Quintiles 1 and 5 were compared over time and the difference in obesity prevalence (obesity prevalence gap) was quantified from the first 3-year period to the most recent one. Analytical statistics using SPSS was used to analyse the obesity prevalence gap between the most and least deprived quintiles using the chi2 test to determine any statistical significance to the difference, over each 3-year period.
Results
There were 104 primary schools in Doncaster in 2016. Data was analysed for 124 primary schools over the study period. This difference reflects changes to schools in term of closures, mergers and the evolution of academy schools over this time.
The total number of children measured over the time period was 57,510; 52% pertaining to Reception Year children and 48% pertaining to Year 6 children. Participation in the NCMP in the town is similar to the national participation rate and has gradually increased over time plateauing at approximately 94%.
6
Table 1: Prevalence of Obesity in Reception Year and Year 6 Children in Doncaster’s Primary Schools
Year
Reception Year Year 6
Number of Children Measured
Number Obese
Prevalence % (95% CI)
Number of Children Measured
Number Obese
Prevalence % (95% CI)
2006/07 2831 250 8.8 (7.8, 9.9) 2890 521 18.0 (16.6, 19.4)
2007/08 2979 346 11.6 (10.5, 12.8) 3290 630 19.1 (17.8, 20.5)
2008/09 3036 313 10.3 (9.2, 11.4) 3014 586 19.4 (18.0, 20.9)
2009/10 3310 333 10.1 (9.0, 11.1) 3148 628 19.9 (18.5, 21.3)
2010/11 3373 362 10.7 (9.7, 11.8) 2843 529 18.6 (17.2, 20.0)
2011/12 3396 350 10.3 (9.3, 11.3) 2892 545 18.8 (17.4, 20.3)
2012/13 3578 323 9.0 (8.1, 9.9) 2892 541 19.1 (17.3, 201.)
2013/14 3977 388 9.8 (8.8, 10.7) 3226 546 16.9 (15.7, 18.2)
2014/15 3650 332 9.1 (8.2, 10.0) 3248 612 18.8 (17.5, 20.2)
Obesity Prevalence Gap – Reception Children Aged 4-5 years
7
Table 2: Reception Children, Prevalence of Obesity in three yearly periods in
the most (Q1) and least (Q5) deprived quintiles
Obesity Prevalence Gap – Year 6 Children Aged 10-11 years
Table 3 highlights the prevalence of obesity in Year 6 Children for three yearly periods across the quintiles of deprivation and highlights decreasing
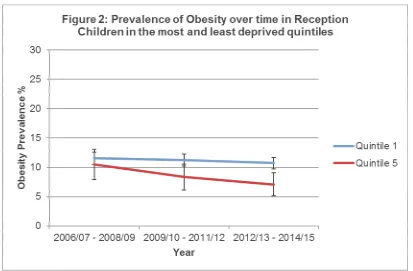
prevalence overall in both. Similar to starting school the burden is greater for children in the most deprived quintile with a prevalence of 20.36% in the latest time period compared to 15.28% in the least deprived quintile. This highlights that there are 32% more obese Year 6 children in the most deprived quintile compared to the least. The prevalence gap increases over time (as illustrated in Figure 2) from 2.82% (2006/07 to 2008/09) to 5.08% (2012/13 to 2014/15) which is statistically significant for the last two three year periods (p=0.002 and p=0.004).
Time Period Quintile 1 Quintile 5 Prev.
Diff
95% CI p-value
Prevalence 95% CI Prevalence 95% CI
2006/07 - 2008/09 11.52 (10.42, 12.62) 10.51 (7.90, 13.11) 1.01 (-1.82,3.84) 0.507
2009/10 - 2011/12 11.20 (10.17, 12.24) 8.35 (6.13, 10.56) 2.85 (0.41, 5.30) 0.037
8
Table 3: Year 6 Children, Prevalence of Obesity in three yearly periods in the
most (Q1) and least (Q5) deprived quintiles
Time period Quintile 1 Quintile 5 Prev.
diff
95% CI
p-value Prevalence 95% CI Prevalence 95% CI
2006/07 - 2008/09 20.80 (19.46, 22.13) 17.98 (14.72, 21.23) 2.82 (-0.70, 6.34) 0.194
2009/10 - 2011/12 19.63 (18.28, 20.99) 14.08 (11.20, 16.96) 5.55 (2.37, 8.74) 0.002
2012/13 - 2014/15 20.36 (18.99, 21.73) 15.28 (12.37, 18.19) 5.08 (1.86, 8.29) 0.004
Discussion
The findings of this study show a modest decrease in obesity prevalence overall, for both year groups, from 2006/07 to 2014/15.
Of note, the most recent NCMP national report for the 2016/17 school year (released after this study) highlight that the decline seen nationally may be changing with an increase in obesity prevalence for reception year children, in England, for the last two years, whereas for Year 6 obesity prevalence is stable. 14
9
There is increasing inequality in relation to childhood obesity and deprivation in Doncaster’s primary schools. This is highlighted by the obesity prevalence gap between schools in the most and least deprived quintiles and how this persists over time. For Reception Year children the prevalence gap between the most and least deprived areas has increased from 1.01% in the first three year period (2006/07-2008/09) to 3.64% in the latest time period (2012/13 to 2014/15), an increase of 2.63%. This is greater than the England prevalence gap increase of 0.09 (4.6% in 2007/08 to 5.5% in 2014/15 between the least and most deprived deciles).9 Whilst recognising that the national figures are annual and use deciles whereas the figures in this study were in three-year periods and based on quintiles, it suggests that locally there may be a greater obesity prevalence gap over time for Reception Year children compared to England. This highlights the need to focus weight management initiatives in schools in the most deprived quintile, where the data highlights a significant burden and growing social inequality locally.
For Year 6 children the obesity prevalence gap has increased over time by 2.26%; from 2.82% in the first three-year time period to 5.08% in the latest three-year time period and this is lower than the England gap of 3.1 (8.9 to 12%).9 Whilst it is difficult to compare these figures they suggest that the prevalence gap over time in Doncaster for Year 6 children is no worse than that found nationally unlike the Reception Year.
An important issue to consider in assessing the results is deprivation. In this study a deprivation score was assigned to schools (based on IMD 2015) as postcodes for individual children were not available to the researcher. An individual postcode is a much more precise measure of geographical deprivation rather than a school one. Thus this data may be confounded by children attending non-catchment schools and thus placing them in a different area of deprivation to that in which they live. This may bias the results and underestimate the true obesity prevalence gap in relation to deprivation. However, analysis by school helps to identify priority schools for engagement and provides an opportunity for local government to influence weight
management, healthy eating or physical activity initiatives or other effective school based interventions. 15
A further factor to consider is that deprivation scores change over time and thus using the IMD 2015 scores for the total time period does not take into account any change in geographical deprivation over the analysis period. There have been changes to the national IMD scores in this time and this was not taken into account in the analysis. This could lead to bias in either
direction, however variation in school postcode and resulting IMD score is less susceptible to significant change compared to individual child postcodes.
10
allowed for more in-depth analysis for local application. Also, the absence of data on covariates, such as gender and ethnicity, may have led to residual confounding in the results. As an example, NCMP national reports highlight that obesity prevalence is strongly associated with ethnicity.14 In Doncaster young people from black and minority ethnic (BME) groups represent 10.2% of the total 0-19 population. In 2017, local data indicate that there were over 3100 school children in Doncaster whose first language was not English. This includes 9% of primary school aged children and represents an increase from the previous year.16 As the BME population increases over time, so is the number of children from BME groups during the study period, and further analysis of this group would be of interest.
It is also important to consider how the data translates to clinical need. The thresholds for overweight and obesity for population monitoring purposes are lower than those used for clinical diagnosis17 and this needs to be borne in mind when considering commissioning activities around health promotion as opposed to weight management initiatives.
Finally using compressed data (three by three-year periods) to increase the robustness of the data and limit variation due to small numbers (particularly as the numbers were considerably smaller in the least deprived quintile) loses some sensitivity in analysing trends over time. With each statistic including data from a number of years it can take longer to detect any significant trends.18
The strengths of the study are the use of national epidemiological data and using it in a robust way to undertake small area analysis. The sample size of 57,510 and time period of 9 years are suitably large for analysis.
Quantifying the local obesity prevalence gap and its increase over time
strengthens the case for targeted local commissioning of weight management services. The study highlights that local policy and practice need to ensure that weight management initiatives are focused in the most deprived areas and in particular for those starting primary school where the data suggests the local obesity prevalence gap is worse than that seen nationally. This
emphasises the need for a targeted early years approach.
Conclusion
11 Acknowledgements
No patient identifiable data was used in this project. Permission was sought from the Health and Social Care Information Centre (HSCIC), as the owner of the NCMP data, to access the datasets for the relevant years.
Author Statement
No funding was received for this work and the authors have no competing interests.
References
1. Health and Social Care Information Centre, (2014). Health Questionnaire for England, 2013
http://www.hscic.gov.uk/pubs/hse2013 (last accessed 01/07/2015)
2. Guh, DP., Zhang ,W., Bansback, N., Amarsi, Z., Birmingham, CL., and Anis, AH. The incidence of co-morbidities related to obesity and
overweight: A systematic review and meta-analysis BMC Public Health 2009, 9:88 DOI: 10.1186/1471-2458-9-88
3. National Institute for Health and Care Excellence (2012). Obesity:
Clinical Knowledge Summary.
4. Morgan E. and Dent M. The economic burden of obesity. Oxford:
National Obesity Observatory, 2010.
5. Scarborough P, Bhatnagar P, Wickramasinghe K, Allender S, Foster C, Rayner M.The economic burden of ill health due to diet, physical
inactivity, smoking, alcohol and obesity in the UK: an update to 2006– 07 NHS costs Journal of Public Health | Vol. 33, No. 4, pp. 527–535 | doi:10.1093/pubmed/fdr033 | Advance Access Publication 11 May 2011
6. Butland B, Jebb S, Kopelman P, et al. Tackling obesities: future
choices – project report (2nd Ed). London: Foresight Programme of the Government Office for Science, 2007.
7. Department of Health. Choosing health: Making healthier choices
easier. 2004London: Department of Health
8. Health and Social Care Information Centre. Statistics on Obesity, Physical Activity and Diet: England 2015. Available at:
12
9. Health and Social Care Information Centre. National Child Measurement Programme England 2014/15 School Year, 2015.
Available at:
http://www.hscic.gov.uk/catalogue/PUB19109/nati-chil-meas-prog-eng-2014-2015-rep.pdf (last accessed 03/06/2015)
10. Stamatakis E, Wardle J and Cole TJ. Childhood obesity and overweight prevalence trends in England: evidence for growing socioeconomic disparities International Journal of Obesity 2010 34,
41–47; doi:10.1038/ijo.2009.217; published online 3 November 2009 11. White, J., Rehkopf, D., & Mortensen, L. H. Trends in Socioeconomic
Inequalities in Body Mass Index, Underweight and Obesity among English Children, 2007–2008 to 2011–2012. 2016 PLoS ONE, 11(1), e0147614. http://doi.org/10.1371/journal.pone.0147614
12. Department for Communities and Local Government (2015). Indices of Multiple Deprivation. Statistical Release. Available at:
https://www.gov.uk/government/uploads/system/uploads/attachment_d
ata/file/465791/English_Indices_of_Deprivation_2015_-_Statistical_Release.pdf
13. National Obesity Observatory (2012). Data Fact Sheet: Child Obesity and Socioeconomic Status. Available at:
http://www.noo.org.uk/uploads/doc/vid_16967_ChildSocioeconSep201
2.pdf
14. National Child Measurement Programme England, 2016/17 school
year (October 2017). NHS Digital. Available at:
file:///C:/Users/cm1mnb/Downloads/nati-chil-meas-prog-eng-2016-2017-rep.pdf
15. Waters E, de Silva-Sanigorski A, Hall BJ, Brown T, Campbell KJ, Gao Y, et al. Interventions for preventing obesity in children. Cochrane
Database 2011 Syst Rev; 12.
16. Doncaster Council (2017). Black and Minority Ethnic Health Needs Assessment: Report for the Doncaster Health and Wellbeing Board, March 2017
13
https://www.gov.uk/government/uploads/system/uploads/attachment_d
ata/file/531878/NCMP-Operational-Guidance.pdf
18. National Obesity Observatory. National Child Measurement
Programme: Guidance for Small Area Analysis. July 2011. Available at:
https://khub.net/documents/31798783/32393280/National+Child+Meas
urement+Programme+-+guidance+for+small+area+analysis/b6c07de1-0619-482e-8321-4674bd562d1f?version=1.0 (last accessed