Int. J. Electrochem. Sci., 11 (2016) 7861 – 7874, doi: 10.20964/2016.09.19
International Journal of
ELECTROCHEMICAL
SCIENCE
www.electrochemsci.org
Electrochemical Noise Analysis of Different Herbal Compounds
for Copper Exposed to Chloride Media.
A. M. Nagiub
Chemistry Department, Faculty of Science, Al-Azhar University, Assuit-71524, Egypt. E-mail: [email protected]
Received: 5 May 2016 / Accepted: 28 June 2016 / Published: 7 August 2016
Four different herbal compounds,), Caraway (CARUM Carvi), Cumin (Cuminum Cyminum), Anise (Pimpinella Anisum) and Hibiscus (Hibiscus Sabdarriffa) have been tested as green corrosion inhibitor for copper exposed to 0.5 M NaCl. The corrosion Inhibition has been studied using electrochemical noise (EN) and electrochemical impedance spectroscopy (EIS). The comparative analysis of the results obtained showed that EN is an effective tool for screening of new corrosion inhibitors. Polynomial trend removal method has been used to remove the trend in the potential and current fluctuations during the measurement periods. The results gathered showed very good inhibition efficiency. Generally, EN showed a good correlation with EIS in this study
Keywords: Copper, EN, EIS, Herbal compounds
1. INTRODUCTION
Due to the environmental restriction of application of corrosion inhibitors, researchers reoriented to use natural compounds (green corrosion inhibitors). Green inhibitors will help keep the environment more salubrious, safely and under pollution control. Recently, the use of different herbal compounds as corrosion inhibitors have been widely used, of these some data has been reported for the use of Anise, Caraway, Cumin and Hibiscus as corrosion inhibitors [1-7].
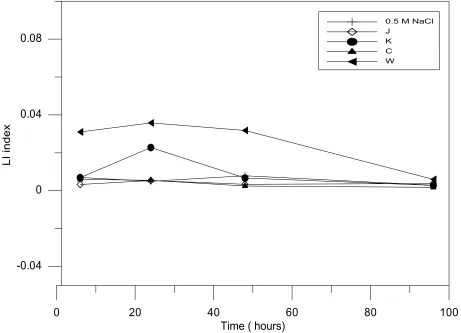
can be calculated [12]. Analysis of noise data can be performed both in the time and frequency domains, Mansfeld et al studied the validity of both statistical parameters such as localization index (LI),skewness and kurtosis and frequency parameters such as power spectral noise (PSD) slopes [13,14]. LI is defined as the ratio of the standard deviation and the root mean square of current fluctuation in EN measurements; accordingly LI will have values between 0 and 1. It was assumed that LI could be used to differentiate between different kinds of corrosion mechanisms [15]. An experimental and theoretical analysis showing the importance of trend that may appear in both potential and current fluctuation has been carried out by Mansfeld et al [10]. Recently, EN has been used to study green inhibitors such as Aloe plant extract, Salvia officinalis and coconut oil modified [16-18]. This study aims to investigate the inhibition efficiency of different herbal compounds as green inhibitors for copper exposed to sodium chloride solution by using electrochemical noise technique.
2. EXPERIMENTAL PROCEDURE
Four different herbal compounds, Hibiscus (Hibiscus Sabdarriffa), Caraway (CARUM Carvi),
[image:3.596.65.532.235.564.2]
3. RESULTS AND DISCUSSION
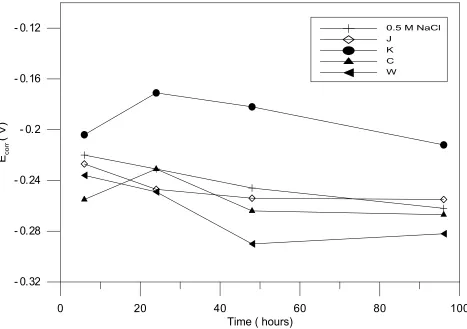
Figure 1 shows the time dependent of corrosion potential (Ecorr) for copper exposed to chloride media with and without different herbal compounds. Generally Ecorr values showed a slight decrease with time which may indicate acceleration of corrosion. The highest Ecorr values were observed for solution containing K. For C, W and J, Ecorr values were less than that obtained for solution without herbal compounds. These results may suggest that C, W and J will electrochemically behave different than K.
Figure 1. Time dependence of Ecorr for copper exposed to 0.5M NaCl with and without different herbal compounds.
[image:4.596.59.522.129.647.2]
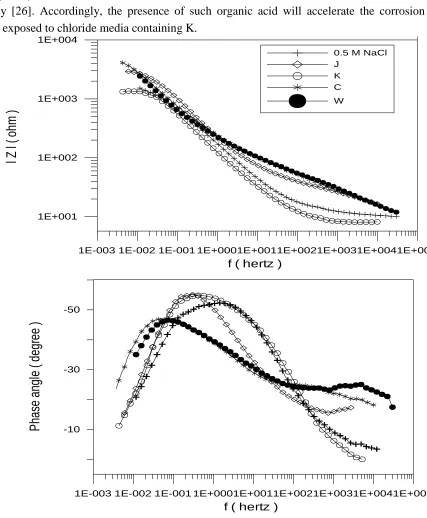
exposed to NaCl with and without herbal compounds after 4 days (Figure 3). The increased impedance followed the following sequence; C > J > W> K.
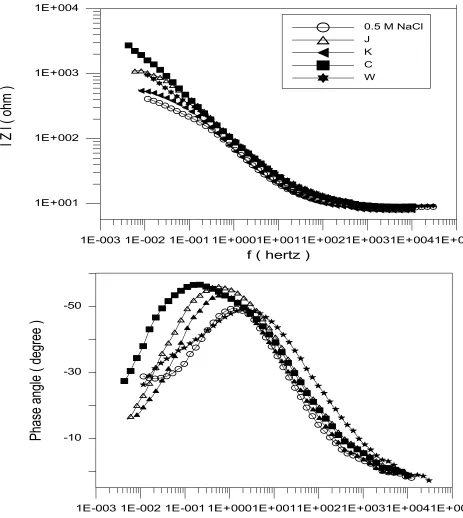
Figure 2. Bode plots for copper exposed to NaCl with and without different herbal compounds after 6 hours.
reported that the chemical composition of the studied herbals were rich in oxygen functional groups such as aldehyde, hydroxyl and hydroxyl acid [23-26]. The presence of such groups might be the main cause of the expected corrosion inhibition. The presence of free lone pairs of electrons on the oxygen atom will establish the adsorption of these compounds with metals surface. Copper like most transition elements has vacant d orbitals that might be occupied by the free lone pairs found in these herbal compounds. The major chemical compounds that have been found in Hibiscus extracts are hibiscus acid, hydroxycitric acid, citric acid, malic and tartaric acids. Oxalic and ascorbic was found with minor quantity [26]. Accordingly, the presence of such organic acid will accelerate the corrosion rate of copper exposed to chloride media containing K.
1E-003 1E-002 1E-001 1E+0001E+0011E+0021E+0031E+0041E+005
f ( hertz )
-50 -30 -10
P
ha
se
a
ng
le
(
de
gr
ee
)
1E-003 1E-002 1E-001 1E+0001E+0011E+0021E+0031E+0041E+005
f ( hertz )
1E+001 1E+002 1E+003 1E+004
l Z
l
( o
hm
)
0.5 M NaCl J
[image:5.596.83.510.189.707.2]K C W
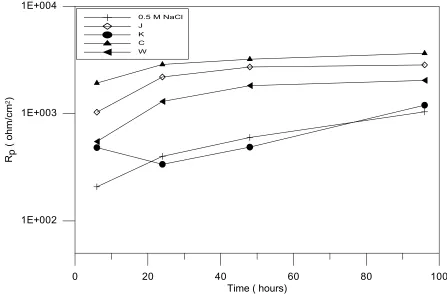
The impedance response of copper samples is approximated by an appropriate equivalent circuit. In this study the impedance spectra were analyzed using the open boundary finite length diffusion model [10,14]. Figure 4 shows the time dependence of Rp in absence and presence of different herbal compounds. Rp values obtained for all the tested herbal compounds except K were much higher than those obtained for copper exposed to NaCl only. The increased values of Rp will reflect the inhibitive effect of the corrosion of copper due to the presence of such compounds. It is also clear that the corrosion inhibition reached its maximum values for solution containing C. Rp values were slightly increased for all of the tested solutions, which indicate improvement of corrosion inhibition with time. The increased Rp values followed the following sequence; C>J>W>K.
Figure 4. Time dependence of Rp for copper exposed to 0.5M NaCl with and without different herbal compounds.
[image:6.596.72.519.257.551.2]
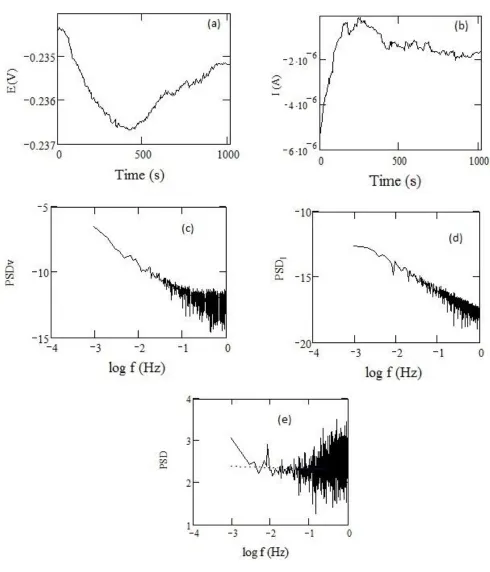
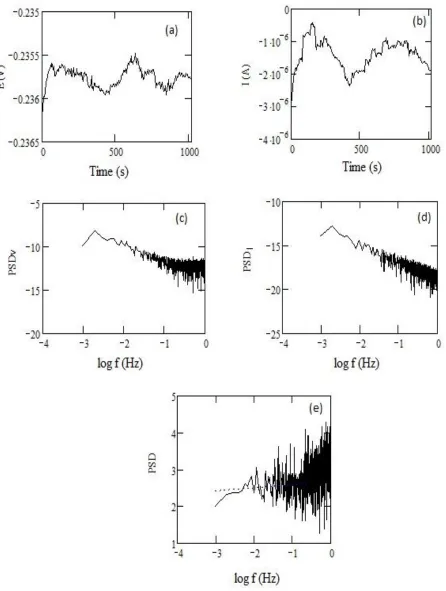
Figure 5. EN data in the time ( a and b) and frequency domains( c-e) for copper exposed to NaCl containing W. for 6 hours
[image:7.596.51.541.65.637.2][image:8.596.55.501.90.681.2]
Figure 7 shows the time dependence of Rn for copper exposed to NaCl with and without different herbal compounds. The high Rn values obtained for W, C and J coincided with the corresponding Rp values obtained from impedance study. Rn values for W, K and C slightly increased with time, which indicate improvement of corrosion inhibition. These results also coincided with Rp values obtained before. After 4 days of exposure Rn values reached its maximum value (Figure 7). Accordingly, the obtained results suggested that these inhibitors could be very effective for the studied period.
Figure 7. Time dependence of Rn for copper exposed to 0.5 M NaCl with and without different herbal compounds.
[image:9.596.70.518.208.533.2]
Figure 8. Time dependence of LI for copper exposed to 0.5 M NaCl with and without different herbal compounds.
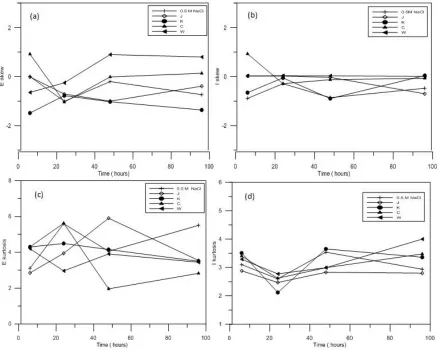
Kurtosis can be used as a measure of the shape of the distribution of the random fluctuation of both potential and current data. For kurtosis value equal to 3 the data will have the shape of a normal distribution, while for values more or less than 3 the shape of the disruption peak will be more sharped or flatted [9, 28]. The asymmetry of the probability distribution of the EN data can be measured by Skewness. If the skewness equals to zero the shape of the noise data will have a symmetric shape. Negative values imply that the distribution is skewed to the left and the distribution is focused in its rightmost section with an extended thin tail to the left. On the other hand, the symmetric distribution will be skewed to the right for positive skewness values [10, 28]. Iskew and Eskew are the skewness of the current and potential fluctuations, respectively. Ikurt and Ekurt are the kurtosis of the current and potential fluctuations, respectively.
[image:10.596.68.529.73.406.2]
Figure 9. Time dependence of Eskew (a), Iskew (b), Ekurt (c), and Ikurt (d) for copper exposed to 0.5 M NaCl with and without different herbal compounds.
The noise data in time domain has been converted to frequency domain by using Fast Fourier transform (FFT). The spectral noise plot (Rsn) is defined as [29, 30]:
Rsn(f) = |
) ( ) ( f I f V FFT
FFT | = (
) ( ) ( f I f V PSD PSD )1/2
Where, VFFT and IFFT will refer to the Fast Fourier Transformer functions of the potential and current noise, respectively, and VPSD and I PSD are the corresponding PSD plots.
[image:11.596.80.519.80.430.2]
noise data confirmed the necessity for the removal of the drifts both in potential and current fluctuations during the measurement periods
[image:12.596.51.550.118.705.2]
5. CONCLUSIONS
The experimental results show that the tested herbal compounds are good corrosion inhibitors of pure copper exposed to solution of 0.5 M NaCl. Negative shift in Ecorr values for NaCl containing herbal compounds (W, C and J) may indicate that they worked as cathodic inhibitors. EIS showed that the corrosion mechanism is controlled by diffusion process. Rp values were increased to a large extent in the presence of herbal compounds. The increased impedance followed the following sequence; C>J>W>K. The obtained Rn values were nearly similar to Rp values. It can be concluded that Rn successfully followed the corrosion behavior of copper exposed to NaCl in the presence and absence of herbal compounds, like EIS. Analysis of noise data demonstrated the need of removal of the trends in the potential and current fluctuations during the measurement periods Analysis of skewness and kurtosis data were independent on the corrosion environment. Accordingly, No mechanistic information could be obtained from skewness and kurtosis data. Noise data showed a good agreement with Impedance data in the frequency domain, so that Noise analysis can be used to detect the corrosion rate but was not found to give mechanistic information. The comparative analysis of the results obtained showed that EN is an effective tool for screening of new corrosion inhibitors. Further studies are required to clarify why one herb works better than the other by going into the structural part of the inhibitor molecule and its inhibition mechanism.
References
1. E. Kamis and N. AlAndis, Mater. Corros., 33 (2002) 550.
2. O. Ouachikh, A. Bouyanzer, M. Bouklah, J.-M. Desjobert, J. Costa, B. Hammouti, and L. Majidi, Surf. Rev. Lett., 16 (2009) 49.
3. A Nagiub, Corrosion/2013 paper No.2458( Houston, TX: NACE International,2013). 4. S. Ghareba and S. Omanovic, Corr. Sci., 52 (2010) 2104.
5. M Abdallah, S. O Al Karanee, A Fatah and A. Abdel, Chem. Eng. Commun., 197 (2009) 1264. 6. A. M Badiea and K. N.Mohana, J. Mater. Eng. Perform., 18 (2009)1264.
7. A.M. Abdel-Gaber, B.A. Abd-El-Nabey, I.M.Sidahmed, A.M. El-Zayady and M. Saadawy, Corros. Sci., 48 (2006) 2765.
8. F. Mansfeld, Z. Sun, E. Speckert and H. Hsu, Corrosion/2000 paper No. 418 ( Houston, TX: NACE International,2000).
9. A Nagiub, Engineering, 6 (2014) 1007. 10. A. Nagiub, Chinese J. Chem., 24 (2006) 247.
11. A. Nagiub and F. Mansfeld, Mater. Corros., 52 (2001) 817.
12. D. A. Eden, K. Hladky, D. G. John and J. L. Dawson, Corrosion/86 paper No. 274(Houston, Texas: NACE, 1986)
13. F. Mansfeld, Z. Sun, C. H. Hsu and A. Nagiub, Corros. Sci., 43 (2001) 341. 14. A. Nagiub and F. Mansfeld, Corros. Sci., 43 (2001) 2147.
15. D. A. Eden, Corrosion/98, Paper no.386 (Houston, TX: NACE, 1998).
16. M. Mehdipour, B. Ramezanzadeh and S. Y. Arman, J. Ind. Eng. Chem. 21(2015) 318. 17. A. Rodriguez-Torres, M. G Valladares-Cisneros and J. G. Gonzalez-Rodriguez, Int. J.
Electrochem. Sci., 10 (2015) 4053.
19. A. M. Abdel-Gaber, B.A. Abd-El-Nabey, I.M. Sidahmed, A.M. El-Zayady and M. Saadaw, Corros. Sci., 48 (2006) 2765.
20. S. E. Nataraja, T. V. Venkatesha, K. Manjunatha, B. Poojary, M. K. Pavithra, and H. C. Tandon, Corros. Sci., 53 (2011) 2651.
21. Li. S. Deng and H. Fu, Corros. Sci., 53 (2011) 1529.
22. N. Caliskan and E. Akbas, Mater. Chem. Phys., 126 (2011) 983.
23. B. Laribi, K. Kouki, A. Mouquo and B. Marzouk, J Sci Food Agric., 90 (2010) 391. 24. A. Orav, A. Raal and E. Arak, Nat. Prod. Res., 15 (2008) 227.
25. Rong Li and Zi-Tao Jiang, Flavour Frag. J., 19 (2004) 311.
26. Da-Costa-Rocha, Inês Bernd Bonnlaender , Hartwig Sievers , Ivo Pischel and Michael Heinrich, Food Chem., 165 (2014) 424.
27. F. Mansfeld and H. Xiao, J. Electrochem. Soc. 141 (1994) 2332.
28. J. Wesley, Statistical Analysis for Engineers and Scientists, McGraw-Hill, New York (1994). 29. F. Mansfeld, H. Xiao, L. T. Han and C. C. Lee, Prog. Org. Coat., 30 (1997) 89.
30. Xiao, L. T. Han, C. C. Lee and F. Mansfeld, Corrosion 53 (1997) 412.