Changing female labour force
participation and work patterns in Jakarta
Nima Sulina Singarimbun
July 1999
Acknowledgments
I am deeply grateful to my Lord Jesus Christ who have found me during my
difficult times writing up this thesis. Thankyou Lord for all your teachings about the
truth, knowledge and wisdom. You help me finish this thesis in your own way. I wish to
thank my brother and sisters in Christ for their prayers during the last stage o f the writing
up, particularly Hilas, Rhoda, Coralie, Linley, Merilyn, and Rhonda. I would also like to
thank my friends in Getsemani Baptist Church, Jakarta for their prayers during the
revision o f this thesis.
I would like to thank the AUS AID for awarding me the scholarship to carry out
this study. I would also like to thank the Faculty o f Geography, Gadjah Mada University
and Population Studies Center, Yogyakarta which gave me an opportunity to undertake
my postgraduate studies at the Australian National University.
I owe a great debt to Prof. Gavin Jones, who always read my draft carefully,
corrected my errors in grammar, and gave encouragement through. I also owe special
thanks to Dr. Chris Manning, who point me in the right direction on many occasions. My
thanks also go to all academic and administrative staff members in the Graduate Program
in Demography for their support.
My special thanks go to Marian May for her help and encouragement during the
most difficult time in my PhD period. My special thanks also go to my mother for editing
the Bibliography and keeping me up with the literature. I wish to thank Anvida Lamberts
for her assistance in editing my English, and Simon Baker for his useful comments on my
‘Introduction’.
I owe special thanks to Iwu Utomo for being there when I needed to discuss my
problems, and for her help. My special thanks also go to Diana Crow who assist me in
subsetting the data for the revision o f this thesis.
My deep gratitude goes to Jonny Sinaga, my husband, for his teachings in faith as
well as his prayers, understanding and support throughout. Last but not least, my thanks
Abstract
This study analyses change in female labour force participation and work patterns in Jakarta. The main analyis is based on the population censuses o f 1980 and 1990. The study examines change in female labour force participation over time and sets changes in female labour force participation and female work in Jakarta in the context o f socio economic and demographic changes in other metropolitan areas o f East and Southeast Asia. The analysis of trends in female participation rates was standardised to take account o f problems o f data comparability and examines detail o f changes in occupations. The advantage o f using the censuses is that analysis can be undertaken based on the three-digit occupational codes, which give more understanding o f change in women’s occupations as well as occupational sex-segregation during the ten year period.
The study found that although female participation rates in Jakarta increased over time, the change was not as rapid as in other cities in East and Southeast Asia. In Jakarta, the increase in participation rates was greater for single women than married women. This pattern is different from other cities mentioned above where the increase was more rapid among married women. Slower economic growth in Jakarta may have contributed to slower change in traditional values about women’s proper role, which lead to less response from older women to economic and social change.
The greatest change in women’s occupation was found within sales occupations. Women increasingly played an important role in retail trade, saleswomen, and shop assistants, as petty trade declined in importance. Changing government policies towards the modem sector trade and the informal sector were partly responsible for these changes as Jakarta capitalised. Further, in 1990 the largest proportion o f women were still employed as household maids, although this share declined during 1980-90. This was partly because o f the increasing number o f women employed as baby sitters, in addition to household maids as young women increasingly joined the labour force.
Occupational sex segregation declined during 1980-90. The proportion of employment in occupations with high female over-representation increased, although in
Table of Contents
Acknowledgements
Abstract
Table of Contents
List of Tables
List of Figures
List of Appendices
in
iv
v
vii
xi
xii
Chapter 1. Introduction
1
1.1. Background to the study 1
1.2. Organisation o f the study 5
1.2. Data sources 5
1.3. Data limitations 7
Chapter 2. Economic Development and Female Labour Force Participation
in East and Southeast Asia
10
2.1. Factors underlying changes in female work 11
2.1.1. Industrialisation policies and economic growth 11
2.1.2. Education 17
2.1.3. Family size and structure 19
2.1.4. Social values and discrimination 20
2.1.5. Urbanisation and migration 23
2.2. Changes in female labour force participation rates 26
2.2.1. Levels and trends o f female labour force participation rates 26
2.2.2. The pattern o f female labour force participation by age 30
2.2.3. Change in the pattern o f female labour force participation
rates by age 32
2.2.4. Females in the working age group 35
2.2.5. Marital status, childbearing and labour force participation 36
2.2.6. Changes in female labour force participation rates and
education 43
2.2.7. Changes in female employment by main industry and
occupation 48
Conclusion 54
Chapter 3. Changing Roles of Women in Urban Indonesia
55
3.1. W omen’s roles in the economy 55
3.2. Values regarding women’s roles 57
3.3. The role o f women in Islam 66
3.4. Maintaining social relations 68
Chapter 4. Socio-economic and Demographic Change in Jakarta
74
Introduction 74
4.1. Historical background o f Jakarta 75
4.2. Social change in Jakarta 76
4.3. Demographic change in Jakarta 82
4.3.1. Change in age structure 83
4.3.2. Change in marital status 85
4.3.3. Change in education 88
Summary and conclusion 91
Chapter 5. Changing Female Labour Force Participation in Jakarta
93
5.1. Trends in the proportion o f ‘others’ category 94
5.2. Trends in female participation rates in Jakarta during 1970-90 99
5.3. Female labour force participation among young women 104
5.4. Relative change in participation rates o f married and single
women during 1980-90 107
5.5. Change in attitudes o f women and men 109
Conclusion 111
Chapter 6. Changing Employment and Occupation in Jakarta:
an Overview
112
6.1. Changing work status and industry 112
6.1.1. Services 117
6.1.2. Trade 119
6.1.3. Manufacturing 123
6.1.4. Finance 127
6.2. Change in broad occupational pattern o f employment in Jakarta
during 1971-90 127
Conclusion 132
Chapter 7. Analysis of Change in Occupational Patterns of Employment
in Jakarta during 1980-90
133
7.1. Occupational pattern o f employment by education 133
7.2. Change in detailed occupational pattern o f employment in Jakarta
during 1980-90 135
7.3. The trend in occupational sex segregation 160
Summary and conclusion 166
Chapter 8. Conclusion
168
Bibliography
Appendix
List of Tables
List of Tables
Table 2-1. GNP per capita and GDP growth rates, East and Southeast
Asian countries (constant prices) 12
Table 2-2. Average annual growth of exports. East and Southeast Asian
countries, 1970-80 to 1980-92 (per cent) 14
Table 2-3. Structure o f merchandise expons, East and Southeast Asian
countries, 1970-92 (per cent) 14
Table 2-4. Distribution o f Gross Domestic Product by sector in East and
Southeast Asian countries, 1970-92 (per cent) 15
Table 2-5. Employment structure by sector, East and Southeast Asian
countries, 1970-92 (per cent) 16
Table 2-6. Enrolment ratios at primary and secondary level by sex,
East and Southeast Asian countries, 1970-90 18
Table 2-7. Level o f urbanisation, East and Southeast Asian countries,
1960-90 (per cent) 23
Table 2-8. Change in female labour force participation rates in urban areas,
East and Southeast Asian countries, 1970s-90s (ages 15+) 27
Table 2-9. Unemployment rates by sex, Hong Kong, Singapore, Bangkok and
Jakarta, 1980-90 29
Table 2-10. Females in the working age population by age group, Hong Kong,
Singapore, Bangkok, Jakarta and Manila, 1980s-90s (per cent) 36
Table 2-11. Female workforce by marital status, Singapore, Bangkok
and Jakarta, 1970s-90s (aged 15+) 39
Table 2-12. Female employment by main industry in Hong Kong, Singapore,
Bangkok and Jakarta, 1980-90 (per cent) 49
Table 2-13. Employment by sex and occupation in Hong Kong, Singapore,
Bangkok and Jakarta, 1980s-90 (per cent) 50
Table 2-14. Percentage female o f total workers by occupation
in Hong Kong, Singapore, Bangkok and Jakarta, 1980s-90 51
Table 2-15. Women employed in household service in metropolitan areas of
Table 4-1. In-migration rate in Jakarta, 1971-90 78
Table 4-2. Change in major areas o f origin o f immigrants to Jakarta, 1971-90 78
Table 4-3. Population density in Java by province, 1971-90 80
Table 4-4. Population of Jakarta and BOTABEK region, 1961-90 82
Table 4-5. Labour force growth rates by sex in Jakarta, 1971-80, 1980-90 85
Table 4-6. Change in marital status o f the population 15 years and over
in Jakarta and urban Indonesia, male-female, 1961-90 86
Table 4-7. Proportion never married among the female population 15 years and
over by age group and sex, Jakarta, 1961-90 87
Table 4-8. Average age at first marriage by provinces, Java, females,
1964, 1971-90 88
Table 4-9. Population 10 years and over by educational level, Jakarta and
urban Indonesia, 1971-90 89
Table 4-10. Population 5 years and over still enrolled in school by age and
sex, Jakarta, 1961-90 (per cent) 91
Table 5-1. Percentage of population classified as ‘others’ by age,
urban Indonesia, female, 1971-90 95
Table 5-2. The proportion o f female population classified as ‘others’ by
age group, urban Indonesia and Jakarta, 1971-90 96
Table 5-3. Status o f activity by age group, female, Jakarta, 1971-90 (per cent) 98
Table 5-4. Unemployment ratios: unadjusted and adjusted, urban Indonesia 101
Table 5-5. Female participation rates by age group, Jakarta, 1961-90 102
Table 5-6. Changes in female participation rates by age, Jakarta,
1971-80, 1980-90 103
Table 5-7. Changes in female participation rates (15-29) by marital status,
Jakarta, 1980-90 105
Table 5-8. Education o f young women (20-29) by marital status, Jakarta,
1980-90 105
Table 5-9. Changes in young women’s education (20-29) by marital status,
Jakarta, 1980-90 (per cent) 106
Table 5-10. Young women’s participation rates (20-29) by marital status and
Table 6-1. Employment status by sex, Jakarta, 1971-90 113
Table 6-2. Wage workers by age group and sex, Jakarta, 1971-90 114
Table 6-3. The proportion o f wage workers in each non-agricultural sector
by sex, Jakarta, 1980-90 115
Table 6-4. Changes in women’s employment by main industry, sex ratio,
Jakarta, 1971-90 116
Table 6-5. Percentage distribution and growth o f GDP by economic sector,
Jakarta, 1975-90 (constant prices) 117
Table 6-6. Services sector employment, females and males, Jakarta, 1980-90 118
Table 6-7. Women in services sector by education, Jakarta, 1980-90 119
Table 6-8. Women employed in trade, Jakarta, 1980-90 (per cent) 120
Table 6-9. Women employed in trade by education, Jakarta, 1980-90 122
Table 6-10. Female employment in major sub-sectors (ISIC 3,8,9) by
employment status, Jakarta, 1980-90 125
Table 6-11. Age distribution, educational level and marital status o f
manufacturing workers, females and males, Jakarta, 1980-90 126
Table 6-12. Share o f employment in each main occupation, females and males,
Jakarta, 1971-90 (per cent) 128
Table 6-13. Change in shares of age groups in women’s employment by
occupation, Jakarta, 1971-90 129
Table 6-14. Change in shares o f age groups in male’s employment by occupation,
Jakarta, 1971-90 130
Table 6-15. Change in share o f women’s educational attainment by occupation,
Jakarta, 1971-90 131
Table 6-16. Change in share o f male’s educational attainment by occupation,
Jakarta, 1971-90 131
Table 7-1. Employment by occupation and education, females and males,
Jakarta, 1990 134
Table 7-2. Change in share o f employment’s educational attainment by
occupation, females and males, Jakarta, 1980-90 135
Table 7-4. Male workers in specific occupations, Jakarta, 1980-90 138
Table 7-5. Women workers in specific occupations, Jakarta, 1971-90 140
Table 7-6. Age distribution, educational level and marital status of women
employed as household maids, Jakarta, 1980-90 (per cent) 143
Table 7-7. Women employed as working proprietors in retail trade, vendors and saleswomen/ shop assistants by age group, marital status,
education and migrant status, Jakarta, 1980-90 146
Table 7-8. Men working as working proprietors and vendors by age group,
education and marital status, Jakarta, 1980-90 147
Table 7-9. Salesmen, shop assistants by age group, education, marital status
and sex, Jakarta, 1980-90 150
Table 7-10. Women as textile and garment factory workers by age group,
marital status and education, Jakarta, 1980-90 152
Table 7-11. The educational attainment o f women employed as textile and
garment factory workers and household maids, Jakarta, 1980-90 154
Table 7-12. Bookkeepers and cashiers, clerks and teachers by age, sex and
education, Jakarta, 1980-90 156
Table 7-13. Employment in clerical work by detailed occupations and sex,
Jakarta, 1980-90 157
Table 7-14. Change in the distribution o f employment within the teaching
category by sex, Jakarta, 1980-90 (per cent) 158
Table 7-15. Indexes o f dissimilarity in occupations o f women and men based on
both without and with comparable aggregation, Jakarta, 1980-90 163
Table 7-16. Proportions o f employment in occupations with differing degrees
List of Figures
Figure 2-1. Female labour force participation rates by age, metropolitan
areas o f East and Southeast Asia, 1990 31
Figure 2-2. Changes in female labour force participation rates, major
cities o f East and Southeast Asia, 1970s-90s 34
Figure 2-3. Changes in female labour force participation rates by marital
status, major cities o f East and Southeast Asia, 1970s-90s 41
Figure 2-4. Changing female labour force participation rates by age and
marital status, Singapore and Jakarta, 1980s-90s 42
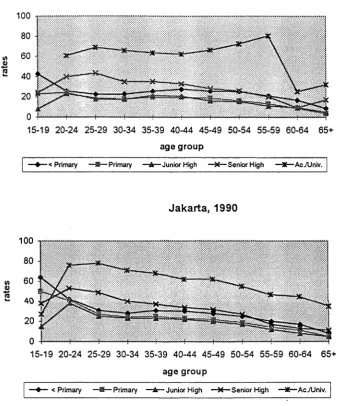
Figure 2-5. Changes in female labour force participation rates by education
in Singapore, Bangkok and Jakarta, 1980s-90s 44
Figure 2-6. Changes in female labour force participation rates by age and
education, Jakarta, 1980-90 46
Figure 2-7. Changes in female labour force participation rates by age and
education, Singapore, 1981-93 47
Appendix 5-1.
Appendix 5-2.
Standardisation of female labour force participation, Jakarta, 1971
Chapter 1 : Introduction
This thesis deals with changing female labour force participation and work
patterns in Jakarta. Women in many societies have played an increasingly important role in
the labour force in the process o f industrialisation. Studies in developing countries in East
Asia and in developed countries (particularly in the United States in the late
industrialisation period) have shown that many women joined the labour force because o f
changing values, demographic structure and because more jobs were often available to
them. The increase was particularly rapid for married women. The industrialisation also
opened up other economic activities in commercial as well as services sectors, which lead
to changing patterns o f women’s employment in the later stage o f economic development.
Since more jobs were opened up for women, studies in the USA in particular show that
occupational sex segregation tended to decline over time.
Jakarta just began a period o f rapid export-oriented industrialisation in the 1980s,
much later compared with other countries in East and Southeast Asia. Large
improvements in education o f women, changes in age at marriage and family structure
also occurred quite late in Jakarta. The focus o f this thesis is on examining how women’s
labour force participation, employment patterns and occupational sex segregation have
changed over time in response to these developments.
1.1. Background to the study
Studies on female participation in the labour force in developed countries,
particularly in the United States, have been numerous. However, there have been only a
limited number o f studies undertaken in developing countries, including Indonesia.
Until quite recently, most studies on women’s employment in Indonesia were
concentrated on rural women. Research on urban women was lacking. This research on
mainly based on cross-sectional data.1 There have been few studies based on provincial or
national data sets, posing questions about the overall role women play in the labour
market, and how this has been changing in the process o f development. This thesis
attem pts to address the problem by giving an analysis o f changing w om en’s participation
in the labour market in Jakarta in the process o f development.
Changes in female labour force participation rates are influenced by both supply
and demand. The supply side includes socio-economic and demographic changes as well
as cultural attitudes about the proper role o f women. Rates o f economic and social
developm ent in Jakarta have been rapid, particularly after the mid-1980s. At the same
time the dem ographic structure o f the population has changed. As fertility and mortality
rates declined, the proportion o f the population aged less than 15 years decreased, and by
1990 the proportion o f all female population aged over 15 increased.
Furtherm ore, the age structure o f the Jakarta population is greatly affected by
migration. Age at first marriage also rose, because w om en increasingly delayed their
marriages and increasingly became more-educated.
The demand side for female participation was influenced by rapid economic
expansion and economic deregulation in the 1980s, which resulted in the rapid grow th o f
labour-intensive export industries (Hill, 1996). The expansion o f factories engaged in
m anufacturing activities such as garments and food processing brought new employment
opportunities for women, particularly for those who w ere young (White, 1993). Smaller
enterprises also increased rapidly during the 1980s, which w ere characterised by a massive
use o f sub-contracting and putting-out arrangem ents in order to reduce the production
costs.
stage in the industrialisation process, retail business and commercial establishments such
as big department stores and shopping complexes started to grow in Indonesia, and
especially in the capital and centre o f business, Jakarta.
Government policies towards kcimpung settlements in the city and towards
informal sector workers as the city modernised also played an important role in changing
women’s employment. Jellinek (1991) argued that until the mid-1970s the kcimpung and
city were symbiotic, meaning that the kcimpung residents provided cheap labour, goods
and services for the expanding city, and that on the other hand, they obtained better
access to employment and a higher income than if they had remained in their villages. The
process peaked around the late 1960s and the early 1970s when construction work in the
middle o f the city was booming. As the city rapidly modernised, however, in the mid-
1970s the prosperity o f the inner city kcimpung settlements was threatened and by 1975
the small-scale, self-employed jobs which had helped many kcimpung residents raise their
standard o f living were being displaced.
As the importance o f agriculture within the Indonesian economy declined, the role
o f urban areas, particularly Jakarta, in providing economic activities become more
important. Despite the decline in some o f the traditional employments o f low-income,
kcimpung women, other work opportunities were opening up. As a result more and more
women migrated to Jakarta to earn a living. With urbanisation, the structure of the labour
market became more diverse. Jakarta provided jobs for both less-educated and
has depended partly on changing some values and attitudes to women’s work. Socio
economic and demographic change have occurred against a backdrop o f conservative
socio-cultural attitudes and values regarding the economic role of women. This is because
the social norms often demand that women be submissive to men. The ideal concept of a
woman, one who takes care of her husband and children, is deeply rooted in Indonesia.
This concept is reinforced by state and legal ideology. The Marriage Law o f 1974 (article
31) states that the husband is the head o f the household and the wife is the mother of the
household. Further, the Guidelines o f State Policy (Gciris-gciris Besar Hainan
Negara=GBHN) heavily emphasise the role o f women in the family. Government
programs for women portray a particular image which women are expected to follow, that
is a woman will find fulfillment by being a supportive wife, a good mother, and a good
housewife, none o f which need remuneration.
All o f these changes, both in labour supply, labour demand and in values, can be
expected to have been especially rapid in Jakarta. Demographic, social and economic
change often occurs earliest in the capital city and commercial centre.
These big changes in factors underlying the supply and demand for labour raise
many questions regarding the changing structure of the labour force, and especially female
participation and employment in a rapidly changing city. The major questions are as
follows: what has been the outcome of economic change for women’s labour force
participation and employment, and how have the changes in women’s employment
differed within different age cohorts and educational groups? How have economic
changes interacted with traditional values about the role o f women in leading to more
liberal ideas about women’s participation in the labour force9 How was the trend in
There are difficulties in analysing changing female labour force (Oppenheimer,
1970). This is mainly due to the definition of work according to the censuses. As in other
developing countries, most people in Jakarta must earn a living. However, female
participation rates in Jakarta, recorded in the censuses, tend to be low. The low rates of
female labour force participation in Jakarta based on the 1971 and 1980 censuses were, in
part, because o f problems of classification of the working age group population. The
thesis also adresses conceptual and methodological issues in defining the female work
force and female employment.
1.2. Organisation of the study
The thesis is organised into three parts. The first part consisting o f Chapter 2, aims
to set trends in Jakarta into the context o f demographic and socio-economic change in
South-East Asia as a whole, and the consequent change in women’s employment in cities
o f this region. It therefore discusses changing female labour force participation in Jakarta
in the context of East and Southeast Asian metropolitan areas. Factors affecting these
changes, both supply and demand factors, are analysed. The second part, Chapters 3 and
4, presents background on the changes in roles o f women in urban Indonesia in general
and the socio-economic changes in Jakarta in order to support the quantitative analysis in
subsequent chapters. The third part, Chapters 5, 6, and 7, examines changes in female
participation rates as well as employment, work status and occupational patterns in
Jakarta. Factors affecting these changes are also discussed.
1.3. Data sources
There are four main secondary sources o f data on the Indonesian labour force.
They are the population censuses, Intercensal Surveys, National Labour Force Surveys
(SAKERNAS), and the National Socio-Economic Surveys (SUSENAS). Population
1971, 1980 and 1990. Intercensal Surveys (SUPAS) have been undertaken three times:
1976, 1985 and 1995. National Labour Force Surveys (SAKERNAS) were started in 1976
and were conducted quarterly in 1977-1978 and 1986-1994. The National Socio-
Economic Survey (SUSENAS) was conducted in 1982 and a nationally representative one
was undertaken in 1993. All o f these data are collected by the Central Bureau of Statistics
in Jakarta.
However, among the main sources mentioned above, only the censuses will be
used for the main analysis in the thesis. This is because it is difficult to analyse trends in
female labour force participation rates based on different sources because o f the different
definitions, procedures and focuses used in the different sources (Jones, 1987a). In an
analysis o f changing female labour force participation over time using the census, SUPAS
and SAKERNAS, Jones (1987a) suggests that much o f the difference in activity rates
found in various survey reflects different definitions and procedure rather than real
changes. Another possible reason for the differences in female labour force participation
rates among these data sources is because o f the differences in when they are conducted.
Whereas SUPAS and censuses are conducted in October, SAKERNAS are conducted
four times in a year. The published data from the latter is based on the average of these
three-monthly result. The SUPAS and SAKERNAS figures tend to show higher
participation rates than the censuses because o f the higher proportion o f women in the
unpaid family worker category.
The analysis o f this study, then, is based on the population censuses. The published
data from the 1961 and 1971 censuses are used to analyse the broad trends within main
industries and occupations (one-digit), whereas the 1980 and 1990 census data tapes are
used in order to analyse changes in detailed occupational patterns (three-digit) in that
The advantage o f using the data tapes of the censuses is that these sources provide
data on detailed occupations (three-digit), which are not available through other sources,
except SUPAS. Unfortunately, data on three-digit occupations based on SUPAS are not
directly comparable with those based on the censuses. This is partly because SUPAS has a
smaller sample size, therefore, it will lead to greater variability owing to sampling.
As regards the month o f the census, which must be taken into account because of
seasonal activities, the censuses are comparable because all were conducted in October,
which is the least active economic period o f the year in agriculture.
The sampling rate used in the 1971, 1980 and 1990 censuses for Jakarta is
different. However, this does not greatly affect the results o f the analysis. The sampling
rate in the 1971 census was about 3.8 per cent, whereas in 1980 and 1990 it was 5 and 10
per cent respectively.
The classifications o f main industry and major occupation were based on the
international classification system developed by the United Nations in 1968. The
classification is widely known as the International Standard Industrial Classification
(ISIC) and the International Standard Classification o f Occupations (ISCO). These
classifications were modified to the Indonesian economic setting, resulting in nine main
industrial and eight major occupational categories (Manning, C., 1982:2).
1.4. Data limitations
Discussion o f data limitations includes measurement of the economically active
population based on each census, the definition used in classifying the working age
population in each censuses, differences in the processing o f the results of the censuses,
Measurement o f the economically active population in the 1961 census was
different from that used in other censuses. In the 1961 census, the gainful worker
approach was used, with people recorded according to their usual activity in a particular
time reference, in this case six months. The limitation o f this approach is that people who
used to work but are no longer doing so (including those who have retired at the time o f
enumeration) will tend to be classified as economically active. On the other hand,
unemployed people will not be included in the economically active population. Moreover,
recall is easier for a short period than for a six month period. Because o f these limitations,
since the 1971 census the Central Bureau o f Statistics has used the labour force concept.
In this approach, people are recorded according to their current activity in a particular
reference period. Although the reference period o f one week applied to the 1971 census is
the same as that applied in the 1980 and 1990 censuses, the minimum working hours are
not the same. The minimum working time used in the 1971 census was two days, while
that used in the later censuses was one hour. The different minimum working hours used
by the 1971 and the later censuses, do not appear to greatly affect the recorded
economically active population.
The definition o f the working age population in the 1971 and 1980 censuses was
slightly different from that in the 1990 census. Whereas in the former censuses, the
classification o f working age population was based on a question on main activity during
the previous week, in the latter it was based on a question on activity mostly undertaken
in terms o f time commitment. The change in 1990 was minor, however, and should not
affect female labour force participation rates.
The 1971 and 1980 censuses tend to record lower labour force participation rates
than in 1990 because o f the high proportion of people recorded in the 'others’ category in
the classification of working age population. Some scholars (Hidayat, 1976; Bukit and
this study (Chapter 2 and Chapter 5), the labour force participation rates were adjusted
before comparing them with other data.
Caution needs to be taken in analysing changes in occupations based on the
censuses, because of some expansion and reclassification o f occupations within the ten
year period 1980-1990. For example, in the 1980 census, teletypists were classified
together with stenographers and typists (321), but in the 1990 census they were classified
separately (323). Bookkeepers and cashiers were classified together (331) in the 1980
census, but were classified separately in the 1990 census. These problems of classification
Female Labour Force Participation in
East and Southeast Asia
East and Southeast Asian countries have experienced very rapid economic growth.
The export-oriented growth strategies have been a success in the East Asian countries and
Singapore which resulted in their transition to the status o f middle-income industrialised
countries by the 1990s. In addition to the spectacular economic growth, East and
Southeast Asian countries have been undergoing a rapid demographic transition. The
decline in population growth in the past 25 years is due to the decline in fertility.
During the later stages o f the demographic transition, the labour force
participation rates have been rising and the rise in female participation rates is one of the
factors causing the labour force to grow rapidly (Galenson, 1992). Part o f this effect is
due to a change in the age distribution, and part is due to the rise in married women’s
participation in labour markets as the share o f their time devoted to childrearing declines
One would expect that participation rates would have risen quickly in those
countries where education o f women improved more quickly, because education opens up
new work opportunities. Given the negative relationship between education and number
o f children, and the positive relationship with female labour participation, one might
expect female labour force participations to have risen more steeply in more developed
Eastern Asian countries, where education has reached advanced levels, compared with
Southeast Asian countries.
This chapter discusses female participation rates in East and Southeast Asian
countries during 1970-90 where data are available. Both supply and demand factors will
be examined. The factors include economic factors, education, family size and structure,
factors, levels, trends and patterns o f female participation as well as main industry and
occupation o f women will be analysed.
Until recently, the age limit applied by the Indonesian Central Bureau o f Statistics
in defining the Indonesian labour force was 10 years and above. This age limit is the
lowest among the East and Southeast Asian countries. The age limit used in the Thai
censuses up to 1980 increased from 11 to 13 years in 1990, whereas that for Taiwan,
Singapore, Malaysia and the Philippines it increased from 10 in 1971 to 15 in 1980. In this
study, both age limits (10 and 15 years) are used to ensure the widest comparability for
the available data.
2.1.
Factors underlying changes in female work
The factors underlying changes in female work that will be examined in this
section are economic growth, education, family size and structure, social values and
discrimination, and urbanisation and migration.
2.1.1. Industrialisation policies and economic growth
Industrialisation policies affect the propensity o f women to be in the labour
market. Policies favouring export-oriented manufacturing tends to increase women’s
employment, relative to men, as women have been the preferred source of labour for
labour-intensive, export-oriented industries (Lim, 1993b:211).
The countries in East and Southeast Asia all began to develop with import
substitution strategies in the 1960s. Most Southeast Asian countries moved toward
labour-intensive, export-oriented manufacturing much later than the East Asian countries
(World Bank, 1995). Among the Southeast Asian countries, Indonesia was the last to
adopt an outward-oriented strategy. Although most o f the Southeast Asian countries had
adopted outward-oriented strategies in the 1970s, Indonesia adopted it only in the 1980s.
absorption in the manufacturing industry in Indonesia was not as rapid as that in other
Southeast Asian countries.
Among the Southeast Asian countries included in Table 2-9, Indonesia has the
lowest GNP per capita. During 1970-80 the GDP growth rate in Indonesia was closer to
the others.
During the decade 1970-80, the average annual growth rate o f GDP of the newly
industrializing countries was higher compared with the ASEAN-4 countries, ranging from
8.3 per cent in Singapore to 9.6 per cent in the Republic o f Korea (Table 2-1). Among
the ASEAN-4 countries, the highest GDP annual growth rates during 1970-80 was
achieved by Malaysia. However, during the following period 1980-92, growth rates
declined for most o f the countries o f East and Southeast Asia, partly due to the world
recession during the 1980s (World Bank, 1995). Only Korea and Thailand maintained
their economic growth. During this period, the rate o f economic growth in Thailand was
highest among the ASEAN-4 countries, and even higher than that o f Hong Kong and
Singapore. The Philippines recorded the lowest growth rate, while that o f Indonesia was
slightly lower (5.7 per cent) than that o f Malaysia (5.9 per cent).
Table 2-1. GNP per capita and GDP growth rates, East and Southeast Asian countries (constant prices)
Countries GNP per capita (dollars) GDP annual growth rates
(per cent)
1976 1992 1970-80 1980-92
Rep. of Korea 670 6790 9.6 9.4
Hong Kong 2110 15360 9.2 6.7
Singapore 2700 15730 8.3 6.7
Malaysia 860 2790 7.9 5.9
Thailand 380 1840 7.1 8.2
Philippines 410 770 6.0 1.2
Indonesia 240 670 7.2 5.7
The dramatic rate of economic growth in some o f the newly industrializing
countries in the 1980s was achieved at the expense of worsening income distribution.
From the 1980s, income distribution in the newly industrializing countries has tended to
become more unequal, in contrast to the earlier period when the distribution became more
equal as the economies grew (Krongkaew, 1994:70). By contrast, Indonesia, Malaysia
and the Philippines have shown a tendency toward greater equality in the distribution of
income in recent years. Thailand was the exception among the ASEAN-4 countries. Its
worsening income distribution reflected the effect o f a pattem o f industrialisation in which
investment promotion favoured capital-intensive over labour-intensive activities.
Industrial activities have been concentrated in and around Bangkok, and the industrial
sector has been protected by various government policy measures.
The rapid economic growth in East and Southeast Asia was achieved by an
outward-looking industrialisation policy emphasizing export promotion, combined with
rapid increases in the production o f agricultural commodities. Among the ASEAN-4
countries, the growth of export in Indonesia during the period 1970-80 ranked the second
after Thailand and w'as even higher than that o f Singapore (Table 2-2). However, because
o f the effect o f the fall in oil price, the growth of exports in Indonesia, as in most East and
Southeast Asian countries, declined during 1980-92. Thailand succeeded in maintaining a
high rate o f growth (14.7 per cent), even higher than the previous period, followed by
Malaysia (11.3 per cent) and Singapore (9.9 per cent). Among the East Asian NICs, the
Table 2-2. Average annual growth of exports, East and Southeast Asian countries,
1970-80 to 1980-92 (per cent)
Countries 1970-80 1980-92
Taiwan 15.6 11.0
Korea 23.5 11.9
Hong Kong 9.7 5.0
Singapore 4.2 9.9
Malaysia 4.8 11.3
Thailand 10.3 14.7
Philippines 6.0 3.7
Indonesia 7.2 5.6
Source: World Bank (1994: Table 13)
Table 2-3. Structure of merchandise exports, East and Southeast Asian countries, 1970-92 (percent)
Fuels Primary
Commodity
Machinery Other
Manufactures
1970 1992 1970 1992 1970 1992 1970 1992
Rep. of Korea 7 17 4 7 40 69 53
Hongkong 1 2 12 24 84 71
Singapore 25 15 45 7 11 52 20 26
Indonesia 44 38 54 15 0 4 1 44
Malaysia 30 17 63 22 2 38 6 23
Philippines 23 8 70 19 0 17 8 56
Thailand 15 2 77 32 0 22 8 45
Source: World Bank (1994: Table 15).
The share o f other manufacturing goods in total exports was the highest for all
East Asian countries from 1970. The highest level was recorded in Hong Kong, although
the figure had declined in 1992 (Table 2-3).
Primary commodities played an important role in all Southeast Asian countries in
1970, but by 1992 their share o f total exports had declined substantially (Table 2-3). As
the share o f primary commodity declined, other manufactures share the largest to total
merchandise export in Indonesia, Philippines and Thailand. In 1992, Malaysia follow the
pattern in Singapore, where as the share o f primary commodities decreased, the share o f
machinery and transport equipment in total exports increased strikingly. By 1992, the
proportion o f machinery’ and transport equipment to total exports was the largest in these
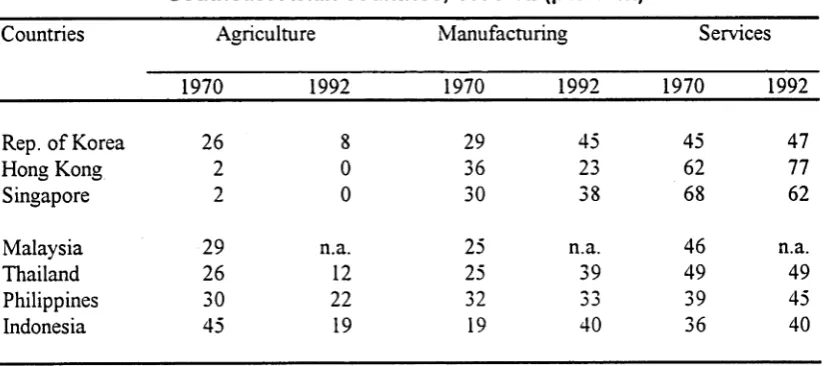
Among the ASEAN-4 countries, the rate of industrialisation in Indonesia was the
highest as measured by the change in the increase in the share o f manufacturing in total
output over time (Table 2-4). This is because the share o f industry in total GDP in
Indonesia started from a low base (19 per cent), and it increased to 40 per cent in 1992.
By contrast, the share o f manufacturing in total output declined in Hong Kong, offset by a
rapid rise in the share o f services.
The increase in the share o f industry o f total GDP in the ASEAN-4 countries has
been at the expense o f the agricultural sector, the share o f which declined over the last
two decades. For the services sector, a substantial increase was found only in Hong Kong
and the Philippines.
The rate o f industrialisation in the Asian NICs was also quite remarkable. In all
countries under consideration with the exception o f Hong Kong, the share of
manufacturing to total GDP increased sharply at the expense o f agriculture (Table 2-4).
Table 2-4. Distribution of G ross Dom estic Product by sector in East and Southeast Asian countries, 1970-92 (per cent)
Countries Agriculture Manufacturing Services
1970 1992 1970 1992 1970 1992
Rep. of Korea 26 8 29 45 45 47
Hong Kong 2 0 36 23 62 77
Singapore 2 0 30 38 68 62
Malaysia 29 n.a. 25 n.a. 46 n.a.
Thailand 26 12 25 39 49 49
Philippines 30 22 32 3 3 39 45
Indonesia 45 19 19 40 36 40
Source: World Bank (1994: Table 3)
[image:27.509.41.454.450.633.2]As the structure of production was rapidly transformed, the structure of
employment also changed rapidly (Table 2-5). The percentage share of agricultural
employment declined, although the largest share o f employment in Thailand and Indonesia
were still in the agricultural sector in 1992. Agriculture’s higher share in employment
than in output reflects lower productivity per worker in agriculture than in other
industries.
Table 2-5. Employment structure by sector, East and Southeast Asian countries, 1970-92 (per cent)
Countries Agriculture Manufacture Services
1970 1992 1970 1992 1970 1992
Rep. of Korea 50 16 17 35 32 49
Hong Kong 2a - 36a 28 62a 72
Singapore * * 38 35 61 65
Malaysia 53 26b 10 28b 37 46b
Thailand 80 60° 6 15c 14 24c
Philippines 51 45 16 16 32 39
Indonesia 67a 55 93 14 24a 31
Source: ILO. Year Book of Labour Statistics (1973: Table 3); ELO. Year Book of Labour Statistics (1993: Table 3);
Indonesia. BPS (1974: Table 45); Indonesia, BPS (1992d: Table 44.9)
Note : Total may not add up to 100 because of rounding * less than one per cent
a 1971 b 1990 c 1991
The difference in industrial structure between the newly industrializing and
ASEAN-4 countries is likely to affect female employment in urban areas. Certain sectors
o f industry, for example clothing and electronics, often located in urban areas which tend
to have a higher proportion o f females. So, in countries where these industries were
thriving, many jobs were likely to be available for women in towns. However, as we have
seen, the availability o f jobs, wage levels and working conditions, and the relationship
between productive and non-productive work, may also affect women’s decisions to enter
very greatly between countries, will result in different conditions of women’s employment
in the countries under consideration.
2.1.2. Education
Education is generally considered a pre-requisite for economic participation in the
modern sector in the process o f industrialisation and general development. Modern sector
employers have relied on educational achievement as a device for screening job
applicants. The better a woman’s education, the more likely it is that she will participate in
the modern sector of the labour force (see Standing, 19S2d: 139-163).
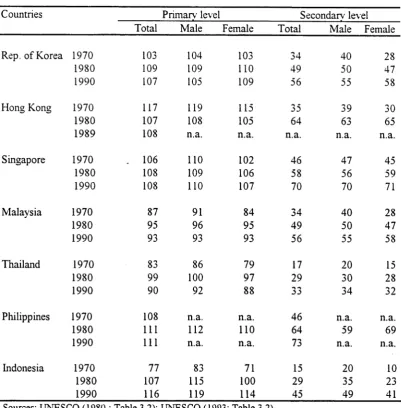
Females o f working age are increasingly better educated in East and Southeast
Asia as a result of almost universal primary education and increasing proportions o f
women gaining some secondary’ education. Enrolment ratios for females, especially in
secondary education, have increased substantially in the countries under consideration
within the last two decades (Table 2-6).
Females in East Asian NICs are better educated than in the ASEAN-4 countries
excluding the Philippines.Table 2-6 shows that secondary enrolment ratios in the East
Asian NICs are higher than that in Malaysia, Thailand and Indonesia. Within the ASEAN-
4 countries, females in Indonesia and Thailand were less-educated than those in Malaysia
and the Philippines. Nevertheless, female education in Indonesia and Thailand has
increased rapidly.
.Although in most cases males are still better educated than females, the gender
differential in education has narrowed over time in all the countries mentioned above. At
the secondary level, there has been a crossover in favour o f females in Hong Kong,
Singapore and the Philippines since 1980 and in Malaysia since 1990. The enrolment
Table 2-6. Enrolment ratios at primary and secondary level by sex, East and Southeast Asian countries, 1970-90
Countries Primary level Secondarv level
Total Male Female Total Male Female
Rep. of Korea 1970 103 104 103 34 40 28
1980 109 109 110 49 50 47
1990 107 105 109 56 55 58
Hong Kong 1970 117 119 115 35 39 30
1980 107 108 105 64 63 65
1989 108 n.a. n.a. n.a. n.a. n.a.
Singapore 1970 . 106 110 102 46 47 45
1980 108 109 106 58 56 59
1990 108 110 107 70 70 71
Malaysia 1970 87 91 84 34 40 28
1980 95 96 95 49 50 47
1990 93 93 93 56 55 58
Thailand 1970 83 86 79 17 20 15
1980 99 100 97 29 30 28
1990 90 92 88 33 34 32
Philippines 1970 108 n.a. n.a. 46 n.a. n.a.
1980 111 112 110 64 59 69
1990 111 n.a. n.a. 73 n.a. n.a.
Indonesia 1970 77 83 71 15 20 10
1980 107 115 100 29 35 23
1990 116 119 114 45 49 41
Sources: UNESCO (1980 : Table 3.2); UNESCO (1993: Table 3.2)
Note : n.a. = not available
In the ASEAN-4 countries, the increase in female education between 1980 and
1990 was greater than in the East Asian NICs because in the latter, enrolment rates were
already high from the 1970s because o f heavy investment in education. Over the past two
decades, the increase in Indonesia was the highest within East and Southeast Asia.
Unlike in the East Asian NICs, sex differentials in education especially at the
secondary level, are still large in Indonesia. Research has found a tendency for poorer
families in Indonesia to favour boys in the allocation o f scarce family resources for
[image:30.509.37.439.81.490.2]level in Singapore and Malaysia suggests more modem attitudes o f parents toward
education for daughters in these countries. Educational policy in Singapore, which
promotes equal access to education for males and females, has led to improved skills and
employability among females, giving them access to professional and skilled and semi
skilled occupations (Mani, 1983; Smith and Cheung, 19S1).
2.1.3. Family size and structure
In developed countries, many studies have found a negative relationship between
fertility and female labour force participation rates (Sweet, 1973). Opportunity cost and
maternal role incompatibility are factors generally mentioned in explaining this
relationship. The number and ages o f children affect female labour force participation
(Standing, 1978). However, some argue that the research results are inconsistent (Lehrer
and Nerlove, 1986). Kupinsky (1977) argues that the direction can be reversed and
causation may be two-way. Employment may have a direct causal effect on women’s
fertility. The decision about when and whether to participate in the labour force, and
when to start childbearing are interrelated.
In developing countries, the relationship between fertility and female labour force
participation varies according to the socio-economic and cultural setting and the nature o f
job opportunities available to women. In the urban areas o f low-income countries, the
relationship is likely to be more varied depending on the nature of the labour market and
degree o f compatibility between work and child care (Jaffa and Azumi, 1960).
Family values and structure can influence women’s position in the labour market in
many ways. First, the family is a repository of values regarding whether women
(particularly married women) should work or not, and the kinds o f work considered
appropriate for them. Second, the participation of women in the labour market varies
according to their position within the household and the domestic cycle. As a result,
to productive resources (Mackintosh. 1981; Elson and Pearson, 1981).
Youssef (1974) explored the role of family structure in explaining variations in the
impact of economic development on female employment. She shows that later marriage
and cohabitation (lack of control over women through formal marriage) accounts for
higher female participation rates in Latin America than in the Middle East.
Jakarta as well as Bangkok, Hong Kong, Singapore, Bangkok have experienced
rapid fertility decline. This was achieved mainly through an increase in contraceptive
practice. Increased motivation for smaller families and higher age at first marriage in these
metropolitan areas was also related to increasing number o f women working outside the
home. Moreover, a decline in the fertility o f young women suggests a delay in the timing
o f first births that may be associated with higher educational levels o f women, which leads
to higher occupational status among employed women.
In Singapore, government policy has encouraged the provision o f alternative child
care facilities, such as the import o f foreign household maids and the establishment and
support of child care centres (Eng and Keong, 1988:378-379). Fiscal policy, in the form
o f tax concessions and tax allowances for better educated working mothers, is directed
toward encouraging this group of women to remain in the labour force after marriage and
childbearing. In Bangkok and Jakarta, the provision o f child care centres is limited. Many
working mothers in these metropolitan areas rely on family members and maids for
childcare.
2.1.4. Social values and discrimination
Women workers are often discriminated against because o f women’s primary'
responsibility for and identification with the reproductive role, which in effect results in
interruption in women’s working life as a result o f marriage and childbearing. Moreover,
because of the geographical mobility on the part o f the husband (Chiplin and Sloane,
19S0:286).
Employers thus tend not to hire women for or promote them to more important
jobs, and are reluctant to invest in skills training and upgrading for them. Women
employees are perceived as being both more costly (because of legislated maternity leave
and benefits) and less productive (because o f higher absenteeism and turnover rates) than
men, and their employment is additionally complicated by 'protective legislation’ which,
for example, in some countries, restricts their employment at night or in certain jobs, or
requires the provision o f monthly ‘menstruation leave’. Furthermore, employer
discrimination in hiring, promotion, training and development opportunities on the basis
o f sex is beyond the scope o f bargaining and negotiation o f trade unions. This situation is
further complicated by the fact of an 'economy where different foreign companies practise
different philosophies of employment over which unions have no say’ (Teo, 1986).
Women, on the other hand, responding to their limited employment opportunities
and expectation o f a short work-life, also tend to invest less in their own education and
training than men, and may be reluctant to accept promotions and more responsible jobs
which they feel may conflict with their reproductive role. Many women might prefer part-
time work as a means of accomodating the more important reproductive role. If they
work full-time, the additional demands o f the reproductive role may result in lower
productivity at the workplace.
For example, a survey among female Thai government employees revealed that
most o f them accepted the faster promotion of their male colleagues as ‘natural’ or even
'appropriate’. At the same time these women felt their own abilities were not properly
recognized by their superiors, colleagues and society, this is reflected in their low level of
surprising that high positions are awarded to men who have more positive expectations
from their work (Tonguthai, 1987:209).
Sex discrimination in job promotion even persists among civil servants in Thailand.
A study o f the employment structure and promotional opportunities among workers in the
Civil Seiwice Commission in Thailand found that although the female share of total
employment was around 60 per cent during the three-year period covered by the study,
the high level positions were dominated by males (Suwapan 1985:63-64 in Tonguthai,
1987:205).
Data for Singapore reveal that women are noticeably under-represented in the
upper echelons o f work in all sectors. Only 4 per cent o f managers, 22 per cent o f clerical
supervisors and 11 per cent of executive officers in 1983 were women (Eng and Keong,
1988).
According to interviews with management in a Thai textile factory, the division of
labour was created by the employers rather than by the employees. Prospective workers
do not apply for specific jobs, but rather for openings o f an unspecified nature.
Management then assigns the jobs on the basis o f sex. Management has the view that
women’s fingers are more nimble and their temperaments are more patient. Even the top
managers seem to fully accept these assumptions, along with the assumption that men are
more suited to heavy work. Moreover, they assume that men are more suited to be
technicians, although few male workers interviewed had any more training for this job
than the women (UN, ESCAP, 1987b:34-35).
Discrimination against women in the workplace may lead to the participation rates
o f women being lower than they would otherwise be, if they thought that better
opportunities were available to them. We don’t know whether discrimination has lessened
2.1.5. Urbanisation and migration
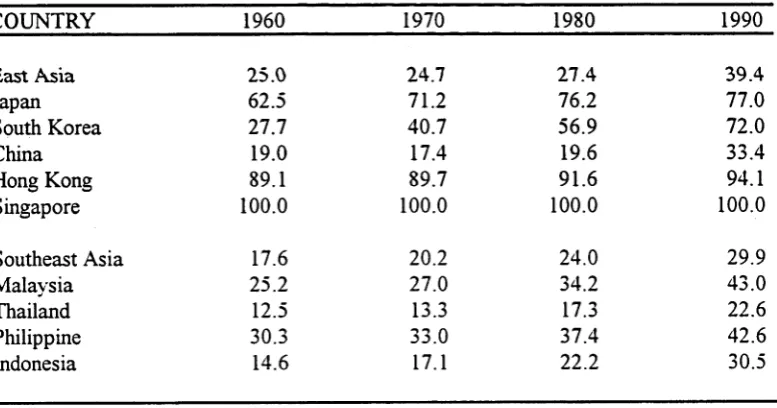
Table 2-7 shows the change in the level of urbanisation during the period 1960-90
in East and Southeast Asian countries. All countries had experienced a dramatic increase
in the proportion of population residing in urban areas. The level o f urbanisation in
Southeast Asia as a whole was below that in East Asia, although the increase in Southeast
Asia was slightly higher than in East Asia during the period. The increase was especially
great in Indonesia, the Philippines and Malaysia.
In all East Asian countries after 1980, urbanisation exceeded 50 per cent, except
China (Table 2-7). The increase was especially spectacular in South Korea, which
recorded a dramatic increase from 27.7 per cent in 1960 to 72.0 per cent in 1990, which
suggests reclassification o f urban areas may have also been important.
Table 2-7. Level of urbanisation, East and Southeast Asian countries, 1960-90 (per cent)
COUNTRY 1960 1970 1980 1990
East Asia 25.0 24.7 27.4 39.4
Japan 62.5 71.2 76.2 77.0
South Korea 27.7 40.7 56.9 72.0
China 19.0 17.4 19.6 33.4
Hong Kong 89.1 89.7 91.6 94.1
Singapore 100.0 100.0 100.0 100.0
Southeast Asia 17.6 20.2 24.0 29.9
Malaysia 25.2 27.0 34.2 43.0
Thailand 12.5 13.3 17.3 22.6
Philippine 30.3 33.0 37.4 42.6
Indonesia 14.6 17.1 22.2 30.5
Source: United Nations (1992)
Internal migration has played an important role in the growth o f urban population,
especially in the ASEAN countries, partly because o f declining rates o f natural increase in
urban areas (Ogawa, 1985). One o f the main factors in the decline o f urban fertility is to
women’s higher education. The development of both communications and transportation
[image:35.509.46.435.397.601.2]As urban areas grew larger in East and Southeast Asia, increasing numbers of
females moved to urban areas to seek employment. Those who were better-educated
sought employment in the modern sector, while those who could not be absorbed in the
limited modern sector were absorbed in the informal sector, which grew rapidly with
urbanisation.
The migration o f labour from rural to urban areas has been an important aspect of
industrialisation in the last two decades for the cities o f East and Southeast Asian
countries (Lim, 1993a; Lim, 1993b:211). The role played by women in urban areas is
significant and has become increasingly important, in Hong Kong and Singapore, which
do not have a domestic rural hinterland to draw on, industrialisation has been supported
by the importation o f both male and female labour from abroad. Unlike in South Asia
where female migrants are usually dependents and thus, tend to be older and married,
female migrants in Southeast Asian countries tend to be young and single (Smith, Khoo,
and Go, 1984).
The pattern o f female migration changes as the economy o f a country develops.
As noted earlier, domestic service, which is a major occupation in urban areas during the
early stages o f development, declines in importance in some countries as the economy
develops. This was the case in European countries in the twentieth century (Ebery and
Preston, 1976 in Jones, 1993b:331) as well as in Latin American countries and in cities of
the East Asian NICs during the 1970s.
As East and Southeast Asian countries adopted labour intensive export-oriented
strategies and created employment opportunities favouring females, many young and
single women migrated independently to earn a living in urban areas. It has been
suggested that female migrants from rural areas are more likely to be hired by
working conditions: thus, they are likely to be more passive and less demanding (Salih et
al., 1985 in Lim, 1993b:212).
Female migration in Southeast Asia was also stimulated by the rapid expansion of
the public sector during the 1970s. Many job opportunities in the civil service were
opened up to women. Given goals of equal educational opportunities for women and
integrating women into development, governments set an example by expanding the
female share of public sector employment (Standing, 1989:1087). Since public sector jobs
tend to require more educated people concentrated in capital cities, their expansion
stimulated migration from urban to urban areas rather than rural to urban areas.
Women were able to respond to the growth o f employment opportunities through
autonomous migration because strong institutional and sociocultural barriers to female
labour force participation weakened and demographic trends, together with educational
gains, ensured an ample supply o f qualified female labour (Eisold, 1984; Jones, 1984;
Khoo, 1987; Lim, 1988). It has been suggested that in Indonesia, exposure to the mass
media and the transportation revolution have reshaped the roles and status of women and
increased the propensity o f rural women to move (Hugo, 1992:187).
Where push factors dominate, female out-migration is more likely from areas
where men control agricultural resources and production or where women have been
displaced by agricultural mechanization and the decline o f cottage industries (Sassen-
Koob, 1984; Young, 1982). In Thailand, many young women from rural areas migrate to
cities to find work because o f the increasing difficulties o f making a living from
agriculture. Environmental degradation, droughts and other problems related to climate,
together with the relative neglect o f agriculture by the Government and the lack o f
employment alternatives for women, also pushed rural Thai women into migration to the
city. In Java, the introduction o f mechanization in rice milling in the early 1970s displaced
1981). Other innovations in the planting, growing and harvesting of rice have also had
major labour displacement effects impinging disproportionately upon rural Javanese
women (Sajogyo, 1985.160, 163).
Since the 1980s, the international migration o f women from Indonesia and
Thailand seeking employment, particularly in domestic service, has increased. The
economic pressures on many poor families, higher wages overseas, and a rise in
expectations are among the explanations o f this phenomenon. Indonesia sends
considerable numbers of women to work abroad, although many going illegally to
Malaysia are not recorded in official data (Hugo, 1993). The female selectivity of official
contract migration has risen significantly in Indonesia: in 1983 men outnumbered women
by 1.4 to 1; but by 1988 there were 3.4 female migrants for every male migrant. Most
female Indonesian migrants work in Saudi Arabia. In contrast, Thai overseas labour
migration is still heavily male dominated (Lim, 1993a: 193).
Singapore and Hong Kong have traditionally been major importers o f both male
and female labour. In Singapore, female contract labour was mainly from Malaysia and
filled the needs o f the manufacturing and retail sectors. The men worked in construction
and shipbuilding. Migrant labour has played an important role in the Singapore success
story. Hong Kong has also imported large numbers o f domestic servants, mainly from
Philippines and Thailand (Lim, 1993a: 193) and at certain times, illegal migrants from
China.
2.2. Changes in female labour force participation rates
2.2.1. Levels and trends of female labour force participation rates
In the earlier section, it was shown that the more developed East Asian countries
had higher economic growth than the ASEAN-4 countries. Therefore, I would expect