This is a repository copy of Can national management measures achieve good status across international boundaries? : a case study of the Bay of Biscay and Iberian coast sub-region.
White Rose Research Online URL for this paper: http://eprints.whiterose.ac.uk/129429/
Version: Accepted Version
Article:
Cavallo, Marianna, Elliott, Mike, Quintino, Victor et al. (1 more author) (2018) Can national management measures achieve good status across international boundaries? : a case study of the Bay of Biscay and Iberian coast sub-region. Ocean & coastal management. pp. 93-102. ISSN 0964-5691
https://doi.org/10.1016/j.ocecoaman.2018.04.005
eprints@whiterose.ac.uk https://eprints.whiterose.ac.uk/ Reuse
This article is distributed under the terms of the Creative Commons Attribution-NonCommercial-NoDerivs (CC BY-NC-ND) licence. This licence only allows you to download this work and share it with others as long as you credit the authors, but you can’t change the article in any way or use it commercially. More
information and the full terms of the licence here: https://creativecommons.org/licenses/
Takedown
If you consider content in White Rose Research Online to be in breach of UK law, please notify us by
1
2
3
4
Can national management measures achieve good status
5across international boundaries? - a case study of the Bay of
6Biscay and Iberian coast sub-region
78
Authors: Marianna Cavallo*a, b, c, d, Michael Elliottb, Victor Quintinoc, Julia Touzad. 9
10
a
Department of Applied Economics, University of Vigo, Vigo 36310, Spain
11
b
Institute of Estuarine & Coastal Studies (IECS), University of Hull, Hull HU67RX, UK
12
c
Department of Biology & CESAM, University of Aveiro, 3810-193 Aveiro, Portugal
13
d
Environment Department, Wentworth Way, University of York, Heslington, York YO105NG, UK
14
*Corresponding author: Marianna Cavallo, e-mail: cavallom16@gmail.com; [+39 3408549826
15
16
Abstract
17
Coastal countries have historically implemented management measures to improve the status of 18
their national marine waters and little effort has been made to take coordinated actions to improve 19
the status of the entire region or sub-region of which they are part. At the European level, the 20
adoption of the Marine Strategy Framework Directive (MSFD) aims to remedy this deficiency and 21
to promote coordination among countries and an integrated management of the marine 22
environment. The MSFD requires each country to propose and adopt a programme of measures to 23
achieve Good Environmental Status of the regional seas. This study compares the programmes of 24
measures of the three countries of the Bay of Biscay and Iberian coast sub-region Ð France, Portugal 25
and Spain Ð presenting a novel use of multivariate analyses using semi-quantitative policy 26
information. Among the four North-East Atlantic sub-regions, this study area was chosen because it 27
showed the lowest levels of coherence during the first phase of the implementation of the MSFD, 28
according to the European Commission assessment. The results show the differences among the 29
three programmes, confirming the difficulties that neighbouring countries face when they are 30
required to adopt common approaches in the implementation of this multi-sectoral Directive. Most 31
range of actions, covering different pressures and different species/habitats. The integration with 33
other legislation is more similar between Spain and France and differs between these and Portugal. 34
The three countries also recognise the lack of knowledge to perform the economic analysis, in 35
particular in quantifying the costs of and social benefits derived from their measures. It is concluded 36
here that a better use of the regional and European coordination structures is needed to fill the gaps 37
in knowledge and to exchange good practices. More political will is necessary to take action at 38
European and international level to mitigate the impact of those socio-economic activities through 39
joint programmes, for which Community funding is available. 40
41
Keywords: Marine Strategy Framework Directive, management measures, regional coordination, 42
marine policy coherence 43
45
1. Introduction
46
The European Union (EU) has played a central role in the field of sustainable development in recent 47
decades with the adoption of more than 200 environmental directives and regulations (Beunen et al., 48
2009; Boyes and Elliott, 2014). In many cases, these statutes were produced historically in a 49
sectoral and uncoordinated manner and so, in 2007, the European Commission (EC) proposed the 50
Integrated Maritime Policy to improve synergies among sectoral maritime policies (Bagagli, 2015). 51
The Marine Strategy Framework Directive (MSFD; EC, 2008) is an important component of the 52
Integrated Maritime Policy and has been adopted to achieve an integrated approach in the 53
exploitation of marine resources and protection of ecosystems, coordinating between EU Member 54
States at the level of region and sub-region. The framework has been transposed into national 55
legislation by specific strategies which started with an initial assessment of the characteristics of 56
marine waters, including a detailed study of the main pressures and impacts and an economic and 57
social analysis. On the basis of such an assessment, Member States defined what they consider 58
Good Environmental Status (GES) and established a set of targets to achieve it. In 2014, monitoring 59
programmes were established to assess the progress towards GES and, two years later, national 60
programmes of measures (PoM) were published to achieve or maintain GES. These phases will be 61
updated during the second cycle starting in 2018. 62
Management measures are actions to control the marine activities and prevent state changes and 63
impacts on human welfare (Elliott et al., 2017) and, to be successful, these should be focused on the 64
so-called 10-tenets, namely to be ecologically sustainable, economically viable, technologically 65
feasible, socially desirable or tolerable, morally correct, legally permissible, administratively 66
achievable, politically expedient, culturally inclusive and effectively communicable (Elliott, 2013). 67
This paper compares the PoM of the three countries bordering the Bay of Biscay and Iberian coast 68
sub-region Ð France, Portugal and Spain Ð to identify the main differences in the reporting, number 69
of human pressures addressed, spatial coverage (national, regional and European), economic 70
analysis and integration with other policies. This sub-region was chosen as it presented very low 71
levels of coherence during the first phase of the MSFD, especially when setting targets and 72
definition of GES (EC, 2014b; Cavallo et al., 2016). 73
74
1.1 Requirements of the Programmes of Measures (PoM) 75
To improve coherence and comparability among national PoM at European level, the EC developed 76
non-legally binding recommendations to be considered by all Member States when preparing their 77
complements that of the EC, to guide countries of the North-East Atlantic towards a more 79
coordinated development of their programmes in line with OSPAR work and existing measures. 80
National reports should indicate the link between the proposed measures and the established 81
environmental targets, one or several qualitative descriptors, pressures and expected effect (EC, 82
2014a). Moreover, Article 13 and Article 5(2) of the Directive require Member States to ensure that 83
their PoM are coherent and coordinated across the marine region or sub-region concerned. The 84
RSC, such as OSPAR, play a key role in coordinating measures, mainly as a platform to exchange 85
information and by developing measures at regional level focused on transboundary issues. Hence, 86
a regional approach under the guidance of RSC should be used to manage the marine environment 87
and to mitigate the impact of those pressures that transcend national borders (e.g. chemical 88
contamination and nutrient enrichment, litter, invasive species, underwater noise) and Member 89
States have to indicate the level of implementation of their measures (national, regional, 90
EU/international) and their effects, positive or negative, at supra-national scale (EC, 2014a). 91
National PoM should include existing measures from other national, EU and international 92
legislative instruments, and new measures, when existing ones are not sufficient to meet the 93
environmental targets and GES. New measures can be identified through consultation with 94
stakeholders, the scientific community, other Member States, and from RSC, or they can even 95
expand or reinforce existing measures (EC, 2014a). Both EC and OSPAR guidelines provide a 96
comprehensive list of policies and agreements that can be integrated within the scope of the MSFD 97
(see also Boyes et al., 2016). For example, the Water Framework Directive (WFD) and the MSFD 98
have several aspects in common and a geographical overlap for the coastal area (Borja et al., 2010). 99
The first cycle of the MSFD is being implemented simultaneously with the second cycle of the 100
WFD and PoM had to be adopted for both directives by December 2015 with the existing WFD 101
PoM being updated while MSFD PoM are developed for the first time (EC, 2014a). In both 102
directives, the measures have to be aggregated under a predefined set of Key Type Measures (e.g. 103
KTM 29 - Measures to reduce litter in the marine environment) (EC, 2014a) and, considering that 104
many of the pressures on the EU seas are land-based, most of the WFD KTM need to be included in 105
the MSFD PoM to achieve or maintain GES and to enable an integrated approach between policies 106
(the complete list of KTM is presented in the Appendix). 107
Member States are also required to carry out an impact assessment of their measures, including a 108
Cost-Effectiveness Analysis (CEA) and Cost-Benefit Analysis (CBA). CEA aims to identify the 109
Ôleast-cost approachÕ among a number of measures designed to meet the same objective. A CBA 110
evaluates and compares the present value of social benefits and costs of a measure or policy 111
and Rehdanz, 2013; Bertram et al., 2014; Bšrger et al., 2016) and limitation of the MSFD economic 113
analysis (Oinonenetal et al., 2016). 114
The CEA and CBA are required for new measures and, when needed, these analyses should be 115
conducted at regional and sub-regional level (EC, 2014a). The EC recommendation document 116
recognises that a limited knowledge of the functioning of marine ecosystems complicates the 117
assessment of the effects of policy measures on ecosystem services flow and the quantification of 118
the impacts that these have on human well-being (EC, 2014a). 119
The MSFD text also requires Member States to identify clearly any instances or exceptions in their 120
PoM within their marine waters where the GES cannot be achieved (Article 14) or when actions at 121
EU and international level are necessary to address environmental issues through joint programmes 122
(Article 15). There can be some situations where Member States are not required to take specific 123
steps (Long, 2011; Boyes et al., 2015; Elliott et al., 2015; Saul et al., 2016). For example, 124
Òprovision should be made where it is impossible for a Member State to meet its environmental 125
targets because of action or inaction for which it is not responsible, (É) or because of actions which 126
that Member State has itself taken for reasons of overriding public interest which outweigh the 127
negative impact on the environment (É)Ó (Article 14). 128
129
2. Methodology
130
The PoM of Spain and France were published on the EIONET web page1 (MAGRAMA, 2015; 131
Minist•re de lÕEnvironnement, de lÕƒnergie et de la Mer, 2016a; 2016b). The PoM of Portugal 132
consisted of two reports published in the DGRM web page2 (MAM, SRMCT, SRA, 2014). The 133
comparative analysis of national reports focused on the requirements described in the previous 134
section, namely: the type of GES descriptors or groups of descriptors (e.g. Descriptor D2-Non-135
indigenous species), associated KTM, level of implementation (e.g. national, (sub)regional, EU and 136
international), effect at supra-national scale, integration with other EU and international legislation, 137
CBA and CEA. For this study, measures were arranged into six categories relating to particular 138
MSFD Descriptors: Biodiversity (D1, D4, D6), Non-indigenous species (D2), Commercial fish and 139
shellfish (D3), Introduction of nutrients/contaminants (D5, D8, D9), Marine litter (D10) and Other 140
measures, covering Hydrological conditions (D7), the Introduction of Energy (D11) and Transverse 141
measures. Transverse or horizontal measures are considered by the three countries to include 142
1
http://rod.eionet.europa.eu/obligations/612/deliveries?id=612&id=612&tab=deliveries&tab=deliveries&d‐4014547‐ p=1&d‐4014547‐o=1&d‐4014547‐s=1
2
legislative barriers, financial and methodological support, innovation, social and economic aspects, 143
employment, training and others but were not included in the statistical analysis since they cover all 144
descriptors and integrate mostly national legislation. For each category of descriptors, the measures 145
were classified by key type (KTM). 146
In order to analyse how the three countries integrated existing policies in their PoM, a data matrix 147
was prepared using the S¿rensen similarity coefficient considering as samples the categories of 148
descriptors per country and as variables the pieces of legislation (presence-absence data). This 149
similarity matrix was viewed in a 2-dimensional ordination diagram obtained by non-metric 150
multidimensional scaling (nMDS) and submitted to hypothesis testing under the null hypothesis of 151
no significant difference among the countries, using Analysis of Similarities (ANOSIM). ANOSIM 152
produces the statistic R, varying from -1 to +1. R is equal to +1 when all the categories of 153
descriptors from one country are more similar to each other than to any from another country, 154
rejecting the null hypothesis. R approaches 0 when the null hypothesis is true, and significance is 155
assessed by calculating the probability of the observed R within a series of R values obtained by 156
permutation (Clarke, 1993). The nMDS diagram is accompanied by a stress value quantifying the 157
mismatch between the distances among samples measured in the 2-dimensions ordination diagram 158
and in the resemblance matrix. Empirical studies have shown that stress values below 0.1 indicate a 159
good to very good representation of the samples and below 0.2 still corresponds to a useful 2-160
dimensions representation. All multivariate analyses were performed with PRIMER v7 (Clarke and 161
Gorley, 2015). 162
163
3. Results
164
3.1 Coherence in the information reported 165
The three programmes differ in the type of recommendations provided, the number of measures 166
proposed for each descriptor and in the way each measure is presented (Table 1). For example, the 167
Portuguese programme lacks relevant information and does not indicate the exact number of 168
measures, if and when the consultation with other Member States took place and the descriptor/s, 169
the spatial coverage, the KTM and the targets associated with each existing measure. The three 170
countries mention the EC recommendations, while France and Spain also consider the OSPAR 171
recommendations. None of the countries referred to exceptions under Article 14 and Article 15. 172
173
Table 1
174
List of the requirements provided in the PoM of France, Portugal and Spain in the Bay of Biscay and Iberian Coast 175
sub-region. 176
Year of publication 2016 2014 2016
Public consultation (national) Yes Yes Yes
Consultation with other countries Yes No Yes
Number of measures in the sub-region 121 (12 new) 85 approx. (11
new)
319 (79 new)
Number of measures per category: Biodiversity (D1, D4, D6)
Non-indigenous species (D2), Commercial fish and shellfish (D3)
Introduction of nutrients/contaminants (D5, D8, D9) Marine litter (D10)
Other measures (D7, D11) Transverse (all descriptors)
37 8 14 36 16 18 17
19 5 23 13 6 4 3
176 26 57 67 63 24 22
Descriptor Yes Yes * Yes
Integration with other policies Yes Yes Yes
Number of Spatial Protection Measures 7 1 31
Indication of the level of implementation Yes* Yes* Yes
Number of measures with effect at supra-national scale 39 0 50
KTMs (Key Types of Measures) Yes Yes* Yes
CBA and CEA Yes** Yes *** Yes*
*information provided mostly for new measures; ** CEA only; *** one measure
177
178 179
3.2 Coordination among the three national PoM 180
There are differences in the scope of the three programmes and their contribution to improve the 181
environmental quality of the sub-region taking into consideration the following aspects for each 182
category: KTM, level of implementation (e.g. national, (sub)regional, EU and international), 183
expected effect at supra-national scale and spatial protection measures (if any). 184
185
3.2.1 Biodiversity 186
This category includes measures covering at least one of these MSFD descriptors, D1-Biodiversity, 187
D4-Foodweb and D6-Seafloor integrity, but they are often associated with other descriptors since 188
all the actions will contribute, directly or indirectly, to achieving GES for marine biodiversity. The 189
details and information provided in each PoM vary among the three countries (Table 1 and 2). 190
Spatial Protection measures were also included in this group, which, in some cases, involve the 191
creation of new protected areas or the expansion of existing ones. 192
193
Table 2
194
Biodiversity related measures and their spatial application. In brackets is given the number of measures proposed. 195
Country KTM Level coordination in
implementation
France 5 (5) 14 (1) 27 (14) 35 (5) 37 (3) 38 (7) other (5)
Sub-regional (8) (8)
Portugal 37 (2)
38 (1) Other (2)
KTM not provided in many cases
All national/local not specified for any
measure
Spain 14 (14)
20 (25) 27 (2) 35 (23) 37 (53) 38 (31) 39 (4) other (27)
regional (42)
EU/International (21)
(24)
196
197
At the level of the sub-region, most of the measures are focused Ôon the restoration/conservation of 198
marine ecosystems, habitats and speciesÕ (KTM 37) (Table 2), but with differences in the level of 199
detail. For example, Portugal presents 2 new measures which generically refer to the protection of 200
seabirds and sea mammals in national waters, while Spain reports 24 measures where the name of 201
the species and habitats is clearly indicated, together with the related conventions, mainly OSPAR. 202
Another 28 measures are identified in the sub-region to Ôreduce biological disturbance in the 203
marine environment from the extraction of speciesÕ (KTM 35). Broader measures are presented in 204
the French reports (e.g. framework for the reduction of by-catch), while Spain is more specific in 205
reporting 12 new measures to address this issue, e.g. risk assessment of the accidental catch of 206
protected turtles, cetaceans and seabirds and elasmobranchs. Moreover, the existing measures 207
included in the Spanish PoM consider six recommendations of the International Commission for the 208
Conservation of Atlantic Tunas (ICCAT), to reduce the by-catching of turtles and birds. France and 209
Spain present new and existing measures on Ôresearch, improvement of knowledge base reducing 210
uncertaintyÕ (KTM 14). In particular, Spain describes one measure to promote studies aimed at 211
improving the knowledge on species, habitats and the human impacts on marine biodiversity. 212
The measures vary not only in the details provided but also in their focus. For instance, France 213
mostly focuses on Ôregulating dredging activities and sediment managementÕ (KTM 27) with 14 214
measures (only 2 from Spain and none from Portugal) while Spain presents 25 measures to 215
Among the 232 measures established in the sub-region for the three biodiversity descriptors, Spain 217
specifies that 63 require regional and/or international/EU coordination, France indicates that 8 218
measures require coordination at level of sub-region and Portugal indicates none (with all measures 219
recognised to require only national or local coordination). 220
France and Spain identify the measures (respectively 8 and 24) that should have a positive impact in 221
the waters beyond national borders. Most of them aim to reduce the impact of fisheries or consider 222
the benefits of Spatial Protection measures (Table 2). 223
The three countries describe measures related to the creation or expansion of protected areas (KTM 224
38 - Spatial Protection Measures for the marine environment) and more recently these have been 225
termed Maritime Spatial Planning and are the subject of a recent EU Directive (MSPD, 226
2014/89/EU). In particular, Portugal introduces a new measure to expand the network of Marine 227
Protected Areas (MPA) covering high sea habitats mainly (OSPAR seamounts) in line with the 228
targets of Natura 2000 and the UN Convention on Biological Diversity. France presents seven 229
existing spatial protection measures in its programme, considering them sufficient to meet the GES 230
under the MSFD. These include, for example, the creation and management of MPAs under 231
national legislation, to complement the offshore Natura 2000 network to protect mammals (great 232
dolphin and harbour porpoise), birds and reefs. Spain includes 31 new and existing spatial 233
protection measures in its programme, including the proposal for the creation of new MPAs and 234
several specific regulations to manage human activities (professional fishery, scientific research, 235
aquaculture, mammal observation, material extraction). 236
The OSPAR recommendation document provides a list of species/habitats to guide its EU 237
contracting parties towards a coherent development and implementation of management measures. 238
This presents 44 species/habitats that occur in the Bay of Biscay and Iberian coast sub-region, 239
including invertebrates, birds, fish, reptiles and mammals, mostly highly mobile species (Table 3). 240
Among the three countries, Spain reports on specific (existing) measures which refer to these 241
species while France makes a more generic reference to the red list of species of IUCN and 242
OSPAR. 243
[image:10.595.69.535.692.790.2]
244
Table 3
245
The OSPAR list of species/habitats that occur in the Bay of Biscay-Iberian Coast sub-region (region IV according to 246
OSPAR regional classification) 247
Category (total number)* Species/habitat mentioned in the three PoM Country
Invertebrates (3) None (explicitly mentioned) -
Birds (4) Balearic shearwater
Roseate tern Iberian guillemot
PT, ES ES FR, ES
Fish (19) Sturgeon
Allis shad European eel
Portuguese dogfish Leafscale gulper shark Basking shark Cod
Long-snouted seahorse Short-snouted seahorse Sea lamprey
North-East Atlantic spurdog Angel shark ES ES ES FR ES ES ES ES ES
Reptiles (2) Loggerhead turtle
Leatherback
FR, PT, FR, PT, ES
Mammals (3) Blue whale
Northern right whale Harbour porpoise
PT, ES ES FR, PT
Habitats (12) Coral gardens
Cymodocea meadows
Deep-sea sponge aggregations
Lophelia pertusa reefs
Maerl beds
Modiolus modiolus beds
Ostrea edulis beds
Seamounts
Zostera beds
ES ES PT, ES ES FR, ES ES FR PT, ES FR, ES
* OSPAR (2015)
248
Abbreviations: FR: France, PT: Portugal, ES: Spain
249 250
3.2.2 Non-indigenous species 251
Nearly 40 measures are described by the three countries to address the impact of invasive species 252
(Table 1), of which 18 are exclusive to this descriptor and the remaining ones are associated with 253
other descriptors (mainly biodiversity). Most of the measures aim Ôto reduce the introduction and 254
spread of non-indigenous species in the marine environment and for their controlÕ (KTM 34). 255
France and Spain include some actions to prevent new introductions by the early detection, and 256
eradication. Portugal does not report specific measures for this descriptor and this pressure is 257
mainly addressed by measures covering all descriptors. 258
The level of coordination to implement such measures is mainly national and only Spain describes 259
measures that require regional and EU/international coordination (4 in total). Six measures are 260
expected to have a positive effect beyond national waters. 261
262
3.2.3 Commercial fish and shellfish 263
A total of 94 measures are described in the sub-region, 14 of which exclusive to this descriptor 264
(D4), while most are also associated with biodiversity descriptors. It was not possible to establish 265
the exact number of measures of Portugal for this descriptor (approx. 20) and the KTM is specified 266
for 3 measures (which refers to ÔKTM 39 - Other measuresÕ). France and Spain present 10 and 12 267
measures respectively Ôto reduce biological disturbance in the marine environment from the 268
include a new certification system for fisheries products and the development of new practices for 270
commercial fisheries to limit their impacts on marine ecosystems. Two new measures are presented 271
by Spain: ÒPermanent cessation of the activity of 569 fishing boats in the period 2016-2020Ó and 272
Ònational funding for a temporary stop to fishingÓ. Some measures from Portugal also aim to 273
reduce and readjust the fisheries pressures. Only Spain includes 24 existing measures Ôto 274
prevent/control the adverse impacts of fishing and other exploitation/removal of animal and plantsÕ 275
(KTM 20). Most of the measures are in line with OSPAR requirements, covering particular species 276
(e.g. Red tuna, some sharks). Portugal also describes in detail actions to recover the population of 277
sardine and hake (according to ICES recommendations). 278
All French and Portuguese measures require national coordination, while Spain specifies that 16 279
measures require an international/EU and regional level of coordination. France and Spain consider 280
that 14 of their measures should have a positive impact at supra-national level. 281
282
3.2.4. Introduction of nutrients and contaminants 283
A total of 116 measures were identified, covering the three descriptors. In particular, 4 exclusively 284
address Eutrophication (D5), 27 Contaminants (D8) and 4 Contaminants in seafood (D9). These are 285
grouped into 24 types of KTMs, including Ôconstruction or upgrades of wastewater treatment 286
plantsÕ (KTM 1), Ôreduce nutrients and pesticides pollution from agricultureÕ (KTM 2 and 3), and 287
Ôphasing-out or reduction of emissions, discharges and losses of priority (hazardous) substancesÕ 288
(KTM 15). France and Spain also respectively propose 15 and 10 measures Ôto reduce 289
contamination by hazardous substances in the marine environment from sea- and air- based 290
sourcesÕ (KTM 31) and another 14 each Ôto reduce sea-based accidental pollutionÕ (KTM 32). 291
The level of coordination is mainly at national and/or local levels. Spain implements 16 measures at 292
regional level (i.e. supra-national) with reference to OSPAR in many cases, and France indicates 293
one measure requiring sub-regional implementation. Eleven measures are considered to have an 294
effect at supra-national level, mostly related with the pollution caused by maritime activities and 295
port operation. 296
297
3.2.5. Marine litter 298
Of the 85 measures addressing contamination by litter, 58 are exclusive for this descriptor and the 299
others are linked with descriptors addressing contamination and biodiversity. The three countries 300
present measures on Ôresearch, improvement of knowledge base reducing uncertaintyÕ (KTM 14) on 301
litter. In particular, Portugal includes two new measures; one aims to develop a database to 302
origin). This agrees with OSPAR requirements and is the basis of litter data collection. Another 304
measure aims to determine bioindicators of litter, including litter content in fish and birds. Portugal 305
also has developed a measure for the collection and management of litter in ports and to 306
reduce/prevent the illegal discharges of contaminants (solid and liquid) in the ocean. Spain has 307
developed similar measures to improve knowledge of occurrence, specifically for microplastics. 308
Spain and France describe Ôspecific actions to reduce litterÕ (KTM 29), respectively 48 and 11, 309
although the strategies differ between the two countries. While France places more effort on 310
promoting the responsible management of litter waste from fisheries and aquaculture (nets and 311
shellfish), on mitigating the effects of dredging operations and another measure on regulating 312
shipping recycling, Spain reports several actions to reduce litter from fisheries and aquaculture, 313
namely the improvement of port structures for the reception and management of litter. Spain has 314
also developed new measures aimed at cleaning and surveillance of beaches and the seabed 315
(including the project Fishing for Litter), at reducing the production of plastic and microplastic 316
from source and new sanctions for abandoning and release of solid waste. 317
Spain has 14 measures addressing marine litter requiring international and regional coordination 318
while France has one measure requiring sub-regional implementation. The other measures of the 319
two countries and all the measures of Portugal have national or local level implementation. The 320
actions requiring regional implementation include Fishing for Litter initiative, the creation of 321
Ôbeach guardiansÕ and the OSPAR regional Action Plan for the prevention and management of 322
marine litter in the North-East Atlantic. Spain and France specify that 25 of their measures should 323
have a positive effect at supra-national level. 324
325
3.2.6. Other measures 326
Other measures (46) are described to address the changes in Hydrological conditions (D7) and the 327
Introduction of energy (D11). Nine of them are exclusive to D7 and seven to D11 and the remaining 328
ones include also biodiversity and eutrophication/contaminants descriptors. The KTM of Spain and 329
France are mainly focused on Ôreducing the inputs of energy, including underwater noise, to the 330
marine environmentÕ (KTM 28) and aimed at Ôresearch, improvement of knowledge base reducing 331
uncertaintyÕ (KTM 14) on underwater noise. For descriptors D7 and D11, 5 measures require a 332
regional implementation (mainly related with the OSPAR recommendations) and 3 might have a 333
positive effect at supra-national level. The implementation level of transverse measures is in 4 cases 334
at the EU/regional level and in 10 cases they are aimed at a positive effect at the supra-national 335
level. 336
3.3 Economic analysis 338
The economic evaluation of national PoM varied greatly across the sub-region. Portugal reports the 339
output of a CBA in a qualitative manner for a single measure (and has no CEA), ÔEstablishing 340
Marine Protected Areas in the Portuguese marine watersÕ, admitting that there is poor current 341
scientific knowledge about the deep sea ecosystems and the biophysical changes due to human 342
activities. These make it unable to assess the economic value of the trade-offs between different 343
ecosystem services which can be influenced by the establishment of oceanic MPA. 344
In contrast, France presents only the CEA for new measures and, even in this case, the lack of 345
scientific knowledge on the social costs associated with their implementation means that this 346
analysis is again mainly qualitative. For example, for the measure Ôto improve National Coherence 347
in the Regulation of Recreational FishingÕ, the CEA limits state that Òthere will be a low cost of 348
implementation and a potentially high effectivenessÓ. In general, all new actions reported by France 349
are considered to be cost-effective, with a focus on the financial costs of the implementation but 350
ignoring the external cost associated with environmental consequences of the measures. 351
Spain presents more detailed CBA and CEA for all new measures, but the analysis is again 352
qualitative, with a focus on financial implications, and neglecting the wider social impacts due to 353
their effects on marine and coastal ecosystem services. The costs and benefits of each measure are 354
based on expert judgement. For example, the average cost of measures addressing biodiversity is 355
considered low, while their level of effectiveness is considered from moderate to high. The benefits 356
for nine economic sectors considered to be affected by biodiversity related measures are stated to be 357
very low, except for the tourism sector. The analysis therefore focuses on the recreational benefits, 358
but ignores the contribution of biodiversity to support provisioning, regulating and other (non-359
recreational) cultural ecosystem services. Moreover, the cost of measures adopted to reduce the 360
impact of a fishery is considered moderate to high, where four of them have a very high cost 361
(corresponding to investments of more than 2 million euros). Their effectiveness is considered 362
moderate or high, with three measures assessed to have a very high effectiveness (those concerning 363
the ceasing/temporary halt to fishing). In general, this group of measures is considered cost-364
effective and, since social benefits are neglected, market-based benefits for the economic sectors are 365
considered very low. 366
367
3.4. Integration with relevant legislation 368
The three countries report on the relevant policies, agreements and conventions associated with new 369
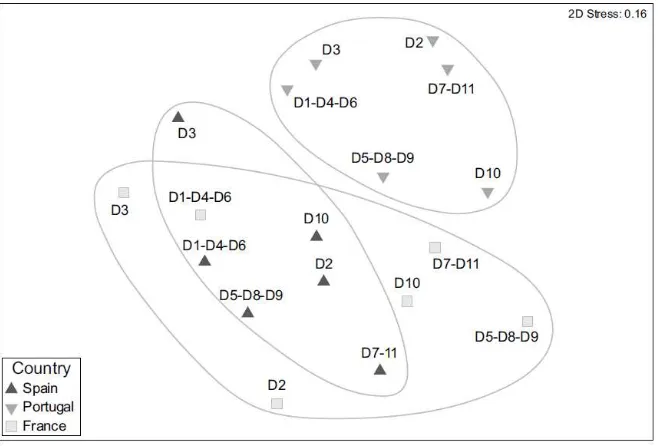
and existing measures. Figure 1 shows an ordination analysis of the various categories of 370
372
[image:15.595.135.464.92.315.2]373
Figure 1
374
Two-dimensional nMDS showing the distribution of the categories of descriptors per country. The greater the distance
375
among the same category (e.g. D10 Ð Litter), the less agreement there is among the pieces of legislation mentioned by
376
each country. The circles around each country were drawn by hand to highlight the higher similarity between France
377
and Spain and their separation from Portugal.
378 379
Portugal lists approximately 20 pieces of legislation and agreements in its PoM which are repeated 380
among groups of descriptors (mainly OSPAR and Common Fisheries Policy) while Spain and 381
France integrate approximately 50 different instruments each. In the ordination analysis, Portuguese 382
measures are grouped, while those of Spain and France overlap. In agreement, ANOSIM rejected 383
the null hypothesis of no significant differences in the type of legislation integrated for each 384
category of descriptors by the three countries (p-value <0.01). The pairwise comparisons indicate 385
no statistical significant difference between Spain and France, whereas both differ significantly 386
from Portugal (p-value <0.01) (Table 4). 387
388
Table 4
389
ANOSIM global test and pairwise comparisons R Ðvalues with associated significance testing the null hypothesis of no 390
difference among the countries in respect to the pieces of legislations mentioned in their PoM. 391
Type of test R-value P value
Global Test 0.423 < 0.0003
Pairwise tests among groups:
Spain, Portugal 0.639 0.002
Spain, France 0.089 0.199(ns)
Portugal, France 0.511 0.002
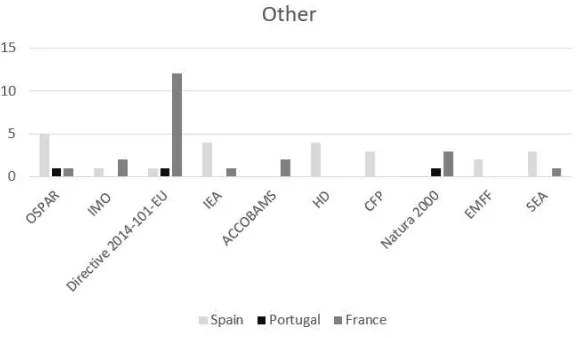
[image:15.595.172.425.630.735.2]For the biodiversity descriptors, the OSPAR, Common Fisheries Policy and the Habitats Directive-393
Birds Directive-Natura 2000 Directives are the most cited by the three countries but with 394
differences in the number of measures (e.g. Spain integrated OSPAR work in 41 measures while 395
Portugal and France mentioned OSPAR in two) (Figure 2). Other legislation related to the 396
protection of biodiversity is rarely mentioned despite its important role, e.g. the United Nation 397
Convention on Biological Diversity (7 measures of Spain and France), the Bern Convention (3 398
measures of Spain) and the EU Biodiversity Strategy (3 measures of Spain and France). 399
400
401
403
404
406
[image:18.595.60.351.76.245.2]
407
Figure 2
408
Main pieces of legislation integrated in the three PoM for each category of descriptors.
409
Abbreviations: ACAP: Agreement on the Conservation of Albatrosses and Petrels; ACCOBAMS: Agreement on the
410
Conservation of Cetaceans in the Black Sea Mediterranean Sea and Contiguous Atlantic Area; Bern Convention:
411
Conservation of European Wildlife and Natural Habitats; BD: Birds Directive; CFP: Common Fisheries Policy (and
412
amendments); Com (2012)665 final: Action Plan for reducing incidental catches of seabirds in fishing gears; Directive
413
2009-17-EC establishing a Community vessel traffic monitoring and information system; Directive 2009-123-EC on
414
ship-source pollution; Directive 2013-39-EU regards priority substances in the field of water policy; Directive
2014-415
101-EU: framework for Community action in the field of water policy (amending WFD); EU BS: EU Biodiversity
416
Strategy; EMFF: the European Maritime and Fisheries Fund; FAO: UN Food and Agriculture Organization; HD:
417
Habitats Directive; ICCAT: International Commission for the Conservation of Atlantic Tunas; ICES: International
418
Council for the Exploration of the Sea; IEA: Environmental Impact Assessment (and amendments); IMO: International
419
Maritime Organization; IUCN: International Union for Conservation of Nature; PRF: Port Reception Facilities
420
Directive; Reg. 708-2007: concerning use of alien and locally absent species in aquaculture; Reg. 812-2004: laying
421
down measures concerning incidental catches of cetaceans in fisheries; Reg. 854-2004: controls on products of animal
422
origin intended for human consumption; Reg. 2015-812: as regards the landing obligation; Reg. 2016-145: on invasive
423
alien species; Reg. 2166-2005: measures for the recovery of the Southern hake and Norway lobster stocks in the
424
Cantabrian Sea and Western Iberian peninsula; SEA: Strategic Environmental Assessment (and amendments); TAC:
425
Total allowable catches; UN CBD: Convention on Biological Diversity-Nagoya Protocol; UNEP: UN Environmental
426
Protection; UNCLOS: UN Convention on the Law of the Sea; UWWT: Urban Waste Water Directive; Waste
427
Framework (Directive).
428 429
4. Discussion
430
The analysis of the PoM from Spain, Portugal and France showed that there are differences in the 431
reporting, scope of the measures, level of implementation, economic analysis and in the integration 432
with relevant legislation. 433
4.1. Differences in reporting 434
Member States are allowed a certain degree of flexibility, under the principle of subsidiarity (i.e. 435
taking decisions at the most local level) in developing their programmes but the information must 436
be reported in a consistent and comparable format (EC, 2014a). Using the EC and OSPAR 437
guidelines as reference, more similarities were found between Spain and France, which both 438
provide the most relevant requirements, while important information was missing in the Portuguese 439
PoM. In particular, the descriptor/s and the KTM are not explicit in most of the existing measures, 440
but it is assumed that these will contribute to improving the environmental status of Portuguese 441
published its programme almost two years (at the end of 2014) before Spain and France as well as 443
the other countries of the North-East Atlantic region (EIONET Report Obligation Database); this 444
has reduced the possibility to learn from others and to fill eventual gaps in information that needed 445
to be reported. Notably, this may have prevented Portugal consulting with the other countries, but 446
allowed Spain and France to cooperate thus enabling a closer reporting and similarity between 447
them. 448
The lack of information and the differences in the reporting between the countries prevent an 449
understanding of environmental issues in common in the sub-region and that are better tackled by 450
concerted actions. For example, Spain reports on single measures for the protection of species and 451
habitats of the OSPAR list, while France and Portugal mention few species on this list. Differences 452
were also noted in the economic analysis, where Spain gives more detail based on the judgment of 453
experts on the effectiveness, the financial cost and benefits for some sectors considered to be 454
affected by new measures. There was also disagreement between the information provided in the 455
reporting sheets and document from each country, for example in the number of measures or 456
legislation. Moreover, the level of detail provided for each measure varied within national 457
programmes. In fact, some measures are well described while others, mainly existing measures, are 458
reported with little detail and with no clear insight of how they will contribute to the achievement of 459
GES. Loizidou et al. (2017) analyse the PoM of the Mediterranean Sea region and report the same 460
difficulties in comparing national reports and identifying common measures because of the wide 461
range of approaches adopted by the Member States. The same weaknesses are identified by the EC 462
in its recent analysis of the WFD PoM of all the EU countries (EC, 2015b). It highlights the delay 463
by certain countries in submitting the report and Òthe lack of detail in defining the measures 464
concretely which may lead to insufficient action to tackle the specific problems of the water bodies 465
and hinder the achievement of the WFD at local levelÓ (EC, 2015b). 466
Activities to fill gaps in other phases of the directive, e.g. targets and monitoring, are by definition 467
not measures (EC, 2014a), but rather a means of determining if measures are effective; however, 468
they have been reported by the three countries under different descriptors. For example, the French 469
measure ÔLimiting the point and diffuse source of pesticidesÕ or the Spanish measure ÔImprove the 470
knowledge of aspects related to marine pollutionÕ are more likely to be considered targets. 471
The differences identified in this analysis highlight the need for a more coherent reporting exercise 472
as the first step for the coordinated implementation of environmental policies and this could be 473
easily achieved if countries are willing to discuss their gaps in knowledge and to exchange 474
information from the early phases of the development of their programmes. 475
4.2. Differences in scope and spatial application 477
In the sub-region, measures address all the qualitative descriptors of the MSFD but with differences 478
on the number and focus of the measures. Most measures are directly linked to biodiversity and 479
focused either on the restoration and conservation of biodiversity, through the creation or extension 480
of Marine Protected Areas, or on mitigation of the impact from maritime activities, such as 481
fisheries. It is apparent that the countries have had more than 2 decades of producing measures in 482
relation to the Habitats Directives and that these have then been reported as biodiversity measures. 483
Other actions, aimed at reducing contamination, eutrophication and litter in the ocean, will also 484
contribute to achieve GES for biological diversity. However, measures related to biodiversity are 485
highly variable: from a very general reference to the protection of seabirds and sea mammals to the 486
specific mention of particular species/habitats, associated pressures and international conventions 487
(mainly OSPAR and ICCAT). The integration with the existing lists of threatened species/habitats 488
distributed at sub-regional and regional level is particularly important in this phase of the MSFD 489
since coordinated measures are needed to improve their status effectively. This has been confirmed 490
by a recent survey to the Marine Strategy Coordination Group showing that 70% of participants 491
(mostly Member States representatives) agreed on the need to adopt a common list of the most 492
vulnerable species/habitats/communities within each region which should include and go beyond 493
the lists of other relevant pieces of legislation and agreements (such as the Habitats and Birds 494
Directives and OSPAR) (Cavallo et al., 2017). 495
The wide differences in the KTM for each group of descriptors are not necessarily a negative 496
aspect, especially when the impact of a given pressure is mitigated through a wide range of actions 497
among countries. For example, the impact of fisheries on biodiversity is addressed by reducing by-498
catches, by decreasing the number of fishing boats, temporary cessation, and establishing minimum 499
capture size for several species. Similarly, the impact of contaminants and nutrients has been 500
addressed in very different ways: from reducing sea-based pollution to land-based discharge 501
controls. Such a mixture of approaches may be the result of the specific characteristics of each 502
country and not the lack of political will to develop coordinated measures. It is suggested here that 503
when one or more local pressures may have an impact on the waters beyond national borders (e.g. 504
introduction of nutrients and contaminants from land) they can be jointly addressed by countries 505
through different measures. When several pressures act at the same time in a given area, their 506
impact can be cumulative, producing synergistic or antagonistic effects (Griffith et al., 2011, 2012; 507
Elliott et al, 2017). For this reason, it is valuable to determine the interaction between different 508
measures, whether they can increase or decrease each otherÕs effects (Judd et al., 2015). For 509
in the marine ecosystem than the decrease of fishery effort and that the greatest benefit is reached 511
by joint reductions of these two pressures. 512
Despite this, in some cases, coherence among measures is needed to tackle those pressures that have 513
effects on the waters of the entire region, such as contamination from ships, or to protect threatened 514
species that have a wider distribution. In these cases, countries should set coherent limits, e.g. in the 515
catches of red tuna, or to integrate targets of other legislation. For example, oil tanker accidents, 516
such as the Erika (France, 1999) and Prestige (Spain, 2002), received public attention at an 517
international level to find a solution for minimising the risks related to such events (Vanem et al., 518
2009). As a consequence, several international regulatory and preventive measures have been 519
developed to reduce the environmental risk associated with oil spills related to either operation or 520
tank design (Vanem et al., 2009). 521
Although France and Spain have developed several measures that need to be implemented at sub-522
regional and regional level, none of the countries examined here identified any issue that require 523
actions at EU and regional level and that cannot be tackled by measures adopted at national level 524
(Article 15). Unfortunately, the interconnected nature of the seas, and the public good nature of 525
many of the marine ecosystem services and their resulting societal benefits (Turner and Schaafsma, 526
2015), makes it difficult for the States to remedy environmental problems unilaterally (e.g. Sandler 527
2004, Touza and Perrings 2011, Perrings, 2016). Similar levels of ambition in the implementation 528
of marine policy need to be reached by each country (Borja et al., 2010) and each have to contribute 529
to the achievement of the GES of the (sub)region. 530
531
4.3. Differences in policy integration 532
The analysis of policy integration showed that a wide range of international, regional and EU (and 533
national) legislation was mentioned by the three countries in their programmes. However, the 534
implicit types of legislation were more similar for Spain and France than for Portugal. Differences 535
were also observed in the number of times a given legislative instrument was mentioned. There 536
were major similarities in the integration of policies regarding D3ÐCommercial Fish and shellfish, 537
where the three countries integrate measures from the CFP and using TAC (Total Allowable Catch 538
limits) while Spain and Portugal also considers the work under ICCAT and the OSPAR 539
Commission. Despite the relevant role of ICES in fisheries management, only Portugal integrates its 540
related measures. On the other hand, there were many differences in the type of legislation 541
integrated with the descriptors for Contaminants (D8, 9) and Eutrophication (D5). This could be due 542
to the fact that, for instance, Portugal focuses more on preventing sea-based pollution caused by 543
and contaminants from land and air (integrating mainly OSPAR work) while France addresses the 545
reduction of nutrients from agriculture (integrating Directive 2014-101-EU amending the WFD). 546
However, in some cases, even when countries address the same type of pressure, e.g. reduction of 547
nutrients from land or protection of a given species, different pieces of legislation have been 548
integrated. 549
The same selective approach was identified during the definition of GES, establishment of targets 550
and initial assessment (EC, 2014b; Cavallo et al., 2016). We previously (Cavallo et al., 2016) 551
suggest that this could be due to the Member States having a limited knowledge of the real 552
connection between such policies and the MSFD. In recognition of this, either the EC (EC, 2014a) 553
or OSPAR (OSPAR, 2015) provided recommendations with a comprehensive list of the pieces of 554
legislation whose work should be considered in the MSFD PoM. This analysis has shown that some 555
important pieces of legislation have not been mentioned by the three countries. For example, for the 556
biodiversity descriptors, the ACCOBAMS is mentioned only by Spain, while the CITES 557
Convention only by France; for Eutrophication, the UWWD is mentioned only in two measures by 558
France and Spain. 559
The purpose of the MSFD is to integrate and not to replace other related environmental legislation 560
(Boyes and Elliott, 2014) and several pieces of legislation are clearly mentioned in its text regarding 561
the protection of biodiversity Ð CBD, HD and BD Ð and the prevention of pollution Ð UNCLOS, 562
WFD and others. When implementing the future steps of the MSFD and other multi-sectoral 563
policies, Member States should put more effort into integrating the objectives of other legislation. 564
The consequences of the failings in policy integration could be duplication of work, contradicting 565
policy outcomes and a waste of economic resources (Maier, 2014). 566
Although achieving the final objective of GES is strongly linked to the success of other EU (van 567
Leeuwen et al., 2012; Ounanian et al., 2012) and international legislation, in some cases, existing 568
measures are not sufficient to reach this objective and it is valuable to identify and resolve gaps and, 569
where necessary, take further actions (Boyes et al., 2016). 570
571
4.4. Gaps in the economic analysis 572
The EC, through its Common Implementation Strategy Working Groups, provides support to 573
Member States to exchange information and to identify best-practices in the application of CBA and 574
CEA (EC, 2015a). However, there are no specific guidelines indicating the methodologies to be 575
adopted for the economic valuation of marine ecosystem services (EC, 2015a) and, as a result, the 576
approaches used to perform this analysis vary among the three Member States. Moreover, the lack 577
from the implementation of measures, limits the economic analysis on how society can benefit from 579
them (see also Bšrger et al., 2016; Balvanera et al. 2017). Economic analysis presented for the three 580
countries was mainly qualitative, and often lacks the social considerations that should characterise 581
environmental decision making. Similar considerations are made in the analysis of the PoM of 582
Finland, the UK and Spain (Bšrger et al., 2016) and Germany (Bertram et al., 2014). In particular, 583
comments provided by the Spanish public participation process recognise that the benefits of the 584
programme of measures would have been much higher if a broader range of ecosystem services 585
would have been considered in the analysis (MAGRAMA, 2015). 586
Global biodiversity continues to decline, undermining ecosystem functions and thus compromising 587
the flow of ecosystem services and societal benefits (De Groot et al., 2012; Turner and Schaafsma, 588
2015). Environmental appraisal tools, such as cost-benefit analysis and cost-effectiveness, are 589
valuable to raise awareness about the importance of marine ecosystems and biodiversity to policy 590
makers (Atkinson and Mourato, 2008; De Groot, et al., 2012; Turner and Schaafsma 2015; Elliott et 591
al., 2017). This approach is recommended to make a more effective use of limited financial 592
resources, identifying where protection is economically most important and can be achieved at 593
lowest cost (Crossman and Bryan, 2009; Crossman et al., 2011, Borja and Elliott, 2013). Assessing 594
the benefits of a sustainable use of marine resources is necessary to determine the economic loss 595
caused by the degradation of ecosystems for the maritime industry sectors (Borja et al., 2017). A 596
coordinated effort at regional and EU level could help countries to address these gaps and 597
eventually to establish the compensation that should be paid for the loss of biodiversity and the 598
related services provided. The UNEP project, TEEB for Ocean & Coasts, aims to bridge the gaps in 599
knowledge on ocean ecosystem services and functions and to draw attention to the social non-600
market benefits deriving from the maintenance of marine biodiversity3. Despite the increase in 601
economic valuation as a tool for decision making, when dealing with the management of 602
environmental resources, it is especially difficult to value financially the cultural value of 603
ecosystems due to social complexity, diversity, spiritual significance on human health and well-604
being (Bryce et al., 2016; Turner and Schaafsma, 2015; Elliott et al., 2017). 605
It is emphasised here that Member States included in the same marine region and/or sub-region 606
should cooperate to identify those measures that are more effectively implemented in collaboration 607
with other countries (under Article 15) to share the costs and the benefits of such actions. To 608
promote this kind of actions, the EC provides financial support through the European Maritime and 609
Fisheries Fund (EMFF) and Cohesion Funds (CIS, 2013). 610
611
5 Concluding Remarks
612
The Programmes of Measures developed by the three countries of the Bay of Biscay and the Iberian 613
coast sub-region are, in general, difficult to compare and the lack of relevant information does not 614
allow a complete understanding of how each programme will contribute to achieve the GES of the 615
sub-region. Despite that, the numerical analysis here has used a novel method to compare these 616
PoM and show that Spain and France are similar whilst both differ from Portugal in the 617
implementation. Among the three countries, Spain has mainly adopted a sub-regional (or even 618
regional) approach to the development of its national programmes. This specifies the level of 619
implementation of new measures, their effect at supra-national level and includes almost 60% of the 620
OSPAR list of species/habitats that have sub-regional distribution and that require coordinated and 621
wider-scale effort in order to be protected. 622
As yet, and as shown here, the countries have only recently proposed their programmes while at the 623
same time (in 2017-2018) repeating the assessment of Good Environmental Status (the first was 624
performed in 2012). Therefore it is not yet possible to show whether those PoM have had a desired 625
effect of improving the GES or causing it to be achieved. This could be regarded as a failing of the 626
timing of the MSFD actions whereby the production of the PoM, the monitoring strategies and the 627
second assessment of GES have all overlapped. Such an analysis of the efficacy and effectiveness 628
of the PoM will therefore be required at the time of the 3rd quality assessment (probably in 2024). 629
As the 2020 deadline for GES is approaching, it is shown there that more effort is required by all 630
the parties involved in the implementation of this Directive to achieve this goal. As such it is 631
concluded that: 632
- countries need to make better use of the EC and OSPAR coordination structures and the 633
guidelines they provide, to improve coherence in the programmes of measures and in all the 634
phases of the MSFD; 635
- more political willingness is essential to identify common gaps in knowledge and exchange 636
best practices, even with the Member States of the other regions and sub-region; 637
- Member States need to work together to develop joint programmes of measures to address 638
transboundary issues and to perform joint economic analysis where costs and benefits can be 639
shared across the sub-region. 640
641
Acknowledgments
642
643
This work was partially supported by the University of Vigo (Spain) and partly from the DEVOTES 644
Environmental Status) project funded by the European Union Seventh Programme for research, 646
technological development and demonstration, ÔThe Ocean of TomorrowÕ Theme (grant agreement 647
no. 308392), www.devotes-project.eu. Thanks are also due, for the financial support, to CESAM 648
(UID/AMB/50017/2013), supported through national funds by FCT/MCTES and the co-funding by 649
the FEDER (POCI-01-0145-FEDER-007638), within the PT2020 Partnership Agreement and 650
References
652
653
Atkinson, G. and Mourato, S., 2008. Environmental Cost-Benefit Analysis. Annual Review of Environment
654
and Resources, 33:317Ð44
655
Bagagli E. 2015. The EU legal framework for the management of marine complex socio-economic systems.
656
Marine Policy 54:44Ð51.
657
Balvanera, P., E. M. Bennett, P. Balvanera, S. Quijas, D. S. Karp, N. Ash, E. M. Bennett, R. Boumans, C.
658
Brown, K. M. A. Chan, R. Chaplin-kramer, B. S. Halpern, J. Honey-ros, H. Mooney, T. Mwampamba, J.
659
Nel, S. Polasky, B. Reyers, J. Roman, W. Turner, R. J. Scholes, H. Tallis, K. Thonicke, F. Villa, and M.
660
Walpole. 2017. The GEO Handbook on Biodiversity Observation Networks. Page (M. Walters and R. J.
661
Scholes, Eds.). Springer International Publishing, Cham.
662
Bertram, C., Dworak, T., Gšrlitz, S., Interwies, E., and Rehdanz, K. 2014. Cost-benefit analysis in the
663
context of the EU Marine Strategy Framework Directive: the case of Germany. Marine Policy 43: 307-312.
664
doi:10.1016/j.marpol.2013.06.016
665
Bertram, C., and Rehdanz, K. 2013. On the environmental effectiveness of the EU Marine Strategy
666
Framework Directive. Marine Policy, 38: 25-40. doi:10.1016/j.marpol.2012.05.016
667
Beunen R., van der Knaap W.G.M., Biesbroek G.R. 2009. Implementation and integration of EU
668
environmental directives. Experiences from the Netherlands. Environmental Policy and Governance 19:57Ð
669
69.
670
Bogaert, S., 2012. Economic assessment of policy measures for the implementation of the Marine Strategy
671
Framework Directive EC DG Environment, Contract N¡ 070307/2010/577902/ETU/F1; Project n¼ 11601,
672
Final Report: 172 pp.
673
Bšrger, T., S. Broszeit, H. Ahtiainen, J. Atkins, D. Burdon, T. Luisetti, A. Murillas, S. Oinonen, L.
674
Paltriguera, L. Roberts, M. C. Uyarra, M. Austen, 2016. Assessing costs and benefits of measures to achieve
675
Good Environmental Status in European regional seas: Challenges, opportunities and lessons learnt.
676
Frontiers in Marine Science, 3: 10.3389/fmars.2016.00192.
677
Borja ç., Elliott M., Carstensen J., Heiskanen A-S., van de Bund W. 2010. Marine management - towards an
678
integrated implementation of the European Marine Strategy Framework and the Water Framework
679
Directives. Marine Pollution Bulletin 60:2175Ð2186.
680
Borja, ç., Elliott, M., Andersen, J.H., Cardoso, A.C., Carstensen, J., Ferreira, J.G., Heiskanen, A.-S.,
681
Marques, J.C., Neto, J., Teixeira, H., Uusitalo, L., Uyarra, M.C., Zampoukas, N., 2013. Good Environmental
682
Status of marine ecosystems: What is it and how do we know when we have attained it? Marine Pollution
683
Bulletin 76:16-27.
Borja A., Elliott M., Uyarra M. C., Carstensen J., Mea M., eds. 2017. Bridging the Gap Between Policy and
685
Science in Assessing the Health Status of Marine Ecosystems, 2nd Edition. Lausanne: Frontiers Media. doi:
686
10.3389/978-2-88945-126-5; pp548; downloaded from
687
http://www.frontiersin.org/books/Bridging_the_Gap_Between_Policy_and_Science_in_Assessing_the_Healt 688
h_Status_of_Marine_Ecosystems_2nd/1151 689
Boyes S.J., Elliott M., Murillas-Maza A., Papadopoulou N., Uyarra M. C. 2016. Is existing legislation
fit-for-690
purpose to achieve Good Environmental Status in European seas? Marine Pollution Bulletin 111:18-32
691
Boyes, S.J. and Elliott, M., 2015. The excessive complexity of national marine governance systems Ð Has
692
this decreased in England since the introduction of the Marine and Coastal Access Act 2009? Marine Policy
693
51:57:65.
694
Boyes S.J., Murillas-Maza A., Uyarra M.C., Eronat H., Bizsel K.C., Kaboglu G., Papadopoulou N.,
695
Hoepffner N., Patr’cio J., Kryvenko O., Churilova T., Newton A., Oinonen S. 2015. Key Barriers of
696
Achieving Good Environmental Status (GES). Part 1: Current Evidence Concerning Legislative, Policy and
697
Regulatory Barriers to Achieving GES. Deliverable 2.2 DEVOTES Project ( http://www.devotes-698
project.eu/wpcontent/uploads/2015/05/DEVOTES-Deliverable-2_2.pdf).
699
Boyes S.J. & Elliott M. 2014. Marine Legislation Ð the ultimate ÔhorrendogramÕ: International Law,
700
European Directives & National Implementation. Marine Pollution Bulletin, 86(1-2): 39-47. doi:
701
10.1016/j.marpolbul.2014.06.055
702
Bryce, R., Irvine, K., Church, A., Fish, R., Ranger, S., Kenter, J. O. 2016. Subjective well-being indicators
703
for large-scale assessment of cultural ecosystem services. Ecosystem Service. 21, pp. 258-269,
704
Cavallo M., Elliott M., Touza, J., Quintino, V. 2016. The ability of regional coordination and policy
705
integration to produce coherent marine management: implementing the Marine Strategy Framework
706
Directive in the North-East Atlantic. Marine Policy 68:108Ð116.
707
Cavallo M., Elliott M., Touza, J., Quintino, V. 2017. Benefits and impediments for the integrated and
708
coordinated management of European seas. Marine Policy 86:206-213
709
CIS, 2013. Common Implementation Strategy for the Marine Strategy Framework Directive. Learning the
710
lessons and launching a re-enforced phase of implementation. Final version agreed by Marine Directors on
711
5/12/2013. pp. 14Ð16.
712
Clarke K.R. 1993. Non-parametric multivariate analyses of changes in community structure. Australian
713
Journal of Ecology, 18: 117Ð143.
714
Clarke K.R., Gorley R.N. 2015. PRIMER v7: User Manual/Tutorial. PRIMER-E, Plymouth. 296 pp.
715
Crossman N.D., Bryan B.A. 2009. Identifying cost-effective hotspots for restoring natural capital and
716
enhancing landscape multi-functionality. Ecological Economics 68:654Ð668.