Int. J. Electrochem. Sci., 7 (2012) 11161 - 11181
International Journal of
ELECTROCHEMICAL
SCIENCE
www.electrochemsci.org
Electropolymerization of Aniline Over Chemically Converted
Graphene-Systematic Study and Effect of Dopant
Hagar K. Hassan, Nada F. Atta, Ahmed Galal*
Department of Chemistry, Faculty of Science, Cairo University, 12613 Giza, Egypt Tel.:+20 0235676561, Fax: +20 0235727556
*
E-mail: [email protected]
Received: 15 September 2012 / Accepted: 19 October 2012 / Published: 1 November 2012
Graphene was chemically prepared using microwave irradiation. Aniline was electropolymerized over graphene immobilized on glassy carbon substrate potentiostatically in a three-electrode-one compartment cell. A systematic study of chemically converted graphene/PANI composites in both monomer free solution and potassium ferricyanide/ferrocyanide redox system was performed. The resulted chemically converted graphene/poly(aniline) (CCG/PANI) composite was characterized using surface techniques such as field emission scanning electron microscope (FE-SEM) and atomic force microscope (AFM). The effect of different dopants on the electrochemical behavior of CCG/PANI in several protonic acids was also investigated. The diffusion coefficients of proton and counterion (anion) as well as the average diffusion coefficients in these protonic acids were calculated. The results revealed that the presence of graphene enhances the electrochemical performance of PANI in both monomer free solution and potassium ferricyanide. A synergetic electrocatalytic effect resulted when combining PANI and CCG as manifested by a noticeable increase in current signals.
Keywords: Chemically converted graphene (CCG); Polyaniline (PANI); Protonic acids; doping process; Electropolymerization.
1. INTRODUCTION
chemistry of PANI was studied on different surfaces by several researchers such as the direct electropolymerization of PANI on bare GCE [12,13]. Several researchers studied the electropolymerization of PANI on the surface of carbon nanotubes (CNTs) [15-17]. And there are other publications that indicated the use of PANI/CNTs composites in many applications, this composite was prepared by one step synthesis [18].
Graphene was considered as the missing allotrope of pure carbon materials, after the discovery of graphite, diamond, fullerenes and carbon nanotube [19]. Graphene is a member of 2-dimentional materials discovered by Andre Geim's research group at the University of Manchester in 2004, and prepared by the so-called “scotch-tape” technique [20]. Graphene is a one atom thick structure that consists of a hexagonal array of Sp2- bonded carbon [21-24] atoms and looks like a honey comb [21, 25, 26]. It can be considered as the mother of all carbon materials where, SWCNTs can be viewed as the result of rolling up a sheet of graphene [27, 28]. On the other hand, graphite is one of the oldest known carbon allotropes and can be considered as a stacked graphene sheets while graphene can be coalesced to form fullerene [29].
Graphene has some unique properties which make it one of the most interesting materials nowadays even compared to CNTs. The optical and electrical properties of reduced graphene oxide depend on the spatial distribution of the functional groups and structural defects [30]. Some of its properties are: has large theoretical surface area about 2620 m2/g [25, 28, 31], chemically stable and almost impermeable to gases, can withstand large current densities, has high thermal [19] and chemical conductivity [32, 33] including extremely high charge (electrons and holes) mobility (230,000 cm2/Vs) with 2.3% absorption of visible light [34, 35] and thermal conductivity (3000 W/mK), has outstanding mechanical properties [33, 36], the highest strength (130 GPa), has large amount of edge planes/defects [32], and is less expensive to produce compared to CNTs [33].
The discovery of graphene and graphene-based polymer nanocomposites is an important addition in the area of nanoscience and plays a key role in modern science and technology [37]. In the past several years, there has been a growing interest in the preparation, structural characterization and applications of graphene/conduction polymer (CP) composites [38–50]. This is mainly due to the fact that there are several complementary properties between CPs and graphene, especially those related to electrochemical activity, conductivity and mechanical strength. It is expected that the hybridization of CPs with graphene would be attractive for combining the properties of both components or improving the properties of the resulting composites based on the resulting synergetic effects. Thus, graphene/CP nanocomposites show superior mechanical, thermal, gas barrier, electrical and flame retardant properties compared to the neat polymer [37, 51–58].
To the best of our knowledge there is no previous work that introduced a systematic study of PANI grown on the surface of CCG. The aim of this work is to study the electrochemical behavior of CCG/PANI systematically including the optimization and the characterization of the electropolymerized PANI on glassy carbon/chemically converted graphene (GC/CCG) surface as well as studying the doping/undoping processes of PANI on the surface of GC/CCG in presence of several protonic acids.
2. EXPERIMENTAL
2.1. Materials and Chemicals
All chemicals were used as received without further purification except for aniline that was purified by distillation. Graphite powder, sulfuric acid, nitric acid, hydrochloric acid, orthophosphoric acid, potassium ferricyanide, dimethylformamide (DMF) and hydrazine hydrate (HH) were supplied by Aldrich Chem. Co. (Milwaukee, WI. USA).
2.2. Preparation of chemically converted graphene (CCG)
Initially graphene oxide (GO) was prepared by oxidation of spectroscopic grade graphite powder using the method of Hummers [60]. The following summarizes the protocol followed: 1 g of graphite powder (spectroscopic grade) and 0.525 g of sodium nitrate into 24 ml of 93% H2SO4 were vigorously stirred. The ingredients were mixed and cooled to 0oC in an ice-bath and 5.0 g of potassium permanganate was added to the suspension. The ice-bath was then removed and the temperature of the suspension is brought to 35 ± 3o
C, where it was maintained for 90 minutes then water (48 ml) was slowly stirred into the paste. The diluted suspension (brown in color) was maintained at this temperature for 15 minutes. The suspension was then further diluted to approximately 150 ml with warm water and treated with 30% hydrogen peroxide that turned it into bright yellow suspension. Graphene oxide was filtrated and washed several times and left to dry.
Chemically converted graphene was prepared by chemical reduction of graphene oxide (GO) using microwave irradiation in the presence of hydrazine hydrate (HH) as a reducing agent [61]. Thus, 0.1 g of GO was sonicated with 20 ml of deionized water until a homogeneous yellow dispersion was obtained. Graphene oxide can be dispersed easily in water due to the presence of a variety of hydrophilic oxygen groups (OH, O, COOH). After adding 150 μl of HH, the solution was placed in a conventional microwave oven (MC-9283 JLR, 900 W) and operated at a full power 900 W in 30 s cycles (on for 10 s, off and stirring for 20 s) for a total reaction time of 120 sec.
2.3. Electrochemical cells and equipments
Electrochemical experiments were carried out in a three-electrode/one-compartment glass cell. The working electrode was a GC electrode (diameter: 3 mm), reference electrode was Ag/AgCl (4.0 M KCl) and a Pt wire (5 cm long; diameter: 2 mm) as auxiliary electrode. GC electrode was polished using alumina (2 µm)/water slurry) until no scratches were observed. About 10 µl of CCG suspension was added onto the surface of GC electrode. GC/CCG was left to dry at 70 oC, and then GC/CCG was subjected for aniline electropolymerization. The polymerization bath consists of 0.1 M aniline monomer dissolved in 0.5 M different supporting electrolytes (H3PO4, HCl, HNO3 or H2SO4). Aniline was polymerized at constant potential (+800 mV to +1100 mV) for (20 s to 120 s).
The electrochemical characterizations were performed using BAS-100B electrochemical analyzer (Bioanalytical systems, BAS, West Lafayette, USA) that was connected to a personal computer.All experiments were carried out at temperature 25 ± 0.2 oC.
2.4. Structural and surface characterization
-ray diffraction ( ) was recorded on Panlytical Pert using Cu-Kα radiation (λ = 1.540 Ǻ). Surface measurements were achieved using field-emission scanning electron microscope (FE-SEM) by a JEOL JSM7000F Field Emission Scanning Electron Microscope and the atomic force microscope (AFM) by Shimadzu Wet – SPM (Scanning Probe microscope). AFM roughness data were used to calculate the real surface area according to the following relation:
Surface roughness = (1)
In this respect, the “real” surface area for GC/CCG and GC/CCG/PANI was calculated from the surface roughness as indicated in equation (1).
3. RESULTS AND DISCUSSION
3.1 Surface characterization
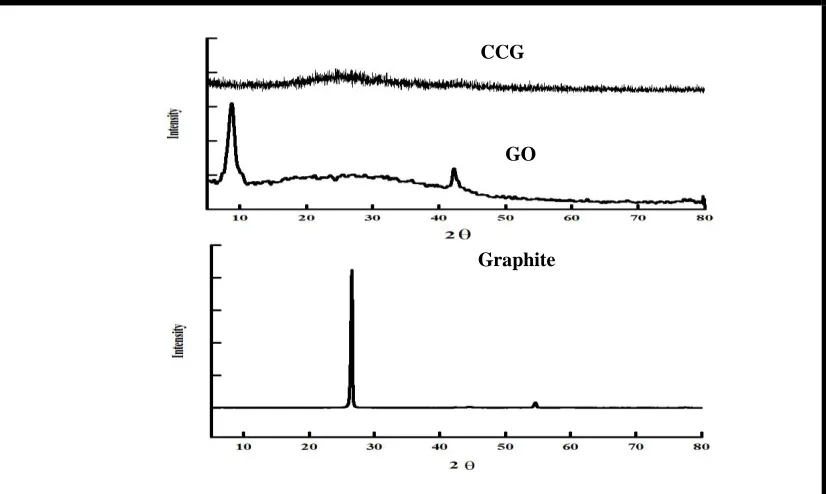
Figure (1) shows the XRD of graphite, GO and CCG. The XRD of CCG shows no peak neither around 11-12 Å as in case of GO nor around 26 Å as in case of graphite this indicates the successful preparation of CCG from the reduction of GO.
[image:5.596.94.507.71.318.2]
Figure 1. The XRD of graphite, GO and CCG
(A)
(B) (C)
(D) (E)
GO CCG
Figure 2. A) FE-SEM of CCG, B) and D) FE-SEM of GC/PANI with magnification 2500 and 40000, respectively, C) and E) CG/CCG/PANI with magnification 2500 and 40000, respectively. (
(A) (B)
[image:6.596.87.511.70.219.2](C)
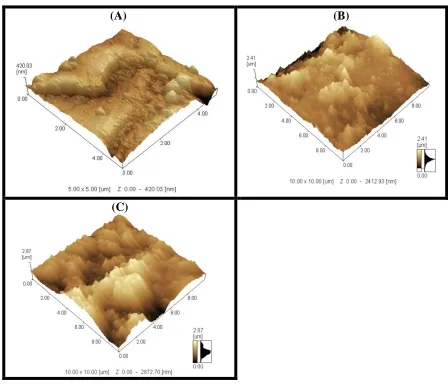
Figure 3. 3-dimensional AFM of A) GC/CCG, B) GC/PANI and C) GC/CCG/PANI.
[image:6.596.73.521.303.691.2]
increases in the presence of CCG. This result indicates that the use of CCG as a solid substrate affects the morphology of the electropolymerized PANI film.
The three dimensional AFM images of GC/CCG (A), GC/PANI (B) and GC/CCG/PANI (C) are shown in Figure (3). As clearly seen from the AFM images, the GC/CCG/PANI shows more curves and humps compared to GC/PANI. This indicates that the presence of graphene increases the surface roughness and consequently the real surface area. The calculated surface roughness and real surface area for GC/CCG, GC/PANI and GC/CCG/PANI are 1.67, 1.3623, 1.502 and 0.118 cm2, 0.0962 cm2 and 0.106 cm2, respectively
3.2.2. Electrochemical behavior of graphene/polyaniline (CCG/PANI) composite in monomer free solution
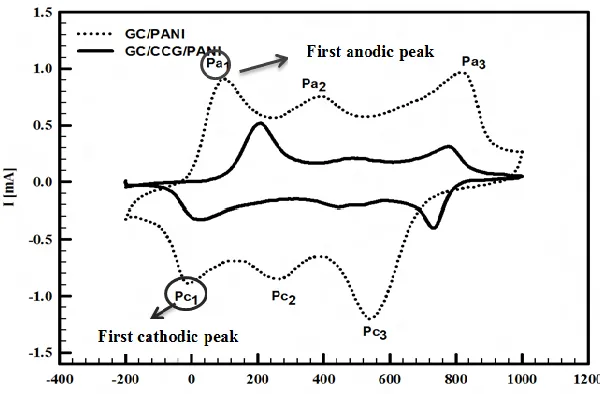
Cyclic voltammograms of PANI deposited on bare GC electrode in 0.5 M H2SO4 is characterized by three pairs of current peaks (three peaks in the anodic direction and three in the cathodic one) [62]. These peaks are due to doping and undoping of protons and anions in PANI film [62] and the transformation between different forms of PANI [63].
[image:7.596.148.448.511.708.2]The oxidation peak around +200 mV is attributed to the conversion from leucoemeraldine into emeraldine form, the second peak appearing around +800 mV is due to emeraldine/pernigraniline transformation [62-65] and the current peak around +500 mV is assigned to the formation of benzoquinone (BQ) as side product due to overoxidation or degradation of PANI film [63]. BQ can be produced through two consecutive reactions involving the hydrolysis of quinoid site of PANI [65]. Some other researchers assigned the peak at +500 mV to the crosslinking of PANI and formation of head to tail dimer [66]. Figure (4) shows the CVs of GC/PANI and GC/CCG/PANI in 0.5 M H2SO4 from -200 to +1000 mV at scan rate 50 mV s-1.
Comparing between the CVs of GC/PANI and GC/CCG/PANI it is found that both anodic and cathodic peak currents increase sharply in case of GC/CCG/PANI which proves that graphene improves the electron transfer rate for PANI formed onto CCG. Moreover, the double layer capacitance of GC/CCG/PANI is much higher than in case of GC/PANI which indicates that GC/CCG/PANI has much higher electrochemical active area.
It is important to mention that, the number of active sites within the porous polymer layer varies considerably, and is not related to neither the film thickness nor to the real surface area, therefore currents are reported in the data presented in this work rather than current densities.
3.2.3. Effect of polymerization potential of aniline on CCG
In order to assign the best polymerization potential that provides higher electroactivity, aniline was polymerized on GC/CCG at different polymerization potential from +800 to +1100 mV and the formed CCG/PANI film was tested in monomer free solution. The CVs of GC/CCG/PANI (prepared at different polymerization potential) in 0.5 M H2SO4 as well as the effect of polymerization potential on 1st peak current is shown on supplementary figure (S (1)). The results indicate that, the best polymerization potential of aniline is +900 mV that yields a relatively higher current of the first peak on the surface of CCG.
3.2.4. Effect of polymerization time of aniline on CCG
The thickness of the resulted polymer can be controlled by controlling the polymerization time. Aniline was polymerized on CCG for different times between 20 s and 120 s at constant polymerization potential of +900 mV. For all polymer films, the thickness was estimated from the amount of charge consumed during the electro-polymerization step. Because of the lack of other experimental facilities, it was not possible to verify the estimated thickness of the films using an alternative technique. Therefore, assuming 100% current efficiency during the electrochemical conversion, it is possible to use the following empirical equation to roughly estimate the film thickness of PANI [63]:
d = Q.Mw/z.F.A.ρ
Where d is the thickness (cm), Q is the charge (C), Mw is the molecular weight of aniline (93.13 g mol-1), z is the number of electron transferred per aniline unite (0.5), F is Faraday’s constant (96485 C mol-1), A is the surface area of electrode (0.0706 cm2) and ρ is the density (1.02 g cm–3). The polymer film was alternatively formed using constant applied potential, Eapp = +900 V for 20 s to 120 s. The total charge passed varied from 8.87 mC to 70.25 mC. The film thicknesses were calculated and summarized in S (4) table.
+1000 mV at scan rate 50 mV s-1. The resulted CVs are shown in S (2A). The values of anodic and cathodic peak currents were plotted versus the polymerization time as shown in S (2B) and (2C), respectively. It is worth to mention that, as the polymerization time increases, the anodic and cathodic peak currents related to the three peaks also increase up to 90 s after that they are not affected largely by the extra applied time so, the polymerization time 90 s was selected as the optimum polymerization time of aniline on the surface of CCG.
3.2.5. Effect of dopant
There are two possibilities for chemical doping of poly(aniline): the “redox” oxidative doping and “non-redox” protonic acids doping. Conducting polymers like poly(acetylene), poly(thiophene) or poly(aniline) undergo p- or n-redox doping by a chemical process during which the number of electrons affects polymer chain changes. The protonic acids doping differ from “redox” doping in that the number of electrons assisted with the polymer chain does not change during the doping process and new electronic states are introduced by protonation.
Emeraldine base form of polyaniline can be doped by sufficiently strong protonic acid to give the corresponding emeraldine base. Upon doping process, only proton from protonating acid is transferred and chemically bonded to polymer chain, the rest of the acid molecule can vary in chemical structure, size and shape without change of electronic properties of the polymer chain. The negatively charged ion (dopant or counterion) stays connected to positively charged polyaniline chain via electrostatic interaction. So functionalization of polyaniline with different dopant can induce different additional properties to polyaniline [67].
The supporting electrolyte plays an important role in the growth of conducting polymer [68]. It is interesting to note the great influence of the counterion on the initial stage of the polymer growth is mainly manifested in:
i- The charge transferred during the electropolymerization. ii- The intensity and shape of the polymer redox peaks. iii- The diffusion rate of H+ inside the polymer film.
non-solvent interactions of the counterions should also greatly affect the doping/undoping process of the resulting polymer.
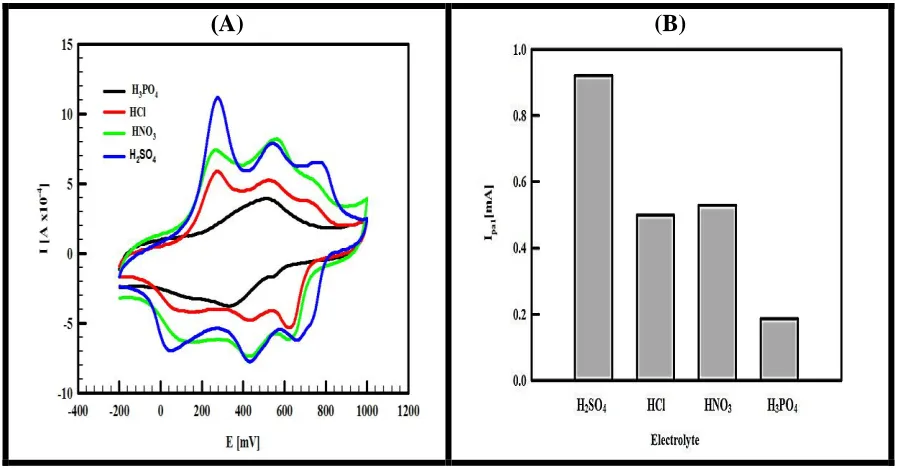
In order to investigate the effect of dopant on the behavior of polymer film, the polyaniline that is deposited on GC/CCG by electropolymerization in different protonic acids (HCl, HNO3, H3PO4 and H2SO4) was tested in 0.5 M of the corresponding acid (used in the electropolymerization step) in a monomer free solution using cyclic voltammetry from -200 to +1000 mV at scan rate 50 mV s-1. The typical CVs are shown in Figure (5A). The results show that the counterion has pronounced effects on the shape of the cyclic voltammogram. In case of using H2SO4 and HNO3, the three redox peaks are well resolved as indicated before but displaying lower peak current intensities in case of using HNO3 compared to the case of H2SO4. However, in case of using HCl the 2nd and 3rd redox peak current intensities diminished and for H3PO4 only one redox peak around +500 mV was obtained.
)A) (B)
[image:10.596.74.523.270.505.2]Figure 5. A) The CVs representing the effect of dopant on the electrocatalytic activity of GC/CCG/PANI, H3PO4 (black line), HCl (red line), HNO3 (green line), and H2SO4 (blue line), from -200 to 1000 mV at SR 50 mV s-1, the polymerization potential of aniline is +900 mV for 90 s for all dopant and B) a histogram between the different used dopant and first anodic peak current recorded in monomer free solution.
Table 1. The total charge passed through the aniline electropolymerization at various polymerization times on GC/CCG as well as the corresponding estimated PANI film thickness.
Dopant (Supporting electrolyte) Charge [mC] Estimated Thickness [µm]
H3PO4 17.36 4.6
HCl 28.27 7.57
HNO3 26.37 7.07
[image:10.596.68.527.642.753.2][image:11.596.43.550.248.339.2]
As mentioned before changing the counterion has a large effect on the intensity of redox peaks. From Figure (5A) it is clearly shown that H2SO4 provides the highest peak currents among the other protonic acids used in this study while the peak potentials are not largely affected by the type of counterion. The histogram given in Figure (5B) shows the effect of counterion on the value of 1st peak current. The values of peak current and potentials related to the three redox peaks are summarized in table (2).
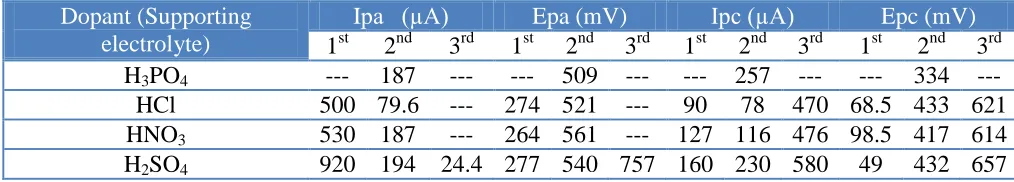
Table 2. The CV results of GC/CCG/PANI (polymerized in different protonic acids) in 0.5 M H3PO4, HCl, HNO3 and H2SO4, the potential window was from -200 to 1000 mV vs. Ag/AgCl electrode at SR 100 mV s-1.
Dopant (Supporting electrolyte)
Ipa (µA) Epa (mV) Ipc (µA) Epc (mV)
1st 2nd 3rd 1st 2nd 3rd 1st 2nd 3rd 1st 2nd 3rd H3PO4 --- 187 --- --- 509 --- --- 257 --- --- 334 ---
HCl 500 79.6 --- 274 521 --- 90 78 470 68.5 433 621 HNO3 530 187 --- 264 561 --- 127 116 476 98.5 417 614 H2SO4 920 194 24.4 277 540 757 160 230 580 49 432 657
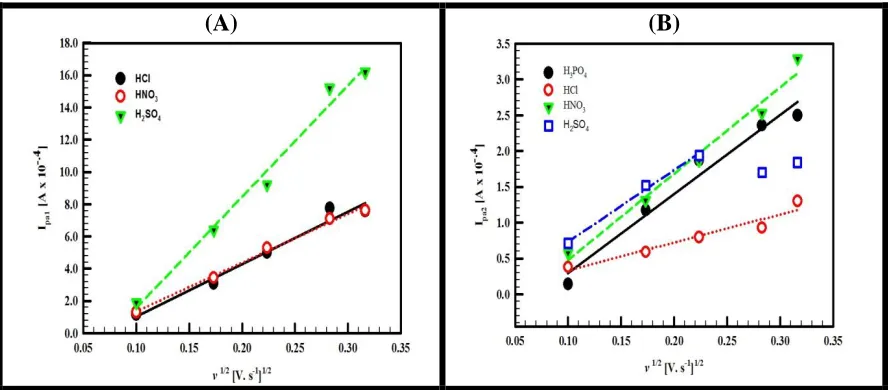
scan rate. The results indicate that at a low scan rate the SO42- or HSO4- doping presents a similar behavior to the other supporting electrolytes. As the scan rate increased, the charge transport through the PANI film is apparently diffusional and obeys Fick’s law. Consequently the behavior of the SO4 2-or HSO4- passing through the PANI film is dominated by Fickian diffusion kinetics [75]. This can be explained on the basis that under a high driving force, the diffusion rate of anions cannot keep up with that of cations.
(A) (B)
Figure 6. A) A plot of the 1st anodic peak current versus the square root of the scan rate at GC/CCG/PANI in HCl (black line), HNO3 (red line)and H2SO4 (green line) and B) A plot of the 2nd anodic peak current versus the square root of the scan rate at GC/CCG/PANI in H3PO4 (black line), HCl (red line), HNO3 (green line) and H2SO4 (blue line).
Table 3. The values of DH+, DC as well as D calculated from the effect of scan rate on the 1st, 2nd peak current and CA of GC/CCG/PANI in 0.5 M H3PO4, HCl, HNO3 and H2SO4.
Dopant (Supporting electrolyte)
Scan Rate* Chronoammperometry*
DH+a [cm2 s-1]
Dcb [cm2 s-1]
DAc [cm2 s-1]
Dctd [cm2 s-1] H3PO4 --- 1.550 × 10⁻⁷ 5.48 × 10⁻⁷ 6.08 × 10⁻⁷
HCl 1.350 × 10⁻⁶ 0.193 × 10⁻⁷ 9.04 × 10⁻⁷ 1.05 × 10⁻⁶ HNO3 1.160 × 10⁻⁶ 1.840 × 10⁻⁷ 4.43 × 10⁻⁷ 5.85 × 10⁻⁷ H2SO4 6.034 × 10⁻⁶ 1.270 × 10⁻⁷ 3.47 × 10⁻⁶ 5.14 × 10⁻⁶ *
The technique used for calculation of (D).
a
Diffusion coefficient of H+ b
Diffusion Coefficient of counterion
c
Diffusion coefficient for anodic scan and d
[image:12.596.77.521.216.411.2]
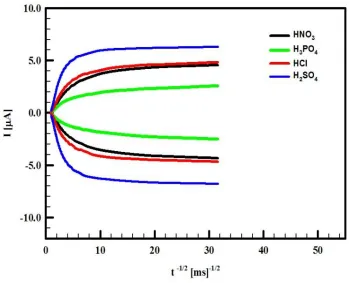
Figure 7. The typical CA of GC/CCG/PANI in H3PO4 (black line), HCl (red line), HNO3 (green line) and H2SO4 (blue line), the polymerization potential of aniline is +900 mV for 90s for all dopant.
As a result, the redox process is governed by the diffusion of counterions inside the film [75]. The diffusion coefficients of the counterions can be calculated from the effect of scan rate on the intensity of the second anodic peak. In Table (3), the D values calculated from the second anodic peak for the different supporting electrolytes (taking n=1) are given.
Chronoammperometry (CA) was also used for the determination of D and the typical CA curves for the four different supporting electrolytes are shown in Figure (7). The values of D obtained from CA measurements are the average diffusion coefficients of the cation and anion and they are also summarized in Table (3).
3.2.6. Redox reaction on GC/CCG/PANI
Figure 8. The CV of CG (black line), GC/CCG (red line), GC/PANI (green line), GC/CCG/PANI (blue line) in 6 mM K3 [Fe (CN)6] + 0.5 M H2SO4 from +1000 to -200 mV at SR 50 mV s-1 the polymerization potential of aniline is +900 mV for 90s and in 0.5 M H2SO4 as supporting electrolyte.
The synergistic effect between CCG and PANI was investigated in a simple redox system such as potassium ferricyanide. CVs of GC, GC/PANI, CCG and GC/CCG/PANI in 6.0 mM K3 [Fe (CN)6] + 0.5 M H2SO4 are shown in Figure (8) where, PANI was polymerized on GC or GC/CCG at 900 mV for 90 s.
Table 4. The CV results of GC, GC/CCG, GC/PANI and GC/CCG/PANI in 6 mM K3[Fe(CN)6] in 0.5M H2SO4.
Electrode Ipa (µA) Epa (mV) Ipc (µA) Epc (mV)
GC 79.6§ 411§ 78.0§ 482§
GC/CCG 116.6§ 386§ 100.1§ 481§
GC/PANI 268.8, 136.7 and 41.5*
202, 458 and 757*
71.4, 224 and 260*
13, 388 and 726*
GC/CCG/PANI 1000.6, 234 and 231*
253, 507 and 810*
283, 536 and 947*
-22, 336 and 695* *
The values of peak current and potential for 1st, 2nd and 3rd peak, respectively. §
[image:14.596.123.460.73.314.2] [image:14.596.50.547.554.715.2]
The potential window was selected to cover not only the peak related to Fe2+/Fe3+ resox system but also the peaks related to the transformation between PANI forms (the middle peak is related to Fe2+/Fe3+). Comparing between CCG, PANI and CCG/PANI we found that both CCG and PANI provided lower peak currents compared to CCG/PANI by one order of magnitude. This result refers to the synergism between PANI and CCG and table (4) contains the peak currents and potentials obtained for the four electrodes, GC, GC/CCG, GC/PANI and GC/CCG/PANI in 6.0 mM K3 [Fe (CN)6] + 0.5 M H2SO4, respectively.
4. CONCLUSION
Graphene was prepared chemically via microwave method then aniline was electropolymerized on its surface to form CCG/PANI composites which provided higher electrocatalytic activity in monomer free solutions compared to both CCG and PANI.
Optimization of electropolymerization of PANI on the surface of CCG was achieved by studying the effect of polymerization potential and polymerization time.
Different protonic acid was used as dopant and supporting electrolyte for aniline polymerization. The results show that H3PO4 is a “poor” supporting electrolyte for aniline polymerization while H2SO4 provided the higher polymerization charge and higher current acid among the acids used for electropolymerization of aniline on CCG surface. Both HCl and HNO3 provided very comparable results whether in their polymerization charge or in the values peak currents in monomer free solutions.
The effect of scan rate in monomer free solutions which contains different supporting electrolytes as well as CA was studied and the diffusion coefficients of H+ through the polymer layer were calculated. In H2SO4, the highest H+ diffusion coefficient value was obtained.
The doping behaviors of the counterions were investigated by plotting the middle anodic peak current (Ipa2) versus the potential scan rate. H3PO4, HNO3, HCl and H2SO4. The results show that in H3PO4, HNO3, and HCl a linear relationship was obtained which indicates that the doping behavior of these supporting electrolytes are controlled consistently by the surface electron transfer process. While in H2SO4 different behavior at high scan rate was obtained that shows a Fickian diffusion kinetics.
CCG/PANI was also investigated in redox system such as potassium ferricyanide and the synergism between CCG and PANI for electron transfer rate is observed.
ACKNOWLEDGEMENT
The authors would like to express their gratitude to Cairo University (Office of The President) for providing partial financial support. We want also to thank the Faculty of Science Central Laboratory Facilities for the use of AFM and SEM.
References
2. Y. G. Wang, H. Q. Li and Y. Y. Xia, Adv. Mater. 18 (2006) 2619.
3. D. W. Wang, F. Li, J. P. Zhao, W. C. Ren, Z. G. Chen, J. Tan, Z. S. Wu, I. Gentle, G. Q. Lu and H. M. Cheng, ACS Nano 3 (2009) 1745.
4. A.V. Murugan, T. Muraliganth and A. Manthiram, Chem. Mater., 21 (2009) 5004.
5. J. Yan, T. Wei, B. Shao, Z. J. Fan, W. Z. Qian, M. L. Zhang and F. Wei, Carbon 48 (2010) 487. 6. L. L. Zhang, X. S. Zhao and J. S. Wu, Chem. Mater. 22 (2010) 1392.
7. Q. Wu, Y. X. Xu, Z. Y. Yao, A. R. Liu and G. Q. Shi, ACS Nano 4 (2010) 1963.
8. X. S. Zhou, T. B. Wu, B. J. Hu, G. Y. Yang and B. X. Han, Chem. Commun. 46 (2010) 3663. 9. X. B. Yan, J. T. Chen, J. Yang, Q. J. Xue and P. Miele, ACS Appl. Mater. Interf. 2 (2010) 2521. 10.L. Al-Mashat, K. Shin, K. K.-Zadeh, J. D. Plessis, S. H. Han, R.W. Kojima, R. B. Kaner, D. Li,
X.L. Gou, S. J. Ippolito and W. Wlodarski, J. Phys. Chem. C 114 (2010) 16168. 11.Z. X. Wei, M. X. Wan, T. Lin and L. M. Dai, Adv. Mater. 15 (2) (2003) 136. 12.S. das Neves and M. A. De Paoli, Synth. Met. 96 (1998) 49.
13.H. N. Dinh, J.F. Ding, S.J. Xia and V.I. Birss, J. Electroanal. Chem. 459 (1) (1998) 45. 14.C. M. Yang and C.Y. Chen, Synth. Met. 153 (1–3) (2005) 133.
15.J. E. Huang, X. H. Li, J.C. Xu and H.L. Li, Carbon 41 (14) (2003) 2731. 16.D. J. Guo and H.L. Li, J. Solid State Electrochem. 9 (6) (2005) 445.
17.W. Feng, X.D. Bai, Y.Q. Lian, J. Liang, X.G. Wang and K. Yoshino, Carbon 41 (8) (2003) 1551. 18.Y. Mao, Y. Bao, S. Gana, F. Li and L. Niu, Biosensors and Bioelectronics 28 (2011) 291– 297. 19.O. leenearts, B. Partoens and F. M. Peeters, Microelectr. J. 40 (2009) 860.
20.K. S. Novoselov, A. K. Geim, D. Jiang, V. Morozov, Y. Zhang, S. V. Dubonos, I. V. Grigorieva and A. A. Firsov, Science 306 (2004) 666.
21.J. H. Chen, M. Ishigami, C. Jang, D. R. Hines, M. S. Fuhre and E. D. Williams, Adv. Mater. 19 (2007) 3623.
22.S. Mikhailov (ed.), Physics and Applications of Graphene- Experiments, InTech Janeza Trdine, Rijeka, Croatia (2011).
23.J. Wintterling and M.-L. Bocquet, Surf. Sci. 603 (2009) 1841. 24.C. J. Pool, Solid State Commun. 150 (2010) 632.
25.Y. Li, L. Tang and J. Li, electrochem. Commun.11 (2009) 846.
26.Z. P.-Inga, J. S. Murry, M. E. Grice, S. Boyd, C. J. O'Conner and P. Politzer, J. Mol. Struct. Theochem. 549 (2001)147.
27.L. Tang, Y. Wang, Y. Li, H. Feng, J. Lu and J. Li, adv. Funct. Mater 19 (2009) 2782. 28.L. Dong, R. R. S. Gari, Z. Li, M. M. Craig, S. Hou, Carbon 48 (2010) 781.
29.J. Wu, M. Agrawal, H. A. Becerril, Z. Bao, Z. Liu, Y. Chen and P. Peumans, ACS Nano, 4 (2010) 43.
30.J-H. Chen, W. G. Cullen, C. Jang C, M. S. Fuhrer and E. D. Williams, Phys. Rev. Lett. 102 (2009) 236805.
31.P. Lian, X. Zhu, S. Liang, Z. Li, W. Yang and H. Wang, Electrochem. Acta 55 (2010) 3909. 32.J. Wu, Y. Wang, D. Zhang and B. Hou, J. Power Sources 196 (2011) 1141.
33.S. Liu, J. Wang, J. Zeng, J. Ou, Z. Li, X. Liu and S. Yang, J. Power Sources 195 (2010) 4628. 34.K. I. Bolotin, K. J. Sikes, Z. Jiang, M. Klima, G. Fudenberg, J. Hone, P. Kim and H. L. Stormer,
Solid State Commun 146 (2008) 351.
35.R. R. Nair, P. Blake, A. N. Grigorenko, K. S. Novoselov, T. J. Booth, T. Stauber, N. M. R. Peres and A. K. Geim, Science 320 (2008) 1308.
36.M. Zheng, K. Takei, B. Hsia, H. fang, X. Zhang, N. Ferralis, H. Ko, Y.-L. Chueh, Y. Zhang, R. Mabudian and A. Javey, Appl. Phys. Lett. 96 (2010) 063110.
37.D. Li and R. B. Kaner, Science, 320 (2008) 1170.
38.S. Stankovich, D. A. Dikin, G. H. B. Dommett, K. M. Kohlhaas, E. J. Zimney, E. A. Stach, R. D. Piner, S. T. Nguyen and R. S. Ruoff, Nature 442 (2006) 282.
40.Y. Z. Bao, L. F. Cong, Z. M. Huang and Z. X. Weng, J. Mater. Sci. 43 (2008) 390. 41.Q. Li, O. K. Park and J. H. Lee, Adv. Mater. Res. 79 (2009) 2267.
42.T. Jeevananda, Y. K. Jang, J. H. Lee, Siddaramaiah, M. V. D. Urs and C. Ranganathaiah, Polym. Int. 58 (2009) 755.
43.Q. Li, Siddaramaiah, N. H. Kim, G. H. Yoo and J. H. Lee, Compos. Part B 40 (2009) 218.
44.B. M. Renukappa, Siddaramaiah, R. D. S. Samuel, J. S. Rajan and J. H. Lee, J. Mater. Sci. Mater. Electron. 20 (2009) 648.
45.Q. Li, J. W. Kim, T. H. Shim, Y. K. Jang and J. H. Lee, Adv. Mater. Res. 47 (2008) 226. 46.W. Zhang, R. S. Blackburn and A. D.-Sanij, Scripta. Mater. 57 (2007) 949.
47.K. Chrissafis, K. M. Paraskevopoulos, S. Y. Stavrev, A. Docoslis, A. Vassilio and D. N. Bikiaris, Thermochim. Acta 465 (2007) 6.
48.H. Wang, H. Zhang, W. Zhao, W. Zhang and G. Chen, Compos. Sci. Technol. 68 (2008) 238. 49.A. Yu, P. Ramesh, M. E. Itkis, B. Elena and R. C. Haddon., J. Phys. Chem. C, 111 (2007) 7565. 50.A. Debelak, K. Lafdi, Carbon 45 (2007) 1727.
51.X. Chen, Y. P. Zheng, F. Kang and W. C. Shen, J. Phys. Chem. Solids 67 (2006) 1141. 52.S. Ansari and E. P. Giannelis, J. Polym. Sci. Part B: Polym. Phys. 47 (2009) 888.
53.T. Ramanathan, A. A. Abdala, S. Stankovich, D. A. Dikin, M. H. Alonso, R. D. Piner, D. H.
Adamson, H. C. Schniepp, X. Chen, R. S. Ruoff, S. T. Nguyen, I. A. Aksay, R. K. Prud'Homme and L. C. Brinson, Nat. Nanotechnol. 3 (2008) 327.
54.Y. R. Lee, A. V. Raghu, H. M. Jeong and B. K. Kim, Macromol. Chem. Phys. 210 (2009) 1247. 55.Y. Xu, Y. Wang, J. Liang, Y. Huang, Y. Ma, X. Wan and Y. Chen, Nano Res. 2 (2009) 343. 56.H. Quan, B. Zhang, Q. Zhao, R. K. K. Yuen and R. K. Y. Li, Compos. Part A, 40 (2009) 1506. 57.G. Eda and M. Chhowalla, Nano Lett. 9 (2009) 814.
58.J. Liang, Y. Xu, Y. Huang, L. Zhang, Y. Wang, Y. Ma, F. Li, T. Guo and Y. Chen, J. Phys. Chem. 113 (2009) 9921.
59.H. Wang, Q. Hao, X. Yang, L. Lu and X. Wang, ACS Applied Mater. Interf. 2 (2010) 821. 60.W. S. Hummers and R. E. Offeman, J Am. Chem. Soc. 80 (1958)1339.
61.H. M. A. Hassan, V. Abdelsayed, A. S. Khder, K. M. AbouZeid, J. Terner, M. Samy El-Shall, S. I. Al-Resayes and A. A. El-Azhary, J. Mater. Chem. 19 (2009) 3832.
62.J.-J. Shi, G.-H. Yang and J.-J. Zhu, J. Mater. Chem. 21 (2011) 7343. 63.M. H. P.-Azar, B. Habibi, Electrochim. Acta 52 (2007) 4222. 64.S. Nakabayashi and A. Kira, J. Phys. Chem. 96 (1992) 1021.
65.W.-C. Chen, T.-C. Wen and A. Gopalan., Synth. Met. 128 (2002) 179.
66.S. E. Moulton, P. C. Innis, L. A. P. K.-Maguire, O. Ngamna and G. G. Wallace, Curr. Appl. Phys. 4 (2004) 402.
67.Z. Zhenga, Y. Dua, Q. Fenga, Z. Wanga and C. Wanga, J. Mol. Catal. A-Chem. 80 (2012) 353. 68.M. Sniechowski, Structure and Dynamics of Conduction Polyaniline Based Compounds, PhD thesis, AGH University of Science and Technology, faculty of Physics and Computer Science, Poland, 2005.
69.X.-G. Zhang, Y. Murakami, K. Yahikozawa and Y. Takasu, Electrochim. Acta, 42, (1997) 223. 70.A. J. Motheo, J. R. Santos Jr, E. C. Venancio and L. H. C. Mattoso, Polymer 39 (1998) 6977. 71.Watanabe, K. Mori, M. Mikuni, Y. Nakamura and M. Matsuda, Macromolecules 22 (1989) 3323. 72.Watanabe, K. Mori, Y. Iwasaki, Y. Nakamura and S. Niizuma, Macromolecules 20 (1987) 1793. 73.E .M. Genies and M. Lapkowski, J. Electroanal. Chem., 236 (1987) 189.
74.D. Orata and D. A. Buttry, J. Am. Chem. Soc. 109 (1987) 3574.
Supplementary Figures and Tables:
(A)
(B)
(A)
(B)
S (2): A) The CVs showing the effect of polymerization time of aniline on GC/CCG, —20s, ··· 30s, –··–60s and ─ ─ ─ 90s and –·–·– 120s, B) A plot of polymerization time and 1st
(solid line), 2nd (dotted line) and 3rd (dashed line) anodic peak current and C) A plot of polymerization time and 1st (solid line), 2nd (dotted line) and 3rd (dashed line) cathodic peak current in 0.5 M H2SO4 from -200 to 1000 mV at SR 50 mV s-1.
(C) (D)
S(3). The CVs of GC/CCG/PANI polymerized in A) H3PO4, B) HCl, C) HNO3 and D) H2SO4 at various SR (from 10 to100 mV s-1) recorded from -200 to 1000 mV in monomer free solution.
S (4). The total charge passed through the aniline electropolymerization at various polymerization times on GC/CCG as well as the corresponding estimated PANI film thickness.
Polymerization time (s)
Charge (mC)
Estimated thickness (µm)
Ipa (µA) Epa (mV) Ipc (µA) Epc (mV)
1st 2nd 3rd* 1st 2nd 3rd* 1st 2nd 3rd* 1st 2nd 3rd*
20 8.87 2.37 184 39.6 50 233.6 498.5 780 69 63.2 45 100 463.3 741.7
30 17.08 4.57 445.3 172.5 83 245 527 791 204 198 212 68.5 559.5 794
60 23.9 6.4 549 110 243 220 500 783 326 136.8 482 40.3 453 732
90 45.7 12.2 979 208 458 235 510 790 609 240 880 30.7 449 727
120 70.25 18.8 1052 182 531 268.5 543 832 635 343 969 14.7 410 693
*
The values of peak current and potentials that observed for 1st, 2nd and 3rd peak in both cathodic and anodic directions.
© 2012 by ESG (www.electrochemsci.org)
![Table 4. The CV results of GC, GC/CCG, GC/PANI and GC/CCG/PANI in 6 mM K3[Fe(CN)6] in 0.5M H2SO4](https://thumb-us.123doks.com/thumbv2/123dok_us/1930656.152600/14.596.123.460.73.314/table-results-gc-ccg-gc-pani-ccg-pani.webp)