Int. J. Electrochem. Sci., 9 (2014) 8106 - 8119
International Journal of
ELECTROCHEMICAL
SCIENCE
www.electrochemsci.org
Investigation of Novel Gemini Surfactant with Long Chain
Alkyl Ammonium Headgroups as Corrosion Inhibitor for
Copper in 3.5% NaCl
Kun Cao, Huyuan Sun, Xia Zhao*, Baorong Hou
Key Laboratory of Marine Environmental Corrosion and Bio-fouling, Institute of Oceanology, Chinese Academy of Sciences, Qingdao 266071, China
*
E-mail: zhxiakk@163.com
Received: 30 August 2014 / Accepted: 12 October 2014 / Published: 28 October 2014
Inhibiting effect of the novel gemini surfactant on copper was investigated in 3.5% NaCl solution using weight loss and electrochemical measurements. Presence of inhibitor and increase of concentration greatly decrease corrosion rate, parameters determined from polarization curves and EIS plots show that inhibitor decreased both cathodic and anodic current densities, suppressed charge transfer process by adsorption on copper surface. Thermodynamic calculation indicates chemisorption obeys the Langmuir adsorption isotherm. Quantum chemical calculation reveals that inhibitor molecules suppress copper corrosion via formation of N-Cu complex. Relationships between inhibition efficiency and molecular orbital were also evaluated.
Keywords: Copper; EIS; Polarization; Gemini surfactant; Quantum chemical calculation; 1,4-bis(dodecy dipropyl ammonium bromide)-butane
1. INTRODUCTION
Copper has been an important material in industry owing to its plenty of favourable properties, such as high electrical and thermal conductivities, mechanical workability and its relatively noble properties [1, 2]. It is widely used in many applications in electronic industries and communications as a conductor in electrical power lines, pipelines for domestic and industrial water utilities including sea water, heat conductors, heat exchangers, etc [3, 4].
protection of copper, when the concentration of Cl– is high, is a fundamental academic and industrial concern that received a considerable amount of attention [8-11].
So far, the use of organic inhibitors to protect copper is one of the most important methods. Organic compounds containing polar groups including nitrogen, sulfur and oxygen with polar functional groups and conjugated double bonds have been reported to inhibit copper corrosion [12-19]. N-heterocyclic compounds are considered to be the most effective corrosion inhibitors on copper in chloride media [20-24]. They exert inhibition action via adsorption on the copper surface blocking the active sites by forming a compact barrier film to decrease corrosion rate. The adsorption of N-heterocyclic inhibitor takes place through heteroatom, as well as those with conjugated double bonds or aromatic rings in their molecular structures [25-28]. By considering increasing the strength of bonding between copper and the organic molecule, various derivatives were investigated, changing the number or position of substituent groups and nitrogen atoms on the azole ring, or adding another heteroatom like sulphur [29-31]. For instance, triazole and its amino derivatives, tetrazole, pyrazole and imidazole have been suggested [32-35]. Furthermore, the research in the field of eco-friendly corrosion inhibitors has been addressed toward the goal of using cheap, effective chemicals at low or free environment impact. In latest trend many alternative inhibitors including thiazole derivatives, cysteine and substituted uracil were studied [36-39]. In our previous work five green triazole fungicides had been studied as good inhibitors for copper in synthetic seawater [40-42].
As another important N containing compound, gemini surfactants could be deemed as good potential inhibitors owing to containing electronegative N atom and long hydrophobic chain. In addition, they are biodegradable, this makes the investigation of their inhibiting properties significant in the context of the current priority to produce inhibitors with low environment impact.
The aim of this paper is to present the remarkable inhibiting properties of the cationic gemini surfactant, 1,4-bis(dodecy dipropyl ammonium bromide)-butane (C12C4C12(C3)Br2), which consist of
only the basic units of N and long hydrophobic carbon chain. This surfactant has many advantages such as low cost and easy production. In order to extend the gemini surfactant as corrosion inhibitor for copper in neutral chloride media, weight loss, potentiodynamic polarization curves and electrochemical impedance spectroscopy (EIS) are employed to evaluate corrosion rate of freshly abraded copper and inhibition efficiencies of the inhibitor in 3.5% NaCl solution. In addition, the adsorption isotherm of inhibitor on copper surface is obtained. Quantum chemical parameters are calculated and discussed in detail. It is expected to provide useful information on the adsorption and inhibition effect of inhibitors on copper.
2. EXPERIMENTAL DETAILS
2.1. Materials and sample preparation
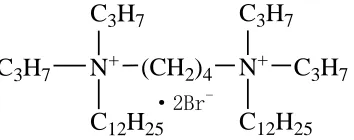
N+ (CH2)4 N+ C3H7
C3H7
C12H25
C3H7 C3H7 C12H25 ·2Br
-Figure 1. The sturcture of C12C4C12(C3)Br2
The copper specimens (99.99%) for weight loss experiment were mechanically cutted into 30 mm × 15 mm × 5 mm dimensions. For electrochemical experiments, the specimens were embedded in epoxy resin with a geometrical surface area of 1 cm2 exposed to the electrolyte. Prior to all measurements, the samples were abraded with emery paper from 800 to 2000 grit, respectively, degreased ultrasonically in acetone, and dried at room temperature.
2.2. Weight loss experiment
Copper specimens in triplicate were immersed in 3.5% NaCl solution with different concentrations of C12C4C12(C3)Br2 (10-100 mg/L) for 14 days. After that, the specimens were removed
from the solution, rinsed in 0.1 mol/L HCl, distilled water and acetone, finally dried and weighed. Weight loss experiments were used to calculate the corrosion rate (W, mg m–2 h–1). The obtained inhibition efficiency (ηe) was evaluated by
0 eW
0
-=W W 100%
W
(1)
where W0and W are the corrosion rate of copper in the solution without and with the inhibitor,
respectively.
2.3. Electrochemical experiments
The electrochemical measurements were conducted with PARSTAT 2273 Potentiostat/Galvanostat (Princeton Applied Research) in a conventional three-electrode cell system. A copper specimen and a platinum electrode were used as working electrode and counter electrode, respectively. A saturated calomel electrode (SCE) with a Luggin capillary was used as reference electrode. All potentials were measured versus SCE and all tests were performed in non-deaerated solutions at 298 K.
The polarization curves were obtained from –250 to +250 mV (versus open circuit potential) with 0.5 mV/s scan rate, and the data were collected and analyzed by electrochemical software PowerSuite ver. 2.58. The obtained inhibition efficiency was calculated by
0,corr corr ei
0,corr
-=i i 100%
i
(2)
where icorr and i0,corr are the corrosion current density of copper with and without the inhibitor in
[image:3.596.212.389.72.142.2]
EIS measurements were carried out at the open circuit potential. The ac frequency range extended from 100 kHz to 10 mHz with a 10 mV peak-to-peak sine wave as the excitation signal. Then the impedance data were analyzed and fitted. The inhibition efficiency obtained from EIS measurements was calculated by
ct 0,ct eR
ct
100%
R R
= R
(3)
where Rct and R0,ct represent the resistance of charge transfer in the presence and absence of the
inhibitor, respectively.
2.4. Quantum chemical calculation
The molecular structure was fully geometrically optimized by PM3 method using Hyperchem 7.5. The following calculated quantum chemical parameters, such as the total energy, the highest occupied molecular orbital energy (EHOMO) and the lowest unoccupied molecular orbital energy
(ELUMO), energy gap (ΔE=EHOMO-ELUMO) were considered.
3. RESULTS AND DISCUSSION
3.1. Polarization measurement
-9 -8 -7 -6 -5 -4 -3 -2 -1
-0.6 -0.5 -0.4 -0.3 -0.2 -0.1 0.0 0.1 0.2
Blank 10 mg/L 20 mg/L 30 mg/L 50 mg/L 100 mg/L
E
(
V
/S
C
E
)
log i (A/cm2)
C12C4C12(C3)Br2
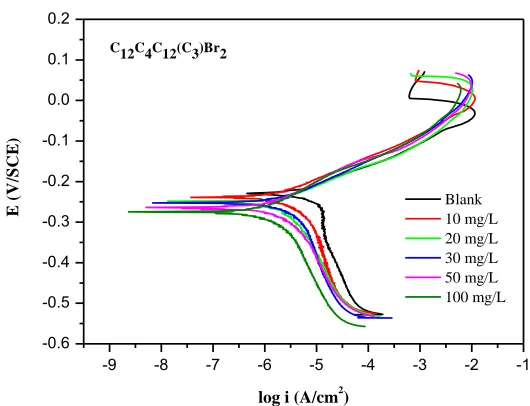
Figure 2. Polarization curves of copper in 3.5% NaCl solution with different concentrations of C12C4C12(C3)Br2 at 298K
[image:4.596.153.418.446.649.2]
polarization curves move directly to lower current densities, and the corrosion rate of copper has been decreased significantly. Anode curves are nearly overlap and each cathode curve is exactly parallel with the others, which indicates that the mechanism of the anodic and cathodic reactions is not changed by the addition of C12C4C12(C3)Br2, and the corrosion processes are controlled just by
restraining the rates of cathodic reactions [43, 44].
From the anodic polarization curves in Fig. 2, it shows that the peak current density (ipeak)
decreases. It is likely that the inhibitor molecules have adsorbed onto the copper surface, which could decrease the oxidation rate of the initial step of copper corrosion [45-49]. Therefore, it might be difficult for the corrosion to proceed to the next step.
The electrochemical parameters such as Ecorr, icorr, anodic and cathodic Tafel slopes (βa, βc)
obtained from polarization curves are listed in Table 1. It can be seen that the values of icorr are greatly
decreased in the presence of the inhibitor, and the inhibition efficiencies calculated from icorr increase
with the concentration of these compounds. The ηe values of C12C4C12(C3)Br2 at each concentration are
extremely high, and the maximum values of the efficiencies are 95.1% at the 100 mg/L within the concentration range of our research. The shift of βa and βc indicates that the oxidizing dissolution as
well as the oxygen reduction is suppressed by the adsorption of C12C4C12(C3)Br2. Compared with the
blank, the Ecorr values move slightly in the negative direction, and all the displacements are less than 85
mV. Therefore, it confirms that the inhibitor acts as mixed-type corrosion inhibitors which suppress both anodic and cathodic reaction by adsorbing on the copper surface [50]. However, Fig. 2 further reveals that the cathodic suppression plays a dominant role in this process [48].
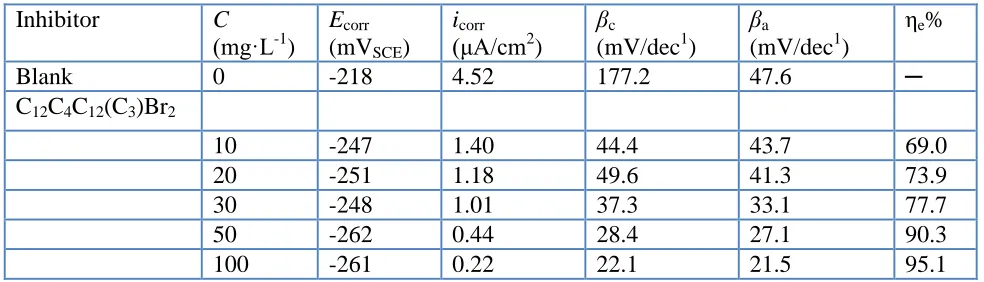
Table 1. Potentiodynamic polarization parameters of copper in 3.5% NaCl solution with different concentrations of inhibitors at 298 K
Inhibitor C
(mg·L-1
)
Ecorr
(mVSCE)
icorr
(μA/cm2
)
βc
(mV/dec1)
βa
(mV/dec1)
ηe%
Blank 0 -218 4.52 177.2 47.6 ─
C12C4C12(C3)Br2
10 -247 1.40 44.4 43.7 69.0
20 -251 1.18 49.6 41.3 73.9
30 -248 1.01 37.3 33.1 77.7
50 -262 0.44 28.4 27.1 90.3
100 -261 0.22 22.1 21.5 95.1
3.2. EIS measurement
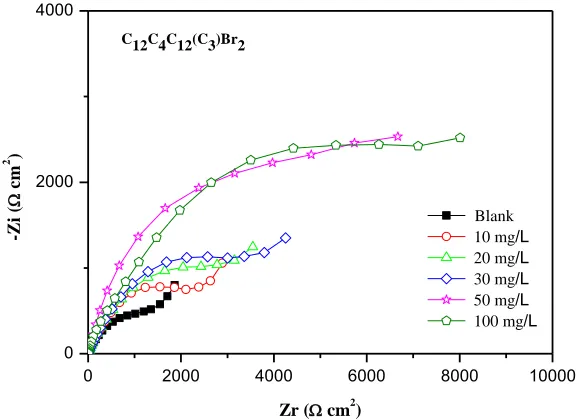
Nyquist plots with and without C12C4C12(C3)Br2 are given in Fig. 3. The impedance spectra
[image:5.596.53.545.478.619.2]
0 2000 4000 6000 8000 10000
0 2000 4000
-Z
i
(
c
m
2 )
Zr ( cm2)
Blank 10 mg/L 20 mg/L 30 mg/L 50 mg/L 100 mg/L C12C4C12(C3)Br2
Figure 3. Nyquist diagrams for copper in 3.5% NaCl solution with different concentrations of C12C4C12(C3)Br2
Considering the formation of adsorbed inhibitor layer at the higher frequency as well as the corroding interface at the lower frequency, the impedance data could be appropriately interpreted using the equivalent circuit shown in Fig. 4, in which Rs represents the solution resistance between the
working electrode and the reference electrode, Rf the resistance of the film formed on the copper
surface, Rct the charge-transfer resistance, CPEf and CPEdl the constant phase angle elements (CPE)
modelling the capacitance of protective film Cf and the electrical double layer Cdl, respectively. The
[image:6.596.145.437.93.303.2]exponent n (0≤n≤1) denotes the deviation parameter which is introduced to characterize the above relation takes into account the deviation from the ideal capacitance behaviour in terms of a distribution of time constants due to inhomogeneity, roughness effects, adsorption of inhibitor, and formation of porous layers and variations in properties or compositions of surface layers [51].
[image:6.596.127.466.576.720.2]
Table 2 shows the fitted electrochemical parameters of C12C4C12(C3)Br2. It is noticeable that
the addition of C12C4C12(C3)Br2 increases the Rct and this effect seems to be enhanced upon the
increasing of the inhibitor concentration. It reveals that the charge transfer process as well as the migrating of Cl–, which is the control step of the corrosion mechanism, has been effectively inhibited with the addition of the inhibitor. Compared with the blank, the values of Rf exhibit a positive
correlation with the increasing concentration of inhibitor.
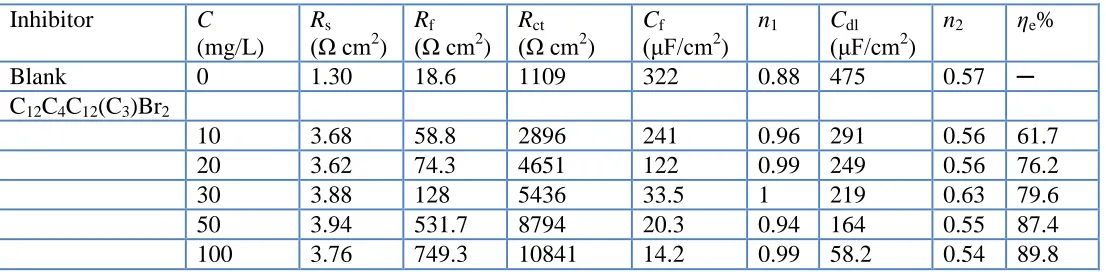
Table 2. Impedance parameters of copper in 3.5% NaCl solution with different concentrations of inhibitors at 298 K
Inhibitor C
(mg/L) Rs
(Ω cm2
) Rf
(Ω cm2
) Rct
(Ω cm2
) Cf
(μF/cm2
)
n1 Cdl
(μF/cm2
)
n2 ηe%
Blank 0 1.30 18.6 1109 322 0.88 475 0.57 ─
C12C4C12(C3)Br2
10 3.68 58.8 2896 241 0.96 291 0.56 61.7
20 3.62 74.3 4651 122 0.99 249 0.56 76.2
30 3.88 128 5436 33.5 1 219 0.63 79.6
50 3.94 531.7 8794 20.3 0.94 164 0.55 87.4
100 3.76 749.3 10841 14.2 0.99 58.2 0.54 89.8
Furthermore, it is also shown in Table 2 that the values of Cf and Cdl exhibit a decreasing
tendency with the increasing of inhibitor concentration. This finding is probably attributed to the gradual replacement of water molecules by the adsorption of the organic molecules at metal/solution interface, which leads to the formation of a protective inhibitor film by adsorbing on the metal surface. Generally, the capacitance of protective film Cf and the electrical double layer Cdl could be calculated
by the following equations [52]:
2 f 4 F S C = RT (4) 0 dl
C = S
d
(5)
here S is the geometrical surface area of the electrode exposed to the corrosive solution, d is the thickness of the protective layer, 0 is the permittivity constant of the air, is the local dielectric
constant of the film and F is the Faraday constant. Accordingly, the decrease of Cf could be explained
by the increase in the adsorption film area of inhibitor which decreases the exposed electrode surface area. By the same token, the decrease of Cdl reveals the decrease in the local dielectric constant or the
increase in the double layer thickness. As a result, the diffusion process of ions from the interface to the solution involved in active corrosion is probably to be retarded
The inhibition efficiencies calculated from Rct also increase with the increasing inhibitor
concentration, and reach the maximum 89.8% at the 100 mg/L within the concentration range of our research. Thus, due to the adsorption of C12C4C12(C3)Br2 on copper/solution interface, the dissolution
[image:7.596.24.577.240.376.2]
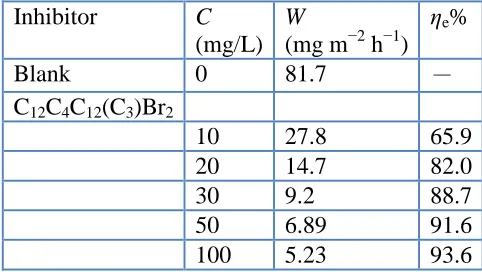
3.3. Weight loss measurement
The effect of C12C4C12(C3)Br2 addition at various concentrations on the copper corrosion in
3.5% NaCl solution was studied by weight loss measurement at 298 K after 14 d immersion. The inhibition efficiency (ηe) and corrosion rate (W, mg m–2 h–1) obtained are listed in Table 3. The
corrosion rate decreases obviously as the compounds are added into the solution, and the inhibition efficiency increases with the increasing inhibitor concentration from 10 to 100 mg/L. All the inhibition efficiencies have high values at each concentration, which indicates a good inhibition performance of C12C4C12(C3)Br2 for the corrosion of copper in 3.5% NaCl solution. The maximum values of ηe reach
[image:8.596.177.418.320.456.2]93.6%. As a result, the corrosion rate is reduced greatly by restraining the dissolution of copper and/or the diffusion of oxygen to the copper surface [44].
Table 3. Weight loss results of copper immersed in 3.5% NaCl solution with different concentrations of inhibitors at 298 K for 14 days
Inhibitor C
(mg/L) W
(mg m−2 h−1) ηe%
Blank 0 81.7 -
C12C4C12(C3)Br2
10 27.8 65.9
20 14.7 82.0
30 9.2 88.7
50 6.89 91.6
100 5.23 93.6
Generally, weight loss experiment gives average corrosion rate during the 14 d immersion, while the electrochemical techniques give instantaneous corrosion rate at the testing moment [53]. Thus, the inhibition efficiencies obtained from weight loss measurement have a little difference from the electrochemical experiments. However, the results are in good agreement with the results obtained from polarization and EIS.
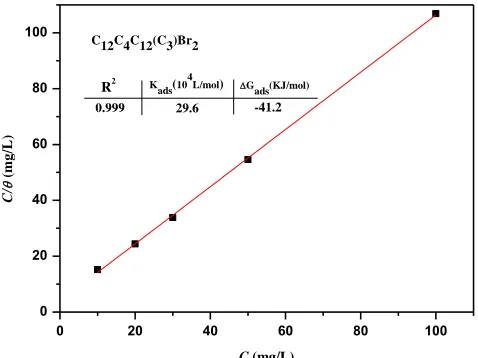
3.4. Adsorption isotherm
It is widely acknowledged that the adsorption isotherm is an effective way to explain the adsorption mechanism of the inhibitors. The interaction between the inhibitor molecules and the metal surface could also be reflected in this method. Results obtained from weight loss method are involved to study the adsorption of C12C4C12(C3)Br2 on the copper surface. The coverage θ by inhibitor
molecules on metal surface, which is one of the primary causes of corrosion inhibition, has been experimentally determined by weight loss method in our previous research. Experientially, applied assumption that θ≈ηe looks reasonable, although almost linear function exists between them.
In order to determine the best fit for θ to various isotherms, several adsorption isotherms were considered, such as Langmuir, Temkin, and Frumkin isotherms [54]. Results reveal that the Langmuir isotherm (Eq. 6) provides the best description for the adsorption behaviour of C12C4C12(C3)Br2.
ads
1 K C
(6)
here Kads is the equilibrium constant of the inhibitor adsorption process, C is the concentration
of inhibitors. The plots of C/θ vs. C give a straight fitting line as presented in Fig. 5. It can be seen that the linear relationship of the fitted results from weight loss measurement is in good agreement. The linear correlation coefficients of C/θ vs. C and the slopes are all close to 1.0, indicating that the adsorption of C12C4C12(C3)Br2 on the copper surface at 298 K obeys the Langmuir adsorption isotherm
quite well.
0 20 40 60 80 100
0 20 40 60 80 100 C/ (m g /L )
C (mg/L)
29.6 -41.2 0.999
Gads(KJ/mol) Kads(104L/mol)
C12C4C12(C3)Br2
R2
Figure 5. Langmuir adsorption isotherm of C12C4C12(C3)Br2 on the surface of copper in 3.5% NaCl
solution at 298 K
Hence, C12C4C12(C3)Br2 probably exhibits a monomolecular layer adsorption characteristic on
copper surface. According to the Langmuir adsorption isotherm, the relation of adsorption constant Kads to the standard free energy of adsorption ∆G0ads can be expressed by the following equation [55,
56]: 0 ads ads Δ 1 exp 55.5 G K RT
(7)
here Kads values can be calculated from the intercepts of the straight lines on the C/θ axis.
∆G0
ads and Kads of the adsorption process are listed in Fig. 5.
It has been a matter of common practice that if the absolute value of ∆G0
ads is lower than 20
kJ/mol, the type of adsorption is regarded as physisorption, and the corrosion inhibition takes action due to the electrostatic interaction between the charged molecules and the charged metal. If the absolute value of ∆G0
ads is higher than 40 kJ/mol, it functions by chemisorption due to the covalent
[image:9.596.171.410.277.456.2]
The absolute value of ΔG0ads is 41.2 kJ/mol, higher than 40 kJ/mol. This denotes that the
adsorption on copper surface is the chemisorption and they link to the surface by weak covalent bonds. In the view of our previous research [44, 56, 59], this type adsorption of inhibitor molecules acting on metal surface is: the chemical interaction between the N atoms and the vacant hybrid orbital of metal surface atoms.
3.5. Quantum chemistry calculation
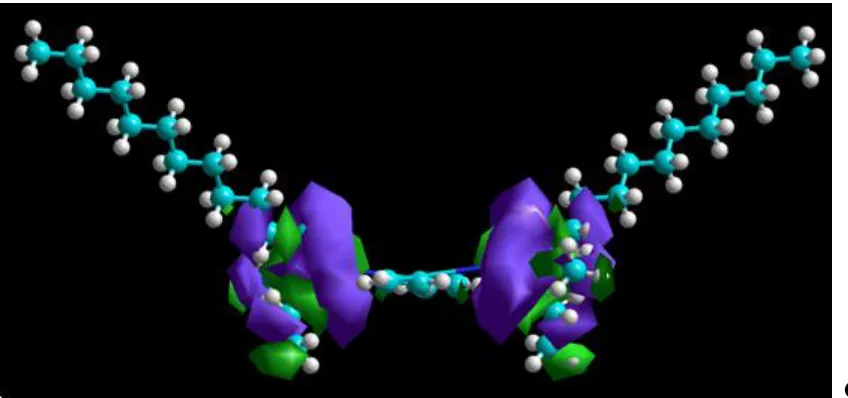
Full optimized minimum energy geometrical configuration of C12C4C12(C3)Br2 is shown in Fig.
6 (A). It can be seen that the molecule shows a general planar structure, which consists of two N atoms and two long hydrophobic carbon chains. This basic structure unit of gemini surfactant may be in favour of the most orderly arrangement if molecule adsorbed on the copper surface at nearly 90° contact angle.
A
C
Figure 6. Quantum chemistry calculations results of C12C4C12(C3)Br2 molecule: Optimism geometry
(A); Population of HOMO (B); Population of LUMO (C)
The calculated quantum chemical parameters such as EHOMO, ELUMO, ∆E, ionization potential
(I), electron affinity (A) and fraction of transferred electrons (∆N) are also listed in Table 4. ∆N can be calculated using the following equation [60, 61]:
Cu inh
Cu inh
-Δ =
2| + |
N
(8)
where χCu and χinh denote the absolute electro negativity of copper and the inhibitor molecule,
respectively; ηCu and ηinh denote the absolute hardness of copper and the inhibitor molecule,
respectively. These quantities are related to electron affinity (A) and ionization potential (I) as follows.
= 2
I A
(9)
= 2
I A
(10)
Table 4. Quantum chemical parameters derived for C12C4C12(C3)Br2 molecule
Inhibitor EHOMO
(eV)
ELUMO
(eV)
∆E (eV)
I=-EHOMO A=-ELUMO χ η ∆N
C12C4C12(C3)Br2 -8.84 1.32
-10.16
8.84 -1.32 3.76
-5.08
0.370
In order to calculate the fraction of electrons transferred, a theoretical value for the absolute electronegativity of copper according to Pearson is used χCu=463.1 kJ/mol [62], and a global hardness
of ηCu=0 kJ/mol, by assuming that for a metallic bulk I=A, because they are softer than the neutral
[image:11.596.83.507.69.268.2]
It has been reported that the value of ∆N shows inhibition effect resulted from electrons donation. According to Lukovits equation [61], the inhibition efficiency of C12C4C12(C3)Br2 would
increase with increasing ∆N at the metal surface due to ∆N<3.6 [53].
As seen from Fig. 6 (B) (C), the HOMO and LUMO distribute around N atoms. EHOMO is often
associated with the electron donating ability of a molecule and a high value of EHOMO is likely to
indicate a tendency of the molecule to donate electrons to appropriate acceptor with low energy, unoccupied molecular orbital. Conversely, ELUMO indicates the ability to accept electrons, the lower the
value of ELUMO means the more probability to accept electrons. Consequently, concerning the ΔE value
of a corrosion inhibitor molecule, a lower value of the energy gap will cause higher inhibition efficiency [64, 65].
4. CONCLUSION
C12C4C12(C3)Br2 is a good gemini-type inhibitor for the anti-corrosion of copper in 3.5% NaCl
solution. The inhibition efficiency increases with the inhibitor concentration. The values of the inhibition efficiency obtained from the polarization curves are 95.1% at 100 mg/L concentration, which are in good agreement with the data obtained from weight loss test (93.6%). Polarization curves suggest that C12C4C12(C3)Br2 belong to mixed-type inhibitor, nevertheless the cathodic suppression is
susceptible to play a dominant role. EIS results indicate that the good inhibition performance attributes to the protective adsorption film of the compounds formed on copper surface. Quantum chemical calculations reveal that inhibitor molecules suppress the copper corrosion via formation of N-Cu complex.
ACKNOWLEDGMENTS
The author gratefully acknowledges the Key Projects in the National Science & Technology Pillar Program during the Twelfth Five-year Plan Period of China (No. 2012BAB15B01) and National Department Public Benefit Research Foundation (No. 201005028).
References
1. X. N. Liao, F. H. Cao and L. Y. Zheng, Corros. Sci., 53 (2011) 3289-3298. 2. J. Zhang and G. M. Qiao, Corros. Sci., 53 (2011) 147-152.
3. L. J. Feng and H. Y. Yang, Electrochim. Acta, 58 (2011) 427-436. 4. K. F. Khaled, Corros. Sci., 52 (2010) 3225-3234.
5. F. Rosalbino and R. Carlini, Corros. Sci., 58 (2012) 139-144.
6. H. O. Curkovic, E. S. Lisac and H. Takenouti, Corros. Sci., 52 (2010) 398-405. 7. B. Y. Liu and H. X. Xi, Appl. Surf. Sci., 258 (2012) 6679-6687.
8. P. Lowmunkhong, D. Ungthararak and P. Sutthivaiyakit, Corros. Sci., 52 (2010) 30-36. 9. A. Dermaj, N. Hajjaji, S. Joiret, K. Rahmounia, A. Srhiri, H. Takenouti and V. Vivier,
Electrochim. Acta, 52 (2007) 4654-4662.
12.H. O. Curkovic, E. Stupnisek-Lisac and H. Takenouti, Corros. Sci., 51 (2009) 2342-2348.
13.K. Rahmounia, N. Hajjaji, M. Keddama, A. Srhiri and H. Takenouti, Electrochim. Acta, 52 (2007) 7519-7528.
14.S. Issaadi, T. Douadi, A. Zouaoui and S. Chafaa, Corros. Sci., 53 (2011) 1484-1488. 15.H. Ashassi-Sorkhabi and E. Asghari, Electrochim. Acta, 54 (2008) 162-167.
16.M. A. Hegazy, H. M. Ahmed and A. S. Ei-Tabei, Corros. Sci., 53 (2011) 671-678.
17.E. M. Sherif, R. M. Erasmus and J. D. Comins, J. Colloid Interface Sci., 309 (2007) 470-477. 18.S. D. Deng, X. H. Li and H. Fu, Corros. Sci., 53 (2011) 822-828.
19.D. B. Huang, J. Y. Hu, G. Song and X. P. Guo, Electrochim. Acta, 27 (2011) 10166-10178. 20.S. Hong and W. Chen, Corros. Sci., 66 (2013) 308-314.
21.S. Hong and W. Chen, Corros. Sci., 57 (2012) 270-278. 22.X. M. Wang and H. Y. Yang, Corros. Sci., 53 (2011) 113-121. 23.Q. Q. Liao and Z. W. Yue, Corros. Sci., 53 (2011) 1999-2005.
24.M. M. Solomon and S. A. Umoren, Corros. Sci., 52 (2010) 1317-1325. 25.T. T. Qin and J. Li, Corros. Sci., 53 (2011) 1072-1078.
26.M. B. Valcarce and M. Vázquez, Corros. Sci., 52 (2010) 1413-1420. 27.H. O. Curkovic and E. Stupnisek-Lisac, Corros. Sci., 52 (2010) 398-405. 28.J. Novakovic and J. Wodzinska, J. Mater. Eng. Perorm., 38(2005)293-297.
29.M. M. Antonijevic, S. M. Milic and M. B. Petrovic, Corros. Sci., 51 (2009) 1228-1237. 30.S. Varvara and L. M. Muresan, Corros. Sci., 50 (2008) 2596-2604.
31.M. P. Desimone, G. Grundmeier, G. Gordillo and S. N. Simison, Electrochim. Acta, 8 (2011) 2990-2998.
32.M. Finsgar and I. Milosev, Corros. Sci., 52 (2010) 2737-2749. 33.El-Sayed M. Sherif, J. Mater. Eng. Perorm., 19 (2010) 873-879. 34.W. H. Wang and Z. Li, Corros. Sci., 61 (2012) 101-110.
35.X. Q. Xu and L. Q. Zhu, Appl. Surf. Sci., 257 (2011) 5524-5528.
36.F. Bentiss, B. Mernari, M. Traisnel and H. Vezin, Corros. Sci. 53 (2011) 487-495. 37.U. Ghani and N. Ullah, Bioorg. Med. Chem., 18 (2010) 4042-4048.
38.B. D. Mert and M. E. Mer, Corros. Sci., 53 (2011) 4265-4272.
39.M. M. Antonijević and S. M. Milić, Corros. Sci., 51 (2009) 1228-1237.
40.W. H. Li, L. C. Hu, S. S. Zhang and B. R. Hou, Corros. Sci., 53 (2011): 735-745.
41.W. H. Li, L. C. Hu, Z. H. Tao, H. W. Tian and B. R. Hou, Mater. Corros., 62 (2011) 1042-1050. 42.H. W. Tian, W. H. Li and B. R. Hou, Corros. Sci., 53 (2011) 3435-3445.
43.E. M. Sherif, J. Appl. Surf. Sci., 252 (2006) 8615-8623.
44.L. C. Hu, S. S. Zhang, W. H. Li and B. R. Hou, Corros. Sci., 52 (2010) 2891-2896. 45.M. Scendo, Corros. Sci., 50 (2008) 1584-1592.
46.H. Otmačić and E. Stupnišek-Lisac, Electrochim. Acta, 48 (2003) 985-991.
47.E. M. Sherif, R. M. Erasmus and J. D. Comins, J. Colloid. Interface. Sci., 309 (2007) 470-477. 48.K. F. Khaled, Mater. Chem. Phys., 125 (2011) 427-433.
49.E. McCafferty, Corros. Sci., 47 (2005) 3202–3215.
50.Y. Yan, W. H. Li, L. K. Cai and B. R. Hou, Electrochim. Acta, 53 (2008) 5953–5960. 51.K. M. Ismail, Electrochim. Acta, 52 (2007) 7811-7819.
52.I. Ahamad, R. Prasad and M. A. Quraishi, Corros. Sci., 52 (2010) 1472-1481. 53.S. D. Deng and X. H. Li, Corros. Sci., 55 (2012) 407-415.
54.W. H. Li, Q. He, C. L. Pei and B. R. Hou, Electrochim. Acta, 52 (2007) 6386-6394. 55.M. Scendo, Corros. Sci., 49 (2007) 373-390.
56.W. H. Li, X. Zhao, F. Q. Liu and B. R. Hou, Corros. Sci., 50 (2008) 3261-3266. 57.F. M. Donahue and K. Nobe, J. Electrochem. Soc., 112 (1965) 886-891.
60.K. F. Khaled, Mater. Chem. Phys., 112 (2008) 104-111. 61.I. Lukovits, E. Kalman and F. Zucchi, Corros., 57 (2001) 3-8. 62.L. Li and Q. Qu, Corros. Sci., 59 (2012) 249-257.
63.R. Valdez, L. M. Martinez-Villafane and D. Glossman-Mitnik, J. Mol. Struct.: Theochem, 716 (2005) 61-65.
64.J. M. Bastidas, P. Pinilla, E. Cano, J. L. Polo and S. Miguel, Corros. Sci. 45 (2003) 427-449. 65.N. Khalil, Electrochim. Acta, 48 (2003) 2635-26.