Int. J. Electrochem. Sci., 9 (2014) 7059 - 7068
International Journal of
ELECTROCHEMICAL
SCIENCE
www.electrochemsci.org
Characterization and Process Optimization of a MEA Reactor
for Ozone Production in Deionized Water
Longyao Wang*, Yi Zhang, Lan Wang
Jiangsu Key Laboratory of Advanced Catalytic Materials and Technology, School of petrochemical engineering, Changzhou University, Changzhou 213164, China
*
E-mail: [email protected]
Received: 8 August 2014 / Accepted: 17 September 2014 / Published: 29 September 2014
A MEA (membrane electrode assemblies) reactor has been developed and applied to produce ozone in deionized water under low cell voltage. In this work, the electrolytic process was investigated and optimized. The results show that the ozone concentration was more than 0.1%wt in the mixture gas (3.2Lmin-1
). Under the experiment conditions, the electrolytic processes were controlled by activation polarization (2.0V-3.5V) and electrochemical polarization (3.5V-5.5V), and the optimized current density was 1.2-1.6 Acm-2
. The cell voltage was 3.7 V (5-50 °C), and the peak value of ozone output (5.7 mgmin-1
) appeared at 30 °C. In the processes of ozone production, more than half of the energy was converted into heat. The short time of average retention (<5s) kept ozone from obvious decomposing in the experiment. During the durability tests, the output of ozone can stabilize at 5mgmin-1 (under 1.46 Acm-2
and 30 °C). The SEM pictures showed that the surface of the catalyst (working 500 times, more than 1h every time) was eroded and the sharp edges disappeared.
Keywords: Ozone reactor, MEA (membrane electrode assemblies), process optimization
1. INTRODUCTION
Ozone (O3) is a kind of strong oxidant with the oxidation-reduction potential 2.07 V (in water),
which is lower than that of F2 (2.5V), but higher than that of Cl2 (1.36V) and ClO₂ (1.5V). Ozone not
only can degrade most of the organics in waste water [1, 2], but also can clear bacteria in the water or air effectively [3, 4].Moreover, the decomposition product of ozone is O2, which avoid the secondary
Ozone can be produced by electrochemical, photochemical or corona discharge method. According to the electrochemical method [8], ozone was produced with DC power. Similar with the membrane electrode in fuel cell, a MEA (membrane electrode assemblies) reactor was designed with solid polymer electrolyte (SPE) [9]. The catalysts of anode and cathode were bonded or deposited on both sides of SPE. MEA reactor had the advantages as lower power cost (run within 3-6V), safe and simple on device [10].
MEA is the “heart” of electrochemical reactor. There are many reports about the preparation of catalyst, the structure design of electrode and the investigation of electrolyte [11-13]. However, when it comes to ozone generator, the characterization and optimization of application processes are important. During the process of ozone preparation, the operation conditions and the equipment structure will affect the performance of the ozone generator. In this paper, the characterization and optimization of MEA reactor were put forward for Ozone production in deionized water.
2. MATERIALS AND METHODS
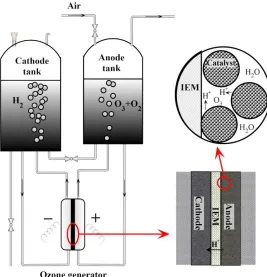
[image:2.596.161.428.461.738.2]The experiment system consisted with a DC power (WYJ-50A30V, Apple Instrument Co. Ltd.), MEA reactor (FT-018, Zhejiang ODREI electro-oxidation Instrument Co. Ltd.) [14]. The area of MEA was 8.76 cm-2 and the electrolyte was deionized water (<10scm-1). The schematic of the experiment equipment was shown in Fig. 1. In the processes of the experiments, the influence of gas-liquid separation, current density, temperature, operation time and the working stability are investigated, respectively.
As shown in Fig. 1, water flow circularly between the tank and MEA reactor under the affection of airlift. In this process the gas can be bring out from the MEA reactor, at the same time the temperature of MEA can be cool down. The gas generated from anode and cathode flowed into anode tank and cathode tank (110mm, liquid depth 100mm) respectively. Compressed air (3.2Lmin-1
) was introduced into anode tank (Ti) to take ozone out, while hydrogen was collected from cathode tank (Ti) and discharge. The pipelines in the experiment system were made of silica gel.
In the process of ozone production, the main electrode reactions and its standard potentials were as below.
Anode
3H2O = O3 + 6H+ + 6e- (E10=1.51V)
2H2O = O2 + 4H+ + 4e- (E20=1.23V)
Cathode
2H+ + 2e- = H2 (E30=0.00V)
The actual yield of ozone from the reactor was analyzed by KI absorption method, while the theoretical yield of ozone was calculated according to Faraday's Law [15]. The current efficiency of anode can be obtained as below.
Current efficiency= Actual yield / Theoretical yield 100% (1)
3. RESULTS AND DISCUSSION
3.1. Effect of gas-liquid separation process on ozone output
As shown in Fig. 1, the mixture gas of ozone and oxygen bubbled and lifted in the water of anode tank, and then blown out by compressed air. According to the classical two-film theory, ozone dissolved in the liquid was the control step. The kinetics equation for the process can be expressed as follows.
*
( - ) la
VdCK S C C dt (2)
Where V is the volume of liquid, m3; C is the concentration of ozone in water, mgm-3; C*is the equilibrium concentration of ozone under the experiment conditions, mg m-3
; S is the gas-liquid contact area, m2; Klais the total liquid-phase mass transfer coefficient under experiment condition, ms
-1
; t is the aeration time, s.
After integration and arrangement of Eq. (2), the relationship between aeration time and ozone concentration can be expressed as below.
*
*
C ln( ) S C -C la
V t
K
(3)
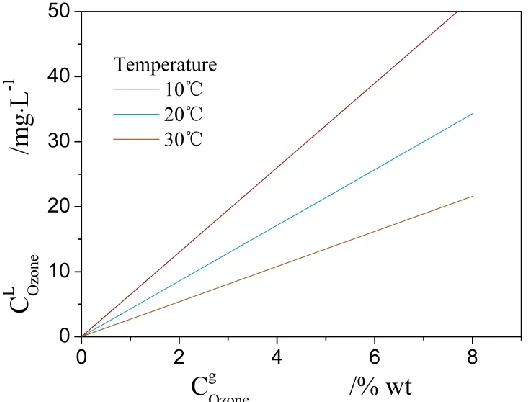
equilibrium conditions, the equilibrium concentration of ozone in water (CLOzone) versus corresponding
[image:4.596.154.419.142.343.2]concentration of ozone in gas (CgOzone) was shown in Fig. 2 [16].
Figure 2. The equilibrium concentration of ozone in water
The output of the mixture gas (O3+O2) released from the generator was 65-70 mlmin-1. The
ozone concentration of the mixture gas was about 5%wt. The gas bubbles raising from the water (depth 100mm) need 3s and the average surface area of the bubbles staying in the water was 3 cm2, approximately. The surface area of liquid layer in anode tank was 95cm2. The flow rate of air from the anode tank was 3.2Lmin-1
, and the ozone concentration was more than 0.1 %wt. In this case, the results of ozone concentration according to Eq. (3) was consistent with the experiment results (Fig. 2).
According to the Eq. (3), it consumed 3.8 min for the dissolving process that the ozone concentration of the water in anode tank increased from 0 to 50% equilibrium concentration under the experiment conditions. In this process the overall dissolved ozone was 7.1 mg while the total output of ozone was 19 mg. So the gas-liquid separation process had little impact on ozone output when the experiment system was working after 15 min.
3.2. Effect of current density on ozone output and current efficiency
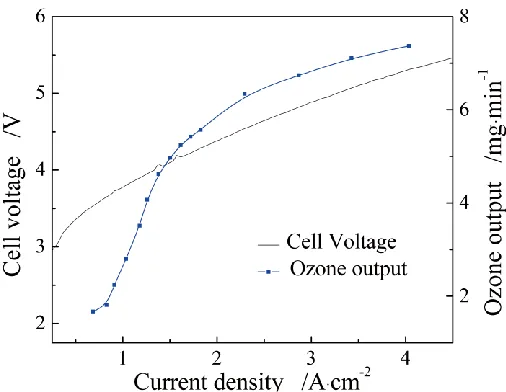
The relationships between current density, ozone output and current efficiency were shown in Fig. 3. Different with the anolyte of 1 M HClO4 [17], in this work deionized water was used as
electrolyte. Under the experiment conditions, the output of ozone increased with the increasing of current density, while the current efficiency arrived the peak value (7.7%) at the current density 1.4 Acm-2
Figure 3. Effect of current density on ozone output and current efficiency (temperature 30 °C)
The cell voltage of ozone generator was mainly composed of fixed voltage (from first class conductor, electrolyte, ion exchange diaphragm and interface) and polarization voltage (activation polarization, electrochemical polarization and concentration polarization) [18]. The polarization voltage was great differences under different operating conditions. As shown in Fig. 4, when the cell voltage increased from 2.0 V to 3.5 V, the current density increased only 0.6 Am-2
, which indicated that the electrolytic process was controlled by activation polarization. However, when the cell voltage increased from 3.5 V to 5.5 V, the current density increased linearly. The increase rate of current density was about 1.8AV-1
, which indicated that the electro oxidation process was controlled by electrochemical polarization.
[image:5.596.178.431.527.723.2]
Under the same experiment conditions, the decrease of ozone yield was resulted from the decline of current efficiency. The electrode with particle stacking appearance had big specific surface area, which extended the period of electrochemical polarization. Furthermore, the concentration polarization didn’t show significant effect in the experiment process. According to the application cost and requirements, the optimized current density was determined as 1.2-1.6 A cm-2
.
3.3. Effect of temperature on cell voltage and ozone output
In the process of electro oxidation, the activity of catalyst was strengthened by the increasing of temperature. In this case, the solid polymer electrolyte was activated and the proton transfer rate increased, which will decrease the cell voltage of ozone generator [19]. However, the decomposition rate of ozone also increased with the increasing of operation temperature, which will lead the yield of ozone decrease. The ozone output and voltage versus water temperature was shown in Fig. 5.
Figure 5. Effect of operation temperature on ozone output and cell voltage (current density 1.46 Acm-2
, temperature 30 °C)
As shown in Figure 5, the cell voltage was stable at 3.7 V under the temperature 5-50 °C, while the ozone output was different significantly and the peak value 5.7 mgmin-1
3.4. Effect of operation time on temperature and ozone output
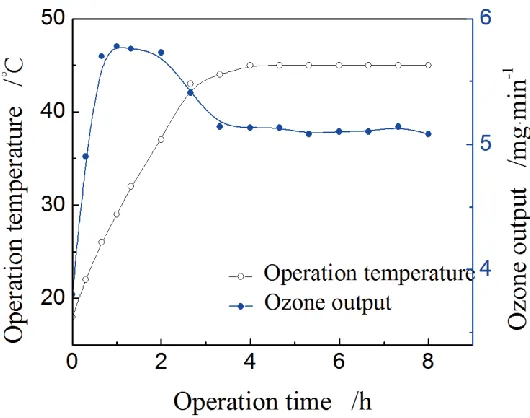
[image:7.596.168.433.200.409.2]Working continuously and efficiently were important for the generator. However, the temperature of the system will increase with the prolonging of operating time, and the catalyst will turn to inactive and degrade the working life. In order to investigate the performance of the generator, here we kept the generator working continuously for eight hours. During this experiment, the effect of operation time on temperature and ozone output was shown as below.
Figure 6. Effect of operation time on temperature and ozone output (current density 1.46 Acm-2, cell
voltage 3.7 V, initial temperature 18 °C)
In the experiment process, the water temperature increased from the initial temperature 18 °C and stabilized at 45 °C after working 3 hours. Based on the energy balance, we can estimate the heating efficiency of the generator in the working process. Eq. (4) can be used to calculate the total energy consumption of the ozone generator, while Eq. (5) expressed the energy which converted to chemical energy.
W UIt (4)
Where W is the total energy consumption, J; U is cell voltage, V; I is current, A; t is time, s. i
i i
i
It
W H
n F
(5)
Where F is Faraday's constant, 96487 Cmol-1
; ξi is the current efficiency to generate i component, %; niis the number of electron transfer in the reaction; Hiis the reaction enthalpy for generating i component, kJmol-1
.
The reaction enthalpy for generating oxygen and ozone from water are as below. 2H2O→O2+2H2 △H=+571.6kJmol-1
3H2O →O3+3H2 △H=+1285.5kJmol-1
Under the experiment conditions (current density 1.46 Acm-2
92.5%. In this process, the efficiency of electrical energy converted into chemical energy can be calculated as Eq. (6).
2 3 3 2 2 2 3 3
2 3
O O O O O O
O O
W
W
=
O O100%
n
H
n
H
100%
W
n n UF
=41.5% (6)It can be know from the calculation results of Eq. (6) that more than half of the energy is converted into heat in the process of ozone production. In this process the system temperature increased from 18 °C to 43 °C in the first 3 hours. Because of the heat loss of the experiment device, the temperature stay at 45 °C finally.
The peak value of ozone output appeared around 30 °C, which coincide with the results of chapter 2.3. The ozone output stabilized with the stabilization of temperature. This indicated that the optimization of operation temperature can improve the work efficiency of ozone generator.
3.5. Working stability of the MEA reactor
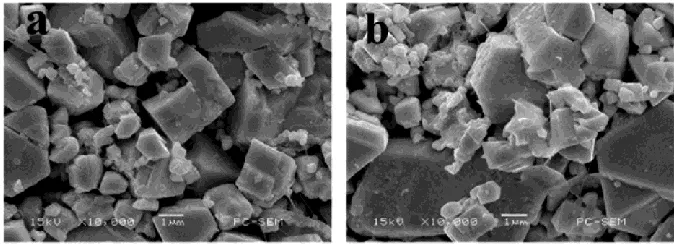
[image:8.596.127.464.420.542.2]The catalyst adhered on the surface of the MEA. In the processes of ozone generation, the catalyst degraded with the increasing of the working times and the operation time [22]. The SEM pictures in Fig. 7 showed the difference of fresh catalyst and the old catalyst which had been used more than 500 times (working more than 1h every time).
Figure 7. SEM pictures of the anode catalyst (a, fresh catalyst; b, old catalyst)
As shown in Fig. 7, the edges of fresh catalyst particles were sharp, and kept the crystal shape clearly. But the surface of the old catalyst was eroded and the sharp edges disappeared. Moreover, the number of the small particles in the old catalyst was more than that in fresh catalyst. The changes in morphology and structure of the catalyst particles would affect the performance of the MEA reactor.
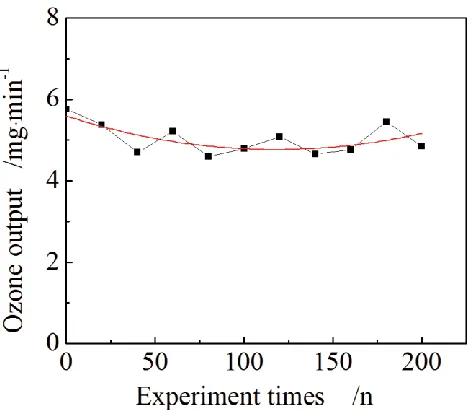
In the processes of ozone generation, the destruction of the crystal structure may cause the decline of the current efficiency, which will affect the yield of ozone directly. Under the conditions of 1.46 Acm-2
, working 1 hour every time (200 times), Fig. 8 showed the relationship between ozone output and the working times. As shown in Fig. 8, although ozone output fluctuated with the increasing of working times, the value of ozone output stabilized at 5mgmin-1
Figure 8. Relationship between ozone output and experiment times (current density 1.46 Acm-2,
temperature 30 °C, working 1 h every time)
4. CONCLUSION
In this work, a MEA reactor for Ozone production in deionized water was characterized and the operation process was optimized. The results of the experiments were concluded as below.
1) The output of ozone gas (O3+O2) released from the reactor was 65-70 mlmin-1, and the
ozone concentration was more than 0.1 %wt after mixed with air (3.2Lmin-1
).
2) The electrolytic process was controlled by activation polarization from 2.0V to 3.5V and electrochemical polarization from 3.5V to 5.5V. The optimized current density was 1.2-1.6 Acm-2
. 3) The system temperature increased from 18 °C to 43 °C in the first 3 hours and more than half of the energy was converted into heat. The cell voltage was stable at 3.7 V (5-50 °C), while the peak value of ozone output (5.7 mgmin-1
) appeared at 30 °C.
4) Although ozone output fluctuated with the increasing of experiment times (200 times), the value of ozone output can stabilize at 5 mgmin-1
.
ACKNOWLEDGEMENT
The work was supported by Priority Academic Program Development of Jiangsu Higher Education Institutions (PAPD), Jiangsu Key Laboratory of Advanced Catalytic Materials and Technology (BM2012110) and Jiangsu Overseas Research & Training Program for University Prominent Young & Middle-aged Teachers and Presidents.
References
[image:9.596.171.408.88.293.2]
2. M. Antonopoulou, E. Evgenidou, D. Lambropoulou, I. Konstantinou. Water Research, 53 (2014) 215.
3. F. Zhang, J. Xi, J.J. Huang. Separation and Purification Technology, 114 (2013) 126.
4. A. Mahfoudh, J. Barbeau, M. Moisan, A. Leducb, J. Séguin, 2010. Applied Surface Science, 256 (2010) 3063.
5. M. Ibáñez, E. Gracia-Lor, L. Bijlsma, E. Morales, L. Pastor, F. Hernández. Journal of hazardous materials, 260 (2013) 389.
6. S. Bhateja. Indian Journal of Dentistry, 3 (2012) 150.
7. R. Broséus, S. Vincent, K. Aboulfadl, A. Daneshvarc, S. Sauvéb, B. Barbeaua, M. Prévost. Water Research, 43 (2009) 4707
8. K. Alexander, S. Manuela, W. Maja, B. Manfred. Electrochemistry Communications, 8 (2006) 883. 9. Y. Wang, K.S. Chen, J. Mishler, S.C. Cho, X.C. Adroher. Applied Energy, 88 (2011) 981.
10.B.D. Tanner, S. Kuwahara, C.P. Gerba, K.A. Reynolds.Water Science and Technology, 50 (2004) 19.
11.G.M. Fang, H.M. Zhang, Anode and cathode catalyst of low-voltage electrolytic ozone generator and its preparation. CN 102899685A (2013).
12.L.M. Da Silva, L.A. De Faria, J.F.C. Boodts. Electrochimica Acta, 48 (2003) 699.
13.Q.A. Chen, F.M. Zhao, C.A. Ma. Chemical Industry and Engineering Progress, 29 (2010) 914. 14.L.Y. Wang, J.H. Zhao, L. Wang, A kind of electrooxidation ozone generator, CN201110048344
(2012).
15.Y.J. Feng, Environmental Electrocatalytic Electrode-structure, Characteristic and Preparation, Science Press, Beijing (2010).
16.J.Y. Chu. Technology and applications of ozone, Chemical Industry Press published center of environmental Science and Engineering, Beijing (2002).
17.Z. Khalid, A.C. Paul. Electrochimica Acta, 135 (2014) 11. 18.Y. Hou, Z. Yang, X. Fang. Renewable Energy, 36 (2011) 325.
19.C.S. Kong, D.Y. Kim, H.K. Lee, Y.G. Shul. Journal of Power Source, 108 (2002) 185.
20.L.M. Da Silva, D. V. Franco, L. G. Sousa. Journal of applied electrochemistry, 40 (2010) 855. 21.J. Nawrocki, L. Fijołek. Applied Catalysis B: Environmental, 142 (2013) 307.
22.J.P. Wang, X. Li, Y.H. Niu. The Chinese Journal of Process Engineering, 8 (2008) 404.