White Rose Research Online URL for this paper:
http://eprints.whiterose.ac.uk/77597/
Version: Published Version
Article:
Wong, R., Allen, F.H. and Willett, P. (2010) The scientific impact of the Cambridge
Structural Database: a citation-based study. Journal Of Applied Crystallography, 43 (4).
811 - 824.
https://doi.org/10.1107/S0021889810019680
[email protected] https://eprints.whiterose.ac.uk/
Reuse
Unless indicated otherwise, fulltext items are protected by copyright with all rights reserved. The copyright exception in section 29 of the Copyright, Designs and Patents Act 1988 allows the making of a single copy solely for the purpose of non-commercial research or private study within the limits of fair dealing. The publisher or other rights-holder may allow further reproduction and re-use of this version - refer to the White Rose Research Online record for this item. Where records identify the publisher as the copyright holder, users can verify any specific terms of use on the publisher’s website.
Takedown
If you consider content in White Rose Research Online to be in breach of UK law, please notify us by
Journal of
Applied
Crystallography
ISSN 0021-8898
Received 8 March 2010 Accepted 25 May 2010
#2010 International Union of Crystallography Printed in Singapore – all rights reserved
The scientific impact of the Cambridge Structural
Database: a citation-based study
Ruth Wong,aFrank H. Allenband Peter Willetta*
a
Department of Information Studies, University of Sheffield, 211 Portobello Street, Sheffield S1 4DP, UK, andbCambridge Crystallographic Data Centre (CCDC), 12 Union Road, Cambridge CB2 1EZ, UK. Correspondence e-mail: [email protected]
Four groups of the most highly cited scientific articles (46 in total), which either describe the Cambridge Structural Database (CSD) System or report scientific research applications of the CSD, have been selected for citation analysis. The analysis has been carried out to study the scientific importance of crystal structure information made available to the international research community
viathe CSD orviareviews and research articles that make use of the CSD as a primary information source. Two groups, A and B of ten articles each (A
published before 1998, andBpublished post-1998), are authored by staff of the CCDC, while two further groups, C and D containing ten reviews and 16 research articles, respectively, are authored by external scientific users of CSD information. Citations have been analysed by their number, and in terms of the journals, scientific subject areas and geographical regions from which the citations originate. Between them, the 46 articles have received 44 381 citations with 15 articles cited more than 1000 times. Citations come from a very broad range of journals and subject areas, with chemistry and crystallography being the dominant fields as expected, but with a very significant citation rate from the life sciences, particularly from the USA. In recent years, there has been a major increase in citations arising from south Asia and the Far East, principally from China, India, Malaysia, Pakistan, Japan, Thailand and Taiwan, who together now rival, and sometimes exceed, the citation rates from Europe and the USA. The effect of citations from new journals, particularlyActa Crystallographica Section E: Structure Reports Online,Crystal Growth and DesignandCrystEngCommis clearly reflected in the data.
1. Introduction
Compilation of the Cambridge Structural Database (CSD; Allen, 2002) began in 1965 to record numerical, chemical and bibliographic data for crystal structures of organic and metal– organic compounds determined by X-ray and neutron diffraction. Starting with just a few hundreds of structures, the CSD has just recorded its 500 000th structural entry at the start of its 45th year of operation. Allied to database creation and maintenance, the Cambridge Crystallographic Data Centre (CCDC) has developed and distributed software for search, retrieval, analysis and visualization of CSD informa-tion (Bruno et al., 2002; Macrae et al., 2006), as well as knowledge bases of intramolecular geometry (Bruno et al., 2004) and intermolecular interactions (Brunoet al., 1997). The resultant CSD System is used by academics in more than 70 countries worldwide and by more than 120 chemical compa-nies. In 2009, the CCDC’s first Internet system, WebCSD
(Thomaset al., 2010), was launched, with an intranet version being made available in early 2010. The CCDC has also diversified into the development of software that makes use of
structural knowledge derived from the CSD to predict protein–ligand interactions (Verdonket al., 1999), to perform protein–ligand docking (Jones et al., 1997) and to assist in structure determination from powder diffraction data (David
et al., 2006).
The CSD is one of four comprehensive and fully retro-spective crystallographic databases [the others are CRYSTMET (White et al., 2002), the Inorganic Crystal Structure Database (ICSD; Belskyet al., 2002) and the Protein Data Bank (PDB; Bermanet al., 2000)] that were established in the 1960s and early 1970s. The availability of these resources has helped to promote the scientific value of crystal structure information across a broad spectrum of scientific disciplines in academia and industry, and has underpinned a wide variety of structure-based research applications.
2002; Hood & Wilson, 2001; Thelwallet al., 2005). Whilst there have been many bibliometric studies of various aspects of chemistry, there have been only four of which we are aware that focus on crystallography. An early study by Hawkins (1980) surveyed the publication of journal articles on crys-tallography, identifying the core journals for the subject in terms of both publications and citations; Tainer (1991) noted that articles discussing crystallization techniques attract few citations; Behrens & Luksch (2006) carried out a detailed study of the data in the ICSD, focusing on the extent to which the data fitted two well known bibliometric distributions: Bradford’s law and Lotka’s law; finally, Redmanet al.(2001) reported a 1999 analysis of the citations received by ten highly cited CCDC articles in the period 1994–1998, categorizing these citations by journal, institutional type and geographic region. This latter study has acted as a model for the work reported here, in which we present extended analyses of the citations to two sets of articles published by the CCDC and to two sets of articles published by external users of CCDC data. In this way, we seek to quantify the impact not only of the CSD itself but also of research that draws directly on the CSD, thus providing some measure of the broad scientific value of crystal structure information.
2. Methods
A programme of basic research and development has been central to the CCDC’s own activities since its inception, with nearly 650 peer-reviewed journal articles, reviews and book chapters in print by the end of 2009. These items are listed on the CCDC website (CCDC, 2010a) and fall into three main categories: descriptions of the developing CSD System and other applications software; printed compilations of structural information derived from the CSD; and research methodolo-gies and scientific applications of CSD data. The papers also include a number of crystal structure analyses of compounds related to the research interests of the CCDC and its colla-borators.
The items in the CCDC’s bibliography were searched in the Web of Science portion of the Thomson Reuters (2010) Web
of Knowledge (WoK) database, with WoK records being identified for 536 of the items in mid-2009. The missing items included publications in sources not covered by WoK (most obviously books, but also some low-impact journals and symposium proceedings volumes) and recent publications not available in the WoK database in mid-2009. The citations to the 536 publications were then checked to identify the ten most highly cited CCDC articles from the period 1965–1998 and the ten most highly cited articles from the period 1999– 2008. In this paper, these two sets of target articles will be referred to as groupAand groupB, respectively, with eight of the groupAarticles having also been amongst the ten most cited articles in the earlier study by Redmanet al.(2001).
The two sets of target articles are listed in Tables 1 and 2, with their citation counts obtained on 15 June 2009. These counts do include self-citations (i.e.citations to one of these CCDC articles from another CCDC article), but the propor-tions are very small (0.8 and 2.7% for groups A and B, respectively) and thus do not materially affect any of the conclusions that we shall draw. Each target article has been categorized as belonging to one of four types: CSD articles describe the CSD itself and associated software; LS articles describe life-science applications of the CSD; RES articles describe research analyses carried out using CSD data; and TAB articles contain tabulated molecular geometry derived from CSD data. The citations to each of the target articles were analysed using the WoK Analyze Results tool, which groups and sorts citation data using the following criteria: author, publication year, document type, subject, source title, country and institution.
[image:3.610.45.568.95.269.2]Five analyses were carried out on the two groups of target articles, based on (i) the cumulative and annual growth of citations over time; (ii) the journals that cite the selected articles; (iii) the disciplines that cite the selected articles, using the broad areas of crystallography, chemistry, biosciences, physics and computer science, and using the WoK subject categories; (iv) the geographic spread of the citations to the selected articles; and (v) the institutional types of the citations. The geographical study used the eight broad WoK geographic
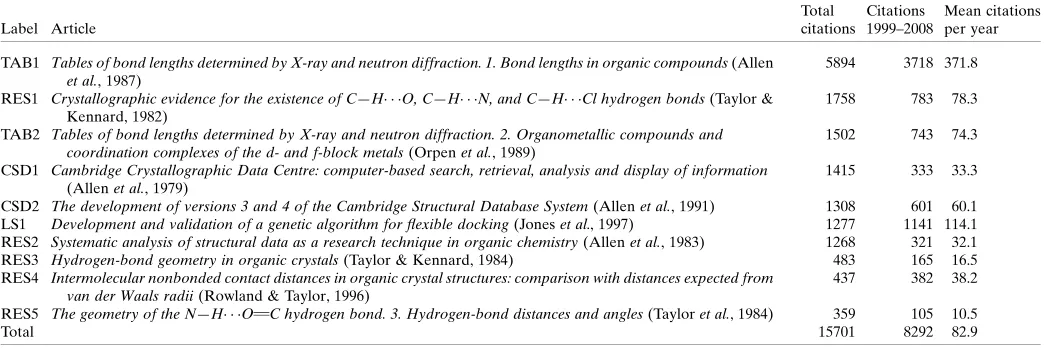
Table 1
GroupA: the ten most highly cited articles published 1965–1998.
Label Article
Total citations
Citations 1999–2008
Mean citations per year
TAB1 Tables of bond lengths determined by X-ray and neutron diffraction. 1. Bond lengths in organic compounds(Allen
et al., 1987)
5894 3718 371.8
RES1 Crystallographic evidence for the existence of C—H O, C—H N, and C—H Cl hydrogen bonds(Taylor & Kennard, 1982)
1758 783 78.3
TAB2 Tables of bond lengths determined by X-ray and neutron diffraction. 2. Organometallic compounds and coordination complexes of the d- and f-block metals(Orpenet al., 1989)
1502 743 74.3
CSD1 Cambridge Crystallographic Data Centre: computer-based search, retrieval, analysis and display of information
(Allenet al., 1979)
1415 333 33.3
CSD2 The development of versions 3 and 4 of the Cambridge Structural Database System(Allenet al., 1991) 1308 601 60.1 LS1 Development and validation of a genetic algorithm for flexible docking(Joneset al., 1997) 1277 1141 114.1 RES2 Systematic analysis of structural data as a research technique in organic chemistry(Allenet al., 1983) 1268 321 32.1 RES3 Hydrogen-bond geometry in organic crystals(Taylor & Kennard, 1984) 483 165 16.5 RES4 Intermolecular nonbonded contact distances in organic crystal structures: comparison with distances expected from
van der Waals radii(Rowland & Taylor, 1996)
437 382 38.2
RES5 The geometry of the N—H O C hydrogen bond. 3. Hydrogen-bond distances and angles(Tayloret al., 1984) 359 105 10.5
descriptors: Eastern Europe, Western Europe, Far East (which includes China, Japan Malaysia, Thailand, Taiwan, the Republic of Korea and Singapore), South Asia (principally India and Pakistan), North America, South America, UK and Rest of the World (which includes Australasia, Africa and Israel). The institutional study categorized each institution that was recognized as Commercial (sources where the address field contained appropriate terms, e.g. ‘Co.’, ‘Inc.’, ‘Ltd’, ‘LLC’), University, Institute, Academy, the CCDC itself, Other (e.g. national research centres or government labora-tories) or Unknown.
In addition to its own in-house bibliography, the CCDC also maintains a separate database of publications (mainly peer-reviewed journal articles) by any authors in which use of the CSD has been central to the research reported. Denoted as WebCite, this database currently contains 2290 entries, of which over three-quarters are by non-CCDC authors, and is freely available and searchable via the CCDC’s website (CCDC, 2010b). Our intention had been to identify the most highly cited papers by non-CCDC authors in this category, but this would have been exceedingly time-consuming using conventional WoK searches. Moreover, while the CCDC tries to keep WebCite as comprehensive as possible, it is not a simple matter to identify all such publications from direct scanning of the literature, and it was likely that some relevant material could be missing from WebCite. Hence we adopted a two-stage strategy. First, we identified 19 authors who had
each contributed significant numbers of papers to WebCite, together with other likely high-citation papers from personal knowledge of the field provided by CCDC staff. This gave a reduced subset of about 400 WebCite papers for which a comprehensive WoK search was then practicable. Secondly, we carried out a WoK Topic search for ‘Cambridge Structural Database’ which yielded six further papers having > 250 cita-tions that were not located in the first stage. These ‘new’ papers will now be added to WebCite, and WoK will be used routinely to identify gaps in WebCite coverage in the future. Taken together, these procedures identified ten reviews that had each received > 500 citations and 16 research articles that had each received > 250 citations. These two additional sets of target articles, this time by non-CCDC authors, will be referred to as group C (REV1–10; Table 3) and group D
(PAP1–16; Table 4); the citation counts in these two tables were taken on 15 October 2009.
3. Results
3.1. Citations analysed by time
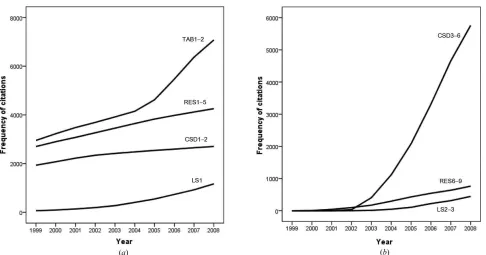
The growth in citations over time for the articles in groups
[image:4.610.51.567.93.233.2]A and B is shown in Fig. 1, with the annual contributions detailed in Fig. 2. In both cases, the citation frequencies have been sub-divided by publication type. These cumulated plots
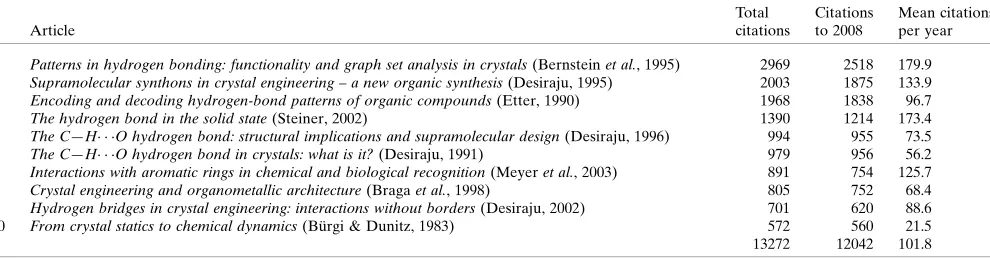
Table 3
GroupC: the ten review articles published by non-CCDC authors that have > 500 citations.
Label Article
Total citations
Citations to 2008
Mean citations per year
REV1 Patterns in hydrogen bonding: functionality and graph set analysis in crystals(Bernsteinet al., 1995) 2969 2518 179.9 REV2 Supramolecular synthons in crystal engineering – a new organic synthesis(Desiraju, 1995) 2003 1875 133.9 REV3 Encoding and decoding hydrogen-bond patterns of organic compounds(Etter, 1990) 1968 1838 96.7
REV4 The hydrogen bond in the solid state(Steiner, 2002) 1390 1214 173.4
REV5 The C—H O hydrogen bond: structural implications and supramolecular design(Desiraju, 1996) 994 955 73.5 REV6 The C—H O hydrogen bond in crystals: what is it?(Desiraju, 1991) 979 956 56.2 REV7 Interactions with aromatic rings in chemical and biological recognition(Meyeret al., 2003) 891 754 125.7 REV8 Crystal engineering and organometallic architecture(Bragaet al., 1998) 805 752 68.4 REV9 Hydrogen bridges in crystal engineering: interactions without borders(Desiraju, 2002) 701 620 88.6 REV10 From crystal statics to chemical dynamics(Bu¨rgi & Dunitz, 1983) 572 560 21.5
[image:4.610.68.563.273.402.2]Total 13272 12042 101.8
Table 2
GroupB: the ten most highly cited articles published 1999–2008.
Label Article
Total citations
Citations to 2008
Mean citations per year
CSD3 The Cambridge Structural Database: a quarter of a million crystal structures and rising(Allen, 2002) 4151 3976 568.0 CSD4 New software for searching the Cambridge Structural Database and visualizing crystal structures(Brunoet al., 2002) 1030 960 137.1 CSD5 Mercury: visualization and analysis of crystal structures(Macraeet al., 2006) 728 584 194.7
LS2 Improved protein–ligand docking using GOLD(Verdonket al., 2003) 323 284 56.8
CSD6 CIF applications. XV. enCIFer: a program for viewing, editing and visualizing CIFs(Allenet al., 2004) 261 239 47.8 RES6 A test of crystal structure prediction of small organic molecules(Lommerseet al., 2000) 233 223 24.8 RES7 Applications of the Cambridge Structural Database in organic chemistry and crystal chemistry(Allen & Motherwell,
2002)
211 190 27.1
RES8 Crystal structure prediction of small organic molecules: a second blind test(Motherwellet al., 2002) 190 179 25.6 RES9 The packing density in proteins: standard radii and volumes(Tsaiet al., 1999) 180 172 24.6 LS3 A new test set for validating predictions of protein–ligand interaction(Nissinket al., 2002) 166 162 18.0
conceal some interesting variations in citation frequency for individual articles.
Articles CSD1–2 are both highly cited but inspection of the annual frequencies reveals that the citation rates have dropped off rapidly over the period 1999–2008. In fact, taken together, CSD1–3 provide an historical overview of the CCDC’s development over almost a quarter of a century (1979–2002). The reduction in citations for CSD1–2 reflects the appearance of CSD3, which has largely displaced the two
earlier articles as the ‘standard’ citation to CCDC products and services. That being so, it is rather surprising that a few citations continue to appear for the earlier, and by now obsolete, articles; the publication of this article will hopefully spur such authors to cite CSD3 in future.
[image:5.610.43.563.94.339.2]For almost 20 years following the publication of TAB1 in 1987, there was a steady growth in the cumulative citation frequency, withcirca170 citations each year. However, since 2004, there has been a marked (almost threefold) increase in
Table 4
GroupD: the 16 research articles published by non-CCDC authors that have > 250 citations.
Label Article
Total citations
Citations to 2008
Mean citations per year
PAP1 Accurate bond and angle parameters for X-ray protein-structure refinement(Engh & Huber, 1991) 1931 1884 110.8 PAP2 A critical account on–stacking in metal complexes with aromatic nitrogen-containing ligands(Janiak, 2000) 1309 1146 127.3 PAP3 Reticular chemistry: occurrence and taxonomy of nets and grammar for the design of frameworks(Ockwiget al.,
2005)
549 396 99.0
PAP4 A revision of van der Waals atomic radii for molecular crystals: N, O, F, S, Cl, Se, Br and I bonded to carbon
(Nyburg & Faerman, 1985)
441 418 16.7
PAP5 PRODRG: a tool for high-throughput crystallography of protein–ligand complexes(Schu¨ttelkopf & Van Aalten, 2004)
488 388 77.6
PAP6 How good is fluorine as a hydrogen-bond acceptor?(Howardet al., 1996) 342 318 26.5 PAP7 The computer program LUDI: a new method for the de novo design of enzyme inhibitors(Bo¨hm, 1992) 327 311 18.3 PAP8 Directional preferences of nonbonded atomic contacts with divalent sulfur. 1. Electrophiles and nucleophiles
(Rosenfieldet al., 1977)
308 297 9.6
PAP9 C—H F interactions in the crystal structures of some fluorobenzenes(Thalladiet al., 1998) 297 285 25.9 PAP10 Structural characteristics of the carboxylic ester group(Schweizer & Dunitz, 1982) 286 283 10.5 PAP11 Lone pair functionality in divalent lead compounds(Shimoni-Livnyet al., 1998) 306 273 24.8 PAP12 Aromatic-stacking in solution as revealed through the aggregation of phenylacetylene macrocycles(Shettyet al.,
1996)
273 256 19.7
PAP13 A fast new approach to pharmacophore mapping and its application to dopaminergic and benzodiazepine agonists
(Martinet al., 1993)
270 262 16.4
PAP14 Metal-bound chlorine often accepts hydrogen bonds(Aullonet al., 1998) 279 258 23.5 PAP15 Distinction between the weak hydrogen bond and the van der Waals interaction(Steiner & Desiraju, 1998) 270 254 23.1 PAP16 Crystal structures of polynuclear aromatic hydrocarbons. Classification, rationalization and prediction from
molecular structure(Desiraju & Gavezzotti, 1989)
259 249 13.1
Total 7935 7278 40.2
Figure 1
[image:5.610.66.552.475.730.2]the annual number of citations, as shown by the abrupt change of slope for TAB1–2 in Fig. 1(a). This change of slope is entirely due to TAB1, since the frequencies for the companion article, TAB2, have not been similarly affected. Rather, the annual citation rate for TAB2 has fallen slowly but consis-tently over the period 1999–2008. We believe that this upsurge in citations to TAB1 is attributable to the very rapid increase in novel crystal structures published in recent years in Acta Crystallographica Section E: Structure Reports Online
(denoted asACEin the remainder of this paper for brevity). A number of the principal contributing authors to ACE
include a citation to TAB1 to confirm that the bond lengths reported in their work conform to accepted norms. Finally in this discussion of individual articles, it is worth noting the steady growth in citations for LS1, in terms of both total citations and citations per year (ca250 a year by 2008). This article describes one of the first protein–ligand docking programs (GOLD) able to encompass ligand flexibility in the docking process; flexible docking is now well established as a key tool in structure-based virtual screening (Leach et al., 2006; Rester, 2006; Warrenet al., 2006), and the importance of this technique is clearly reflected in citations to the GOLD
application.
It is more difficult to comment on the groupBarticles (see Fig. 1b), since they have been published much more recently than those in group A. We have already noted the extensive citations to CSD3, but the rapid growth in citations for CSD5 is also noteworthy, since it had already attracted over 700 citations by mid-2009, despite being published only in 2006. The article describes the visualization program, Mercury, a version of which is available for free download. This option has clearly been very heavily used, with over 20 000 down-loads by mid-2009.
When the citation frequencies of all the 536 CCDC publi-cations were ranked in decreasing order, a rank-frequency plot (Supplementary Fig. A1) was obtained. The resulting hyperbola-like plot exemplifies the Zipfian distribution that characterizes many bibliographic phenomena (Fairthorne, 1969): in the present context, this means that most of the cited publications are clustered at the low citation end, with just a few publications toward the high end of the plot. When the frequency and rank data are both converted to logarithms and plotted against each other, the points are arranged in an almost linear fashion.
3.2. Citations analysed by journal
Part of the journal analysis has involved use of the impact factor (see below), which requires recent information about the citing journals and which hence led to these analyses being based on citations made during the period 2005–2008. There are 4524 and 5507 total citations to the groupAand groupB
publications, respectively, for this period, with the citations varying considerably across the article categories (see Supplementary Tables A and B), and with the numbers of unique journals reflecting not only how highly cited an article is but also its multi-disciplinary appeal.
[image:6.610.44.565.68.321.2]In groupA, TAB1 followed by LS1 were the two most cited articles during 2005–2008. TAB1 was the most cited article in the group and also had the highest mean number of citations per journal (Supplementary TableA). However, no less than 68.9% of the TAB1 (and the much less cited TAB2) citations appeared in a single journal,ACE, referred to above. No other
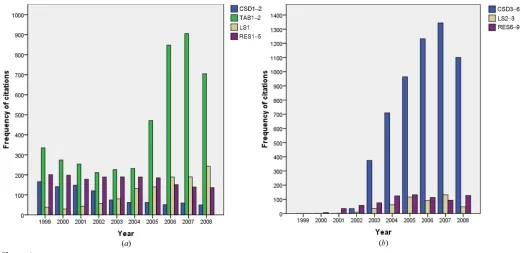
Figure 2
Frequency of citations per year for 1999–2008 for (a) groupAarticles and (b) groupBarticles.
1
journal was responsible for even 5% of the citations here, and the top ten journals between them accounted for 84.4% of the total citations to TAB1–2. Conversely, the more recent LS1 attracted citations from considerably more journals, suggesting that it has had a much broader impact. In addition, the distribution here is much less skewed; the top journal,
Journal of Medicinal Chemistry, is responsible for just 18.5% of the citations, two other journals (Journal of Chemical Information and Modeling and Bioorganic and Medicinal Chemistry) both attracted more than 5% of the citations and the top ten journals between them accounted for only 53.9% of the total citations to LS1.
The distributions for the other two sets of articles, CSD1–2 and RES1–5, are very similar to each other, and very different from those for TAB1–2 and for LS1. Specifically, there are several journals all citing the CCDC target articles about the same number of times. Thus, for CSD1–2, the top journal,
Journal of Organometallic Chemistry, is responsible for 5.4% of the citations, the tenth journal, Journal of the American Chemical Society, is responsible for 2.7% and the top ten
journals between them account for just 36.0% of the total citations. The distribution for RES1–5 is closely similar: the top journal,ACE, is responsible for 6.2% of the citations, the tenth journal, European Journal of Inorganic Chemistry, is responsible for 2.3% of the citations and the top ten journals between them account for 32.3% of the total citations.
The group B articles have a single article, CSD3, that is responsible for > 50% of the total citations to this group. The distribution of citing journals for this (and for the much less cited CSD4–5) is intermediate between the distributions for TAB1–2 and for LS1: the top journal, which is againACE, is responsible for 30.3% of the citations, one other journal (Acta Crystallographic Section C: Crystal Structure Communica-tions) is responsible for 12.7% of the citations and the top ten journals between them account for 64.0% of the total. CSD6 is rather different from CSD3–5, in thatACEand the associated
Acta Crystallographica Section Care responsible for 71.9 and 23.1%, respectively, of the 221 citations to this article: the level of citation reflects the subject matter of the article, which describes the enCIFerprogram for checking the syntax and completeness of crystallographic data in the CIF (Hallet al., 1991) normally deposited with each new crystal structure. The distributions for LS2–3 and for RES6–9 are similar to those for the corresponding groupAcategories, i.e.to LS1 and to RES1–5, respectively.
Taking the results for the group A and group B articles together, we conclude that there is a very different pattern of behaviour in the ways that the target articles in the four categories (CSD, LS, RES, TAB) are cited in the literature.
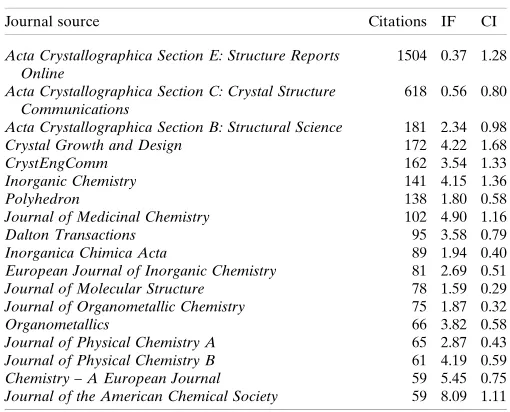
We then considered citations to the target articles across all of the categories, identifying the 30 journals that have cited the groupAand groupBarticles most frequently. These journals are listed in Supplementary TablesCandD, with just the top-ranked journals (those that cite the target articles at least 50 times in the period 2005–2008) listed in Table 5. It will be seen that two-thirds of the top-citing journals are identical, although there are differences in their precise rankings. The tables include the impact factor (IF) for each journal. The IF for a journal measures the frequency with which the average article in that journal has been cited in a particular year or period: the values used here are from the Thomson Reuters Journal Citation Reports database and are based on citations in the years 2006–2007. The IF has been widely used to assess research quality, with articles appearing in journals with high IF values being assumed to have an increased level of academic impact. The assumption is a reasonable one, but the IF does have several known limitations, in particular the fact that citation rates, and hence IF values, vary considerably across the disciplines (Banks & Dellavalle, 2008; Bornmann & Daniel, 2006; Neuhaus & Daniel, 2008; Seglen, 1997). This factor needs to be taken into account when discussing publi-cations, such as the sets of target articles considered in this paper, that attract citations from a range of rather different academic disciplines.
[image:7.610.43.298.261.467.2]To quantify the overall impact of target articles in Table 5 and later tables, we have computed the value of the ‘contri-bution to impact’ (CI) as
Table 5
Journals that cited target articles at least 50 times in the period 2005– 2008.
(a) GroupAtarget articles.
Journal source Citations IF CI
Acta Crystallographica Section E: Structure Reports Online
2059 0.37 2.11
Acta Crystallographica Section C: Crystal Structure Communications
156 0.56 0.24
Journal of Medicinal Chemistry 149 4.90 2.04
Organometallics 89 3.82 0.95
Journal of Chemical Information and Modeling 87 3.64 0.89
Inorganic Chemistry 82 4.15 0.95
Journal of Organometallic Chemistry 74 1.87 0.39
Journal of the American Chemical Society 52 8.09 1.18
Journal of Chemical Crystallography 50 0.57 0.08
(b) GroupBtarget articles.
Journal source Citations IF CI
Acta Crystallographica Section E: Structure Reports Online
1504 0.37 1.28
Acta Crystallographica Section C: Crystal Structure Communications
618 0.56 0.80
Acta Crystallographica Section B: Structural Science 181 2.34 0.98
Crystal Growth and Design 172 4.22 1.68
CrystEngComm 162 3.54 1.33
Inorganic Chemistry 141 4.15 1.36
Polyhedron 138 1.80 0.58
Journal of Medicinal Chemistry 102 4.90 1.16
Dalton Transactions 95 3.58 0.79
Inorganica Chimica Acta 89 1.94 0.40
European Journal of Inorganic Chemistry 81 2.69 0.51
Journal of Molecular Structure 78 1.59 0.29
Journal of Organometallic Chemistry 75 1.87 0.32
Organometallics 66 3.82 0.58
Journal of Physical Chemistry A 65 2.87 0.43
Journal of Physical Chemistry B 61 4.19 0.59
Chemistry – A European Journal 59 5.45 0.75
CI¼ n ðnÞ
IF
ðIFÞ
; ð1Þ
where n is the number of citations from a journal with an impact factor of IF, andðnÞandðIFÞare the corresponding
mean values when computed over the set of 30 citing journals. A value of CI > 1.0 (< 1.0) denotes an above-average (below-average) contribution to the impact of the set of target articles. Thus, CI provides a normalized measure of the citation impacts of the target articles, with the greatest impact being achieved by a target article if it is frequently cited in journals with high IF values. It is noticeable that the journal respon-sible for the largest single number of citations to the CCDC target articles,ACE, has the lowest IF value of all the journals in Table 5. The articles in this electronic only, open-access journal principally involve the presentation of structural data with minimal emphasis on scientific discussion of the results. It is by far the largest in the family of Acta Crystallographica
journals in terms of numbers of articles and pages (Strickland & McMahon, 2008), with 79.2% of the 4460 Acta Crystal-lographicaarticles published in 2008 appearing in ACE, and this number of publications means that the IF is low. However, the sheer number of citations means that the CSD has had a substantial impact on this vitally important journal. Other high-valued journals in the tables are Crystal Growth and Design, CrystEngComm, Inorganic Chemistry,Journal of the American Chemical Society andJournal of Medicinal Chem-istry. This demonstrates the strong influence of the CSD not
just on crystallography but also on inorganic, medicinal and general chemistry.
We have focused above on those journals that cite the CSD most frequently; however, there are very many other citing journals (and also conference proceedings). For example, there are 149 publications that cite groupAonce and 151 that cite groupBonce. Most of these are chemical in nature (e.g. ChiralityandJournal of Thermal Analysis and Calorimetry), and crystallography and the biosciences are, unsurprisingly, also well represented (e.g. FEBS Letters and Powder Diffraction). However, there are also citations from publica-tions across a very wide range of disciplines (e.g. IBM Journal of Research and Development, International Journal of Robotics Research, Proceedings of the 5th ACM/IEEE Joint Conference on Digital Libraries and Propellants, Explosives and Pyrotechnics).
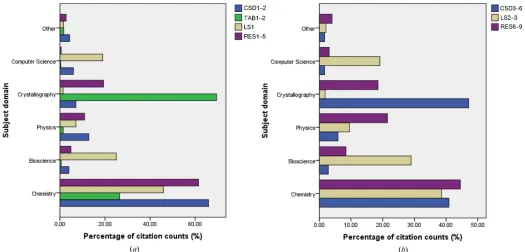
[image:8.610.314.565.96.178.2]3.3. Citations analysed by subject area
Table 5 and Supplementary Tables C and D refer to the journals that most frequently cite the target articles in groups
A and B; Wong (2009) provides a detailed analysis of the journals that cite the four distinct categories of target article and each individual target article in these groups. Whilst there is much commonality in the overall group A and group B
[image:8.610.43.299.114.404.2]journal statistics, there are substantial differences when the individual categories are considered, as would be expected given the very different natures and target audiences of these publications. These differences become still more apparent when we consider the subject areas, rather than the journals, from which the citations emanate. These areas are detailed in Table 6 and Supplementary TablesE–H: these are analogous to the tables discussed in the previous section, but focus on different subject areas rather than different journals. The subject areas are those used in the Journal Citation Reports database, and this is also the source for the subject area IF values in the tables. It should be noted that some journals are assigned to multiple areas, and hence the numbers of citations here can be greater than the corresponding numbers in previous tables.
[image:8.610.43.300.116.231.2]The majority of the subject areas are clustered in five main domains – chemistry, the biosciences, physics (including materials science), crystallography and computer science – as shown in Table 7 (which also contains subject-area data for groupCand group Das discussed further below). However, the distribution across these areas varies significantly between
Table 6
Subject areas that cited target articles at least 100 times in the period 2005–2008.
(a) GroupAtarget articles.
Subject area Citations IF CI
Crystallography 2490 1.05 5.13
Chemistry, Inorganic and Nuclear 585 2.25 2.59 Chemistry, Multidisciplinary 563 3.63 4.02
Chemistry, Organic 412 2.75 2.23
Chemistry, Medicinal 346 2.58 1.76
Biochemistry and Molecular Biology 320 4.24 2.67
Chemistry, Physical 229 2.83 1.28
Computer Science, Interdisciplinary Applications 172 1.55 0.53 Pharmacology and Pharmacy 117 2.93 0.68
Biophysics 115 3.12 0.71
(b) GroupBtarget articles.
Subject area Citations IF CI
Crystallography 2996 1.05 4.65
Chemistry, Multidisciplinary 950 3.63 5.11 Chemistry, Inorganic and Nuclear 932 2.25 3.11
Chemistry, Physical 419 2.83 1.76
Chemistry, Organic 359 2.75 1.47
Biochemistry and Molecular Biology 336 4.24 2.11
Chemistry, Medicinal 222 2.58 0.85
Materials Science, Multidisciplinary 213 2.21 0.70 Physics, Atomic, Molecular and Chemical 153 2.45 0.56 Computer Science, Interdisciplinary Applications 143 1.55 0.33
Biophysics 139 3.12 0.64
Pharmacology and Pharmacy 133 2.93 0.58
Table 7
Citations for all four groups of target articles in broad subject categories.
Subject category GroupA GroupB GroupC GroupD
Chemistry 2292 3106 9406 4679
Bioscience 436 460 408 3146
Physics 290 594 1788 1506
Crystallography 2490 2996 4441 1358
Computer Science 311 269 40 287
Other 117 146 401 375
the four categories of target article, as shown in Fig. 3. Inspection of Supplementary TablesEandFshows that LS1 and CSD3 stand out from all of the other target articles in terms of the number of subject areas that cite them (LS2, which is closely related to LS1 in subject matter, attracts the third largest number of subject areas). Over 85% of the cita-tions for CSD3 come from, as would be expected, crystal-lography and various aspects of chemistry; however, the citations for LS1 are much more varied in origin, as shown in Table 8. The top ten subject areas listed here are responsible for 1271 (88.0%) of the total number of citations; they cover fields relating to chemistry, bioscience and computer science but exclude crystallography. Of the 174 ‘all other subject areas’, 17 yielded just a single citation: these were primarily in computer sciences, engineering, materials sciences and medical sciences. TAB1 is cited more than twice as often as LS1 but these citations involve only 51.9% of the number of subject areas for LS1: the impact of TAB1 is thus deep rather
than broad, as demonstrated by the very high value of 108.0 for the mean number of citations per subject area.
When the top 30 subject areas are compared for groupA
and groupBarticles (Supplementary TablesGandH) a high degree of overlap is observed, with 21 of the 30 subject areas in common, and with the non-common areas occurring at the bottom (few citations) of the two rankings. The distribution of citations is extremely skewed (as illustrated by the Zipf-like plots in Supplementary Fig. B). Worthy of note are the ‘aggregate’ impact factors for each scientific area, which show that the CSD attracts citations from important areas of science. The subject areas in Supplementary TablesGandH
illustrate the many disciplines that draw upon the CSD; however, this breadth of impact becomes still more impressive when one considers the ‘All other subject areas’ category. Thus, seven of the 140 ‘All other subject areas’ contribute just a single citation for groupB, but include topics as diverse as Aerospace Engineering, Immunology, Mechanical Engi-neering, Mineralogy and Parasitology.
[image:9.610.44.297.92.224.2]One point that should be emphasized is that all of the analyses reported here have been based on the citation data in the Web of Science database. This database involves careful collation and indexing of much of the world’s core academic literature; however, it is by no means complete. In particular, computer science research is not as tightly tied to the medium of the academic journal as other subjects, with relevant material appearing across a huge range of technical reports, conference proceedings, preprint collections and the like (sometimes referred to generically as the ‘grey literature’). The Web of Science was recently enhanced by the inclusion of the Conference Proceedings Citation Index, which covers important conference publications, and the corresponding citation data. However, it is possible that there has been at
Table 8
Distribution of citations to article LS1 (Table 1) by subject area.
Subject area Citations
Chemistry, Medicinal 307
Biochemistry and Molecular Biology 255 Computer Science, Interdisciplinary Applications 152
Chemistry, Multidisciplinary 146
Pharmacology and Pharmacy 101
Biophysics 92
Chemistry, Organic 81
Computer Science, Information Systems 77
Biochemical Research Methods 31
Mathematical and Computational Biology 29
All other subject areas 174
[image:9.610.43.568.477.729.2]Total 1445
Figure 3
least some degree of under-reporting of the CSD’s impact in computer science and related domains (such as informatics, information systems and artificial intelligence) when compared with the other subject domains that are detailed in, for example, Table 7 and that are very extensively covered in the Web of Science. A future study of the sort reported here might hence also use the Google Scholar database, which has been suggested by some as an alternative, or complementary, source of citation data for bibliometric analyses that need to encompass a broader range of types of material (Bar-Ilan, 2008b; Jacso, 2005; Sanderson, 2008).
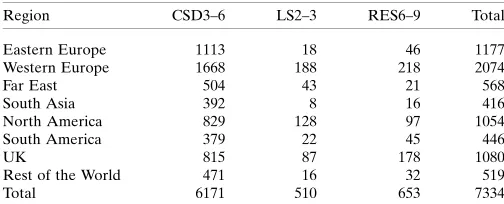
3.4. Citations analysed by geographic region
The CSD has been distributed to 72 different countries, and the citations to the target articles are even more widespread, coming from a total of 87 different countries (although, following WoK, England, Northern Ireland, Scotland and Wales are regarded as four distinct countries). The distribution of citations across the eight geographic categories is shown in Table 9. The numbers of citations here (and elsewhere in this section) are generally greater than in previous tables: this is because there were, on average, 1.3 countries associated with each citing article. Similar comments apply to the institutional analysis at the end of this section, where there were, on average, 1.5 and 1.3 institutions associated with each citing article for groupsAandB, respectively.
It is interesting to compare the figures in Tables 9(a) and 9(b) with those quoted by Redman et al. (2001) in their analysis of ten CCDC articles (eight of which are also in group
A). When their analysis was conducted (1999), the CSD was distributed to 46 different countries, and western Europe
including the UK provided 50.5% of the total citations to the chosen articles. This dominance is now much reduced, with western Europe plus the UK providing 26.0 and 43.0%, respectively, of the total citations of the groupAand groupB
target articles. The former figure is particularly low because of the Chinese citations to TAB1–2 that are discussed below.
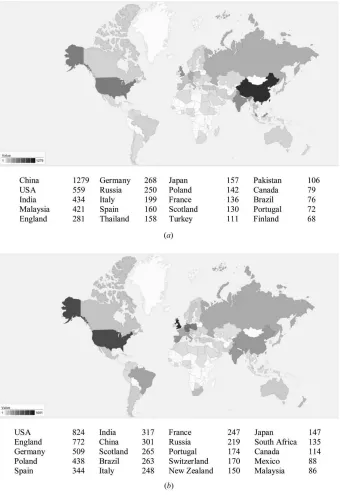
Turning now to individual countries, Fig. 4 shows the geographic distribution of citations to the groupAand group
Btarget articles for 2005–2008, with the top 20 citing countries listed below the figure. It will be seen that China is the highest citing nation in Fig. 4(a). This arises in large part from the very extensive use that has been made of the target articles TAB1– 2: specifically, the 1154 Chinese citations to TAB1–2 provide no less than 29.7% of the total citations to these two articles. No other single country provides more than 20% of the cita-tions to a group of target articles, with the sole exception of the USA: this provides 23.7% of the total citations to LS1 and 21.6% of the total citations to LS2–3, which reflects that nation’s pre-eminence (both academic and industrial) in the life sciences. It is less obvious why there are so many Chinese citations to TAB1–2, these two target articles accounting for no less than 90.2% of the total Chinese citations to groupA. Research and development in China is growing very rapidly (Zhou & Leydesdorff, 2006; Zhouet al., 2009) and it is hence likely that the basic data contained in these articles would be of increasing value to a wide range of researchers; even so, it is not clear why these two publications are of such particular interest as compared to the other 18 target articles. Never-theless, for TAB1, it does appear that the citations from 2005– 2008 were largely caused by a sudden increase in the number of crystal structures solved throughout China and published in
ACE.
3.5. Citations analysed by institution type
[image:10.610.44.296.246.348.2]Finally we report the distribution of citations across the institutional categories: full data are shown in Supplementary TablesI andJ. The intention had been to analyse the 2005– 2008 citations; however, the TAB1, LS1 and CSD3–4 outputs each contained more than the limit of 500 different institutions that can be handled using the WoK display options; accord-ingly, the figures in the supplementary tables refer to just the 2008 citations. Unsurprisingly, the great majority of the cita-tions come from academic organizacita-tions of various sorts. What may be more surprising are the identities of some of the academic organizations that cite the target articles: thus, the ten heaviest citers of the groupAarticles were (in descending order) Universiti Sains Malaysia (Malaysia), Nanjing University of Technology (China), Prince of Songkla Univer-sity (Thailand), Russian Academy of Sciences, Mangalore University (India), Karunya University (India), Quaid-I-Azam University (Pakistan), University of Madras (India), Chinese Academy of Sciences and Polish Academy of Sciences. It is no coincidence that authors from many of these institutions are regular and prolific contributors toACEand other crystallographic journals. The list does, however, demonstrate clearly the contribution that the CCDC makes to
Table 9
Citations to target articles from different geographic regions during 2005– 2008.
(a) GroupAtarget articles.
Region CSD1–2 TAB1–2 LS1 RES1–5 Total
Eastern Europe 38 431 33 147 649
Western Europe 84 503 353 190 1130
Far East 38 1795 115 134 2082
South Asia 15 487 47 64 613
North America 43 222 258 139 662
South America 1 113 17 8 139
UK 32 190 132 75 429
Rest of the World 31 144 29 25 229
Total 282 3885 984 782 5933
(b) GroupBtarget articles.
Region CSD3–6 LS2–3 RES6–9 Total
Eastern Europe 1113 18 46 1177
Western Europe 1668 188 218 2074
Far East 504 43 21 568
South Asia 392 8 16 416
North America 829 128 97 1054
South America 379 22 45 446
UK 815 87 178 1080
Rest of the World 471 16 32 519
international science. There are fewer, but still a non-trivial number of, cita-tions from commercial organizacita-tions; these citations demonstrate the value of the target articles beyond academia, with most attention being paid to LS1 and CSD3–6 by biosciences companies such as Astex Therapeutics, Astra-Zeneca and Bristol-Myers Squibb.
3.6. Citations to articles by non-CCDC authors (groupCand groupD)
Citations to group C and group D
articles are, in a sense, secondary cita-tions to the CSD itself. However, they are highly important citations, in that they reflect the real extent of use of crystal structure information. Citations to articles in these two groups were analysed by time, journal, subject area and geographic region as for groupsA
and B; analysis by institutional type was not carried out since this was considered to be less important than the institutional citations directly to the CSD discussed above.
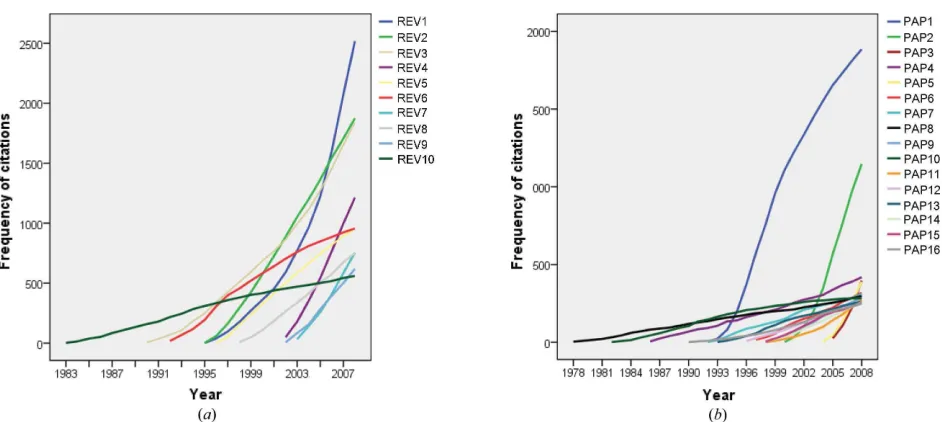
[image:11.610.225.566.71.566.2]3.6.1. Analysis of citations over time. The cumulative citation frequen-cies for each of the target articles in groupsCandDare shown in Figs. 5(a) and 5(b), respectively. The citation counts are from the date of publication for each of the articles up to the end of 2008. The most striking feature of the reviews in group C (Table 3) is that they all use the CSD to obtain and categorize knowledge of intermol-ecular interactions across a very broad chemical range. This review activity can be readily correlated with the vastly increased interest over the past 10–15 years in topics such as crystal engi-neering, protein folding and protein– ligand interactions. The CSD and soft-ware tools for researching nonbonded interactions have both responded to and fuelled research in this crucial area.
Reference to Fig. 5(a) shows the very rapid growth in citations to REV1; this was published in 1995 but 51.5% of its citations have come in just the past three years (2006–2008). Conver-sely, REV2 has achieved its own substantial impact by steady citation since its publication in the same year as REV1, and similar regular accruals characterize the impact of REV3. Of the other articles in this group, REV7 is perhaps the most notable, having attracted circa 130 citations a year since its publication as recently as 2003. The citations to group D
(Fig. 5b) are dominated by those to PAP1–2, both of which have averaged well over 100 citations a year since their publication in 1991 and 2000, respectively. PAP1 is analogous to the TAB papers in groupA, since it reports key geometrical data for amino acids and peptides that are essential for protein modelling and crystal structure refinement. Substantial annual rates are also exhibited by PAP3 and PAP5; otherwise, the target articles show regular, but much lower, annual rates of citation with the highest of these rates being 26.5, for PAP6
Figure 4
published in 1996. As with the reviews of groupC, research studies that are concerned with intermolecular interactions tend to dominate groupD, and for the reasons set out above.
3.6.2. Analysis of citations by journal. Analyses analogous to those described previously demonstrate the very large numbers of journals that cite the target articles: 467 different journals cite REV1–10 in groupCand 584 different journals cite PAP1–16 in groupD. Journals that provide > 250 citations are shown in Table 10 and more complete data are given in Supplementary Tables K and L. The top 30 journals in Supplementary TableK(review articles) account for 71.6% of the total citations to the groupCarticles. The results here are very similar to those for groups A and B: Acta Crystal-lographica Sections EandCgenerate the most citations, and many of the journals here can also be found in the top 30 for group A (19 journals) and group B (17 journals). Above-average CI values are exhibited by Journal of the American Chemical Society, Crystal Growth and Design, Cryst-EngComm, Inorganic Chemistry, Angewandte Chemie Inter-national EditionandDalton Transactions.
The top 30 journals in Supplementary Table L (research articles) account for 59.0% of the total citations to the group
Darticles. The results here are slightly different. While there are again many journals that can also be found in the listings for groupA(16 journals), groupB(20 journals) and groupC
(20 journals), some groupDjournals do not occur elsewhere, most obviously journals that contain significant life sciences and protein structural content, e.g. Journal of Molecular Biology, Biochemistry, Acta Crystallographica Section D,
Structure, Protein Science, EMBO Journal and the multi-disciplinaryProceedings of the National Academy of Sciences. The presence of PAP1, PAP5, PAP7 and PAP13 in the groupD
list (Table 4) is responsible for this variation. There are above-average CI contributions from the following journals:Journal of Biological Chemistry,Crystal Growth and Design,Structure,
[image:12.610.44.297.105.258.2]Chemistry – A European Journal,Chemical Communications,
Figure 5
Cumulative frequency of citations to target articles up to 2008: (a) groupCarticles; (b) groupDarticles. Table 10
Journals that cited target articles most frequently since publication.
(a) GroupCtarget articles (at least 250 citations).
Journal source Citations IF CI
Acta Crystallographica Section E: Structure Reports Online
1499 0.37 0.59
Acta Crystallographica Section C: Crystal Structure Communications
1045 0.56 0.62
Journal of the American Chemical Society 555 8.09 4.78
Crystal Growth and Design 517 4.22 2.32
CrystEngComm 430 3.54 1.62
Inorganic Chemistry 345 4.15 1.52
Journal of Molecular Structure 335 1.59 0.57
Chemical Communications 328 5.34 1.86
Acta Crystallographica Section B: Structural Science 300 2.34 0.75
Chemistry – A European Journal 274 5.45 1.59
Angewandte Chemie International Edition 265 10.88 3.07
Dalton Transactions 262 3.58 1.00
(b) GroupDtarget articles (at least 100 citations).
Journal source Citations IF CI
Journal of Molecular Biology 439 4.15 3.16
Journal of the American Chemical Society 266 8.09 3.73
Inorganic Chemistry 245 4.15 1.76
Biochemistry 242 3.38 1.42
Acta Crystallographica Section D: Biological Crystallography
223 2.94 1.14
Acta Crystallographica Section C: Crystal Structure Communications
208 0.56 0.20
Journal of Biological Chemistry 186 5.52 1.78
Crystal Growth and Design 178 4.22 1.30
Acta Crystallographica Section E: Structure Reports Online
172 0.37 0.11
CrystEngComm 159 3.54 0.98
Structure 154 5.40 1.44
Dalton Transactions 140 3.58 0.87
Inorganica Chimica Acta 134 1.94 0.45
Chemistry – A European Journal 131 5.45 1.24
European Journal of Inorganic Chemistry 115 2.69 0.54
Chemical Communications 111 5.34 1.03
Polyhedron 108 1.80 0.34
Inorganic Chemistry Communications 107 1.85 0.34
[image:12.610.71.542.521.732.2]Angewandte Chemie International Edition,Proceedings of the National Academy of SciencesandEMBO Journal.
3.6.3. Analysis of citations by subject area. The most important subject-area data are listed in Table 11, with more complete information in Supplementary TablesMandN. For group C, the mean frequency of citation per target article across the 64 unique subject areas is 31.4, although this is, as always, very skewed with 19 subject areas providing just a single citation (e.g.Dermatology, Nutrition and Dietetics, and Remote Sensing Telecommunications to name some of the more unexpected areas). Overall, the citations are predomi-nantly derived from crystallography- and chemistry-related disciplines, with the great majority of the subject areas in Supplementary TableMalso appearing in the corresponding tables for group A (24 subjects) and group B(26 subjects). Above-average contributions are exhibited by six subject areas from chemistry, crystallography and materials science. For group D (Table 11b and Supplementary Table N), the mean frequency of citation per target article across the 91 unique subject areas is 29.4, with 18 subject areas providing just a single citation [e.g. Education (Scientific Disciplines), Management, Medicine (Legal) and Optics]. As with groupC, the great majority of the subject areas here also appear in the corresponding tables for groupA(24 subjects) and group B
(25 subjects). Reference to Table 7 reveals that the largest number of citations comes from chemistry, as is also the case
[image:13.610.45.298.108.230.2]for groupsBandC. What is notable for groupD, though, is that there are proportionally far fewer citations from crystal-lography than for the other groups of target articles, and proportionally far more from biosciences: no less than 27.7% of the groupDcitations come from bioscience subject areas, with the next highest bioscience figure being as low as 7.3% (for groupA). This is also reflected in the CI values in the table: there are above-average contributions from Biochem-istry and Molecular Biology, Biophysics and Cell Biology, with only the first making an above-average contribution to any of the other three groups of target articles.
3.6.4. Analysis of citations by geographical region. The geographical data for groupCand groupDarticles are given in Table 12, where they are compared with data for groupA
and groupBarticles from this study, and with similar data for the period 1994–1998 (Redmanet al., 2001), where the group of articles studied is closely similar to the present groupA. While reviews usually attract higher citation rates than stan-dard research articles, the reviews in groupCare highly cited from all parts of the world. Given their subject matter, this shows the international interest in supramolecular chemistry in general, and the specifics of hydrogen bonding and nonbonded interactions in crystal engineering and the life sciences in particular. Some 48% of groupC citations come from Europe (western, eastern and the UK), 29% from Asia and the Far East, and 19% from North and South America. The research articles of group D also attract consistent international citations, with 50% from Europe, 20% from Asia and 26% from the Americas. The citation-rate reversal for these last two broad regions by comparison with the groupC
reviews reflects again the increased attention given to the life sciences (in comparison with, e.g., crystal engineering) in North America, whereas these two subject areas are almost exactly balanced within Europe, at least in terms of citation analysis. The most obvious outcome of the citation-rate comparison with the data of Redman et al. (2001) is the dramatic increase in citations arising from Asia and the Far East. These amounted to only 8% of all citations in 1999, but by 2009 this rose to 45% of current groupAarticles, 13% of groupB, 29% of groupCand 20% of groupD. The groupA
citation rate has already been discussed in terms of the greatly increased output of crystal structures from Asian laboratories, leading to increased citation rates inACEand other
crystal-Table 11
Subject areas that cited target articles at least 100 times since publication.
(a) GroupCtarget articles.
Subject area Citations IF CI
Crystallography 4441 1.05 3.20
Chemistry, Multidisciplinary 3838 3.63 9.59 Chemistry, Inorganic and Nuclear 2145 2.25 3.32
Chemistry, Physical 1624 2.83 3.16
Chemistry, Organic 1440 2.75 2.73
Materials Science, Multidisciplinary 875 2.21 1.33 Physics, Atomic, Molecular and Chemical 492 2.45 0.83 Biochemistry and Molecular Biology 337 4.24 0.98
Spectroscopy 166 1.81 0.21
Biophysics 133 3.12 0.29
Chemistry, Medicinal 112 2.58 0.20
(b) GroupDtarget articles.
Subject area Citations IF CI
Biochemistry and Molecular Biology 2263 4.24 8.93 Chemistry, Multidisciplinary 1605 3.63 5.42 Chemistry, Inorganic and Nuclear 1431 2.25 3.00
Crystallography 1358 1.05 1.32
Biophysics 849 3.12 2.47
Chemistry, Organic 588 2.75 1.51
Chemistry, Physical 578 2.83 1.52
Cell Biology 398 5.70 2.11
Biochemical Research Methods 319 3.27 0.97 Materials Science, Multidisciplinary 317 2.21 0.65
Chemistry, Medicinal 251 2.58 0.60
[image:13.610.312.565.113.219.2]Computer Science, Interdisciplinary Applications 189 1.55 0.27 Physics, Atomic, Molecular and Chemical 184 2.45 0.42 Pharmacology and Pharmacy 140 2.93 0.38 Multidisciplinary Sciences 138 8.74 1.12
Table 12
Citations to groupCand groupDtarget articles by geographic region by comparison with articles in groupAand groupBand with 1999 data from Redmanet al.(2001).
1999 2009
Region Redman GroupA GroupB GroupC GroupD
Western Europe 1627 1130 2074 4035 3291 North America 852 662 1054 2518 2306 Eastern Europe 640 649 1177 1604 514
UK 564 429 1080 1961 995
South Asia and Far East 324 2695 984 4581 1899
South America – 139 446 554 162
Rest of the World 327 229 519 706 366
[image:13.610.44.297.194.406.2]lographic journals; the higher proportions of citations to articles in the other current groups (B,C,D) is, perhaps, a true reflection of the overall increase in published scientific output from the Asian region.
4. Conclusions
The analysis has revealed a number of trends, some obvious and some more subtle. Among the more obvious is the very rapid rise in scientific output, particularly crystallographic, from Asia and the Far East. This is manifested not only in the analyses of citations by geographic region of origin but also in the analyses by journal and by institution. Here, large numbers of citations to printed data compendia and to the crystal-lographic databases originate from specialist crystalcrystal-lographic journals, particularly Acta Crystallographica Section E, all of which now publish a high proportion of papers from Asia and the Far East. It is no accident that institutions from,inter alia, Malaysia, China, Thailand, Indiaetc. are highly placed in the institutional analysis. Indeed,Acta Crystallographica Section E
is something of a publishing phenomenon: it has contributed well in excess of 23 000 crystal structures to the CSD in the nine years of its existence, some 2000 more than the previously most prolific journal (the ACS journalInorganic Chemistry). The fact thatActa Crystallographica Section Enow provides a highly effective platform for the publication of structures that might otherwise have gone unpublished is to be applauded, and the effects of this publishing phenomenon ripple through the current analysisviathe citations it generates.
It is no surprise that the journals that cite the CSD speci-fically (our group Aand group Barticles) are heavily corre-lated with the journals that publish the most crystal structures and therefore dominate CSD journal statistics.Acta Crystal-lographica Section E has already been mentioned, and the other major contributors to the CSD areInorganic Chemistry,
Organometallics, Journal of the American Chemical Society,
Dalton Transactions, Chemical Communications, Journal of Organic Chemistry and Sections B and C of Acta Crystal-lographica. This is no accident, especially in the area of metal– organic chemistry, which relies heavily on crystallography for the characterization of novel compounds and on the CSD itself to locate suitable related compounds (and their geometries) for literature discussion. Thus, general, inorganic and organic chemistry remain the major areas for CSD cita-tions, just as they did in the previous analysis of Redmanet al.
(2001).
However, a major difference in citation behaviour since 1999 concerns the rise of crystal engineering as a sub-disci-pline in its own right, with its focus on the supramolecular nature of extended crystal structures and the intermolecular interactions that determine these extended structures. In the past decade two significant new journals,CrystEngCommand
Crystal Growth and Design, began publication, in 1999 and 2001 respectively. Not only have they published > 8500 novel crystal structures in that time, they also include many papers that use CSD information in a research context, or which build on systematic studies published elsewhere (e.g.as reported in
the reviews of Table 3). Thus their citation rates both to the CSD itself and to the reviews and research papers that dominate our groupCand groupDarticles are already very high, despite their relative youth in publication terms. Indeed, there is a unique synergy between crystal engineering and the CSD, since the former depends on exploiting robust and reproducible intermolecular interactions, while the latter provides a unique resource for identifying and analysing such interactions. Since crystal structure analyses are fundamental to our understanding of intermolecular interactions, it is no surprise also that this area of CSD-based research has generated a number of ‘citation classics’, such as RES1 (Table 1), REV1–3 (Table 3) and PAP2 (Table 4).
Another area that has seen a significant increase in citations to papers in all of the groups studied here is that of structural biology and the life sciences,e.g.through PAP1, PAP5, PAP7 and PAP13 published by CSD users and listed in Table 4. At a more parochial level, the CCDC made a clear decision in the late 1990s to diversify (with academic and industrial colla-borators) into the development of informatics-based applica-tions for pharmaceutical research and development, as illustrated by the LS articles included in Tables 1 and 2. Both of these external and internal activities have, since 1999, greatly extended the range of journals and subject areas that cite the CSD and CCDC publications within structural biology, medicinal chemistry and computational informatics. An additional and very welcome difference between this study and its 1999 predecessor (Redmanet al., 2001) is an increase in citations from the area of materials development, an area that we believe will show significant expansion in coming years.
Finally, we note that this analysis confirms the crucial scientific importance of information provided by crystal structure analyses, both in terms of the breadth of subject areas and journals that cite its use, and in its depth of use in some of these areas, such as crystal engineering and drug discovery. The crystallographic databases have proved to be major conduits for the delivery of this information in acces-sible forms to scientists in a wide variety of disciplines, and it is only through analyses of the type described here and else-where (Redmanet al., 2001; Behrens & Luksch, 2006) that we can assess and quantify the major impact of crystal structure analysis in the broader scientific community.
References
Allen, F. H. (2002).Acta Cryst.B58, 380–388.
Allen, F. H., Bellard, S., Brice, M. D., Cartwright, B. A., Doubleday, A., Higgs, H., Hummelink, T., Hummelink-Peters, B. G., Kennard, O., Motherwell, W. D. S., Rodgers, J. R. & Watson, D. G. (1979).
Acta Cryst.B35, 2331–2339.
Allen, F. H., Davies, J. E., Galloy, J. J., Johnson, O., Kennard, O., Macrae, C. F., Mitchell, E. M., Mitchell, G. F., Smith, J. M. & Watson, D. G. (1991).J. Chem. Inf. Comput. Sci.31, 187–204.
Allen, F. H., Johnson, O., Shields, G. P., Smith, B. R. & Towler, M. (2004).J. Appl. Cryst.37, 335–338.
Allen, F. H., Kennard, O. & Taylor, R. (1983).Acc. Chem. Res.16,