INJAVA
By
Sri Harijati Hatmadji
A thesis submitted for the degree of
Doctor of Philosophy
Department of Demography, Australian National University
Except where indicated, this thesis is my own work undertaken as a scholar from 1986 to 1990 in the Department of Demography, Australian National University.
ACKNOWLEDGEMENTS
I would like to express my gratitude to the Faculty of Economics, University of Indonesia for giving me the privileged to enter a Ph.D. program, and to the World Bank for awarding me a scholarship. I owe a great debt to the Australian National University, for providing me with the institutional supports, field work allowance, and precious supervision necessary to carry out this study.
My principal supervisor, Professor Gavin W. Jones, and my second supervisor Dr. Ian D. Diamond have generously and patiently shared their time and substantial research experience in providing careful and encouraging guidance. Dr. Terence H. Hull, who was formerly also my supervisor, has been an outstanding adviser, having dissected my work with perceptive thoroughness. Dr. Gigi San tow has given her time and knowledge in helping me to formulate my research plan and set it on course and I owe her a sincere debt of gratitude. I am also grateful to Professor John C. Caldwell and Ms. Pat Caldwell for their invaluable comments on the micro study chapters, to Dr. Geoffrey McNicoll for his thoughtful discussions and important comments on the thesis, and to Dr. Siew-Ean Khoo for her considerable advice in the early stage of the thesis.
shared an office - for their help, support and friendship.
The form my thesis has taken would have been very different without the data generously made available by the Central Bureau of Statistics and National Family Planning Coordinating Board, and for that I would like to express my deep appreciation to Dr. S.G.M. Mamas and Ms. Poedjastoeti from the CBS and Dr. E. Sri Hartati S. Pandi, Dr. Pudjo Rahardjo, Dr. Sahala Pandjaitan, and Dr. Sugeng Waluyo and their staff from the NFPCB. I owe a great debt to the administrative officials and the people in kabupaten Serang, Purwakarta, Tegal, Gunung Kidul, and Probolinggo for their cooperation, friendship and hospitality. My great thanks go to all my interviewer assistants who shared the experience of the study and worked with great enthusiasm.
ABSTRACT
The government family planning program in Indonesia has achieved remarkable results. For example, in the most populous island of Java, where family planning was initially implemented in the 1970s, more than 2 million new clients were recruited annually through the 1980s, and more than half the island’s fecund women were reported to be users of contraception in 1987. Moreover, fertility declined in Indonesia over the past two decades from 5.6 children per woman to 3.2.
This thesis reviews the problem of population growth and its components in Java, as well as the development of the family planning program. It then discusses determinants of contraceptive use in Java, using areal multiple regression analysis, which found that one third of the variation in family planning adoption in Java’s kabupaten is determined by the probability of infant death. Although it has a very small magnitude, beside other socio-economic factors, the family planning program input is also found to significantly affect the family planning practice. The examination of the direct effect of the predictors to the dependent variable on the basis of Hermalin’s path diagram confirmed the general expectation that contraceptive use had a significant effect on the fertility change in Java between 1967-1970 and 1976-1979 even after taking into account other development programs in the area.
CONTENTS
Declaration ii
Acknowledgements iv
Abstract vi
List of Tables and Figures x
List of Appendix xvi
Chapter 1 Introduction
1.1 Family planning in Indonesia: An overview 1
1.2 Study objectives 7
1.3 Analytical framework 8
1.4 Thesis structure 24
Chapter 2 Data Sources and Methods
2.1 Sources of quantitative data. , 26
2.2 Source of qualitative data. 30
2.3 Units of analysis. 32
2.4 Methods of analysis 36
. 2.5 Summary 39
Chapter 3 The Areal Setting: Population, Fertility and Family Planning in Java
3.1 Introduction 40
3.2 Population growth 41
3.3 Fertility decline in Java and in other islands 46
3.4 Age at first marriage 49
3.5 Mortality trends and regional differentials 56
3.6 Family planning program 58
Chapter 4 Determinants and Evaluation of Family Planning in Java: An Areal Analysis
4.1 Examination of variables 74
4.1.1. Stages in variable selection 74
4.1.2. Selection of demographic and ecological variables 76 4.1.3. Selection of socio-economic and related variables 81
4.1.4. Selection of family planning program variables 84
4.2 Determinants of contraceptive use 85
4.2.1. Stepwise and block stepwise regressions 85
4.2.2. Determinants of contraceptive use 88
4.3 Family planning evaluation 92
4.3.1. Measures of family planning efficiency 92
4.3.2. Application of the predictive model 94
4.3.3. Index of Efficiency 98
4.4 Summary 103
Chapter 5 The Effect of the Family Planning Program on Fertility Change in Java: A Multivariate Areal Analysis
5.1 Introduction 105
5.2 Test of significance of interactions 107
5.3 Preliminary investigation 108
5.4 Path analysis of fertility change 124
5.5 Summary 131
Chapter 6 Family Planning and Fertility in Central Java: A Case in Kabupaten Tegal
6.1 Introduction 132
6.2 Reason for and aims of field work 133
6.3 Interviewing units and information collected 135
6.4 Case study 137
6.4.1. B ackground information 137
6.4.3. Result of fieldwork in kecamatan Suradadi. 151
Chapter 7 Comparison and Contrast in Regional Experiences in Family Planning Program Implementation in Java
7.1 The program in kabupaten Probolinggo 159
7.1.1. The areal setting 159
7.1.2. The implementation and reception of the program 164
7.2 The program in kabupaten Purwakarta 168
7.2.1. Areal setting 168
7.2.2. The implementation and reception of the program 172
7.3 The program in kabupaten Serang 175
7.3.1. Areal setting 175
7.3.2. The implementation and reception of the program 178
7.4 The program in kabupaten Gunung Kidul 181
7.4.1. Areal setting. 181
7.4.2. The implementation and reception of the program 187
7.5 Summary 190
Chapter 8 Discussion and Conclusion
8.1 Discussion 193
LIST OF TABLES
Table 1.1a Estimated fertility rates for kabupaten in West Java based on
the 1971 and 1980 Indonesian Population Censuses 9
Table 1.1b Estimated fertility rates for kabupaten in Yogyakarta based on
the 1971 and 1980 Indonesian Population Censuses 9
Table 1.1c Estimated fertility rates for kabupaten in Central Java based on
the 1971 and 1980 Indonesian Population Censuses 10
Table l .ld Estimated fertility rates for kabupaten in East Java based on
the 1971 and 1980 Indonesian Population Censuses 11
Table 1.2a Estimated proportion of married women of reproductive age
using contraception by kabupaten in West Java, 1979 12
Table 1.2b Estimated proportion of married women of reproductive age
using contraception by kabupaten in Yogyakarta, 1979 12
Table 1.2c Estimated proportion of married women of reproductive age
using contraception by kabupaten in Central Java, 1979 13
Table 1.2d Estimated proportion of married women of reproductive age
using Contraception by kabupaten in East Java, 1979 14
Table 2.1 Sources of quantitative data and the chapters employing them. 29
Table 2.2 Favourable level of aggregation by different relevance of analysis. 34
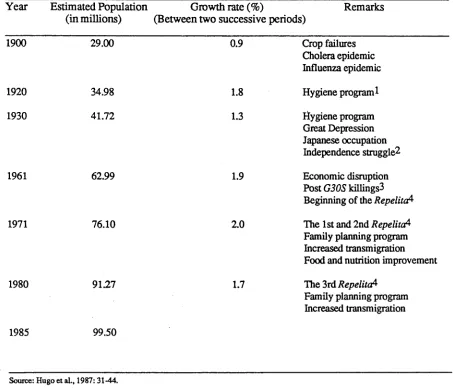
Table 3.1 Population growth in Java in the twentieth century. 43
Table 3.2 Annual Population growth rate in Java by province, 1961-1985. 44
Table 3.3 Total fertility rate (TFR) in Indonesia by region based on the 1971
and 1980 Censuses and 1985 Survey. 47
Table 3.4 Mean and median age at first marriage of ever married women in Java
by marriage cohort. 51
Table 3.5 Trends in the Singulate Mean Age at Marriage of women in Java,
1964-1985. 55
Table 3.6 Estimated infant mortality rates in Java from the 1971 and 1980
Censuses and 1985 Intercensal Survey, by province. 57
Table 3.7 Java estimated proportion of married women aged 15-44 years using contraception by province, in selected years under successive
Development Plans (Repelita). 64
Table 4.1 Correlation^) matrix of seven selected: demographic and ecological
Table 4.2 List of variables and correlation coefficient with current users and
fertility change 79
Table 4.3 Correlation matrix of six selected: socio-economic and related variables 82
Table 4.4 Equations 1 and 2 of the regression of proportion using contraception 83
Table 4.5 Results of the stepwise multiple regression on proportion using
contraception 86
Table 4.6 Results of the block stepwise multiple regression of proportion using
contraception 87
Table 4.7 Result of stepwise and hierarchical regression of proportion using
contraception 88
Table 4.8 Results of hierarchical regression of proportion using contraception 90
Table 4.8 (Continued) Result of combination of stepwise and hierarchical
regression of proportion using contraception 91
Table 4.9a Contraceptive use, observed* and predicted rates and index of
efficiency, in kabupaten in Central Java 1982. 96
Table 4.9b Contraceptive use, observed and predicted rates and index of
efficiency, in kabupaten in West Java, 1982. 97
Table 4.9c Contraceptive use, observed* and predicted rates and index of
efficiency, in kabupaten in Yogyakarta 1982. 97
Table 4.9d Contraceptive use, observed* and predicted rates and index of
efficiency, in kabupaten in East Java 1982. 98
Table 4.10 The ten most and least efficient kabupaten in implementing family
planning program according to the two measurements*, Java 1982. 100
Table 5.1 Result of hierarchical analysis of variance of fertility differences
on selected variables. 110
Table 5.2 Unadjusted and adjusted per cent of fertility change by selected
variables. 112
Table 5.3 Unadjusted and adjusted per cent of fertility change by selected
variables. 113
Table 5.4 Unadjusted and adjusted per cent of fertility change by selected
variables. 115
Table 5.5 Unadjusted and adjusted per cent of fertility change in districts
with IMR<90 by selected variables. 117
Table 5.6 Unadjusted and adjusted per cent of fertility change in districts
with 90-125 IMR by selected variables. 118
Table 5.7 Unadjusted and adjusted per cent of fertility change in districts
Table 5.8 Unadjusted and adjusted per cent of fertility change in districts with
IMR < 100 by selected variables. 121
Table 5.9 Unadjusted and adjusted per cent of fertility change in districts with
IMR=100 and over by selected variables. 122
Table 5.10 Direct effect/ path coefficients (betas) and coefficient of
determinations (R2) for specified combinations of variables 128
Table 6.1 Some characteristics of the selected kabupaten in Java. 135
Table 6.2 Number of children aged 0-4 years and women aged 15-49 years by
kabupaten or kotamadya, Central Java 1980. 141
Table 6.3 Rates of population growth for the years 1961-1971 and 1971-1980 by
kabupaten or kotamadya, in Central Java 142
Table 6.4 Percentage distribution of women aged 15-49 years by age group and
status of schooling, Kabupaten Tegal, 1980. 144
Table 6.5 Percentage distribution of married women by educational attainment
and birth control usage, kabupaten Tegal, 1980. 146
Table 6.6 Respondents by educational attainment and age group, Kecamatan
Balapulang 1987. 148
Table 6.7 Respondents by educational attainment and age at first marriage,
kecamatan Balapulang, 1987 150
Table 6.8 Respondents who ever used contraception by age, number of living children and reason for using contraception, kecamatan
Balapulang, 1987 152
Table 6.9 Respondents by educational attainment and age group, Kecamatan
Suradadi, 1987. 153
Table 7.1 Percentage distribution of women aged 15-49 years, by age group and
educational attainment, in kabupaten Probolinggo, 1980. 160
Table 7.2 Respondents by age group,age at marriage, type of marriages and
educational attainment, in kabupaten Probolinggo, 1987. 162
Table 7.3 Percentage distribution of married women by educational attainment
and birth control usage, kabupaten Probolinggo, 1980. 163
Table 7.4 Respondents by age groups, number of living children and desire for
more children, kabupaten Probolinggo, 1987. 165
Table 7.5 Percentage distribution of women aged 15-49 years, by age group and
educational attainment, in kabupaten Purwakarta, 1980. 170
Table 7.6 Respondents by type of marriage and educational attainment,
Table 7.7 Percentage distribution of married women aged 15-49 years by educational attainment and birth control usage, kabupaten
Purwakarta, 1980. 172
Table 7.8 Ever users by contraceptive means currently used and kecamatan,
kabupaten Purwakarta, 1987. 174
Table 7.9 Respondents by age groups, number of living children and desire for
more children, kabupaten Purwakarta, 1987. 175
Table 7.10 Percentage distribution of women aged 15-49 years, by age group
and educational attainment, in kabupaten Serang, 1980. 176
Table 7.11 Percentage distribution of married women aged 15-49 years by educational attainment and birth control usage, kabupaten
Serang, 1980. 177
Table 7.12 Percentage distribution of women aged 15-49 years, by age group
and educational attainment, in kabupaten Gunung Kidul, 1980. 182
Table 7.13 Respondents by duration of breastfeeding period and some selected
LIST OF FIGURES
Figure 1.1 Percentage of married women who were annually recorded as new
clients, Indonesia, 1971-1984 5
Figure 1.2 A framework for the anlysis of fertility change 23
Figure 2.1 Administrative division in Indonesia 33
Figure 3.1 Percentage distribution of kabupaten in Java by population density
classification, 1920-1980 45
Figure 3.2 Percentages of TFR difference 1967-1970 and 1976-1979 by kabupaten
in Java 48
Figure 3.3 Fertility pattern in each province in Java, 1967-1970, 1976-1979
and 1981-1984 50
Figure 3.4 Proportion women aged 15-19 and 20-24 who are single in Java,
1971-1980 52
Figure 3.5 Proportion of females aged 20-24 years who are single
by kabupaten in Java 54
Figure 3.6 Infant mortality rate (IMR) per 1000 births by kabupaten in Java, 1979 59
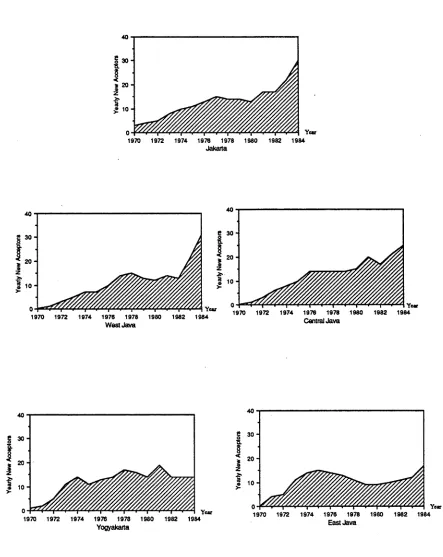
Figure 3.7 Percentage of new acceptors annually in Java, 1970-1984 63
Figure 3.8 Contraceptive prevalence rate (%) by kabupaten in Java, 1979 65
Figure 3.9 Family planning current users in Java, 1973-1987 66
Figure 3.10 Percentage of women 15-49 years using pill, IUD or condom by age
group and province, Java 1976-1980 68
Figure 3.11 Percentage distribution of all new acceptors by pills, IUDs and
condoms used, Java, 1970-1984. 69
Figure 3.12 Per cent distribution of currently married contraceptive users aged
15-49, by method used and province, Java, 1987. 70
Figure 4.1 Analytical framework for determinants of contraceptive use. 80
Figure 4.2 Family planning efficiency index in four provinces in Java, 1982 101
Figure 4.3 Predicted contraceptive prevalence rate by kabupaten in Java, 1982. 102
Figure 5.1 Analytical framework of fertility change 124
Figure 5.2 Direct effect of each predictors on Contraceptive use and
Fertility change. 127
Figure 6.2 Kabupaten Tegal 140
Figure 6.3 Proportion of females aged 15-49 years who are illiterate by kabupaten
in Java, 1980 145
Figure 7.1 Percentage distribution of age at marriage in selected kabupaten
in Java, 1980. 184
Figure 7.2 Proportion of women aged 15-49 years by educational attainment in
LIST OF APPENDIX
A4.1 List of variables and the definition 204
A4.2 Derivation of standard of living index 205
A5.1 Two way analysis of variance for all possible pairs of independent
variables 207
A6.1a Kabupaten in West Java by score 209
A6.1b Kabupaten in Central Java by score 210
A6.1c Kabupaten in Yogyakarta by score 211
A6.1d Kabupaten in East Java by score 212
A6.2 Kabupaten in Java 213
A6.3 Information collected from field survey 214
A6.4 Statement of the Legislative Body (Syuriah) of Nahdlatul Ulama,
September 1969. 216
A6.5 Several conclusions from the Nahdlatul Ulama’s Limited Conference,
July 1979 217
A7.1 Proportion of population aged 7-12 years by status of educaton and
kabupaten or kotamadya, West Java, 1980 218
Chapter 1
Introduction
1.1 Family planning in Indonesia: An overview
The idea of birth control was advocated by several community leaders in Indonesia in the early 1950s, but it was only in 1957 that a non-government organization, the Indonesian Planned Parenthood Association (Indonesian acronym PKBI) was founded, and later associated with the IPPF. As a family planning organization in a tacitly pronatalist country, the PKBI was not supported by the existing government (Hull and Mantra, 1981: 262-288; BKKBN, 1983: 21). However, with the strong political connections of the elite, this organization gradually established a network of clinics across the archipelago in the late 50s and early 60s (Hull, 1990: 7).
In 1966, the Indonesian ‘New Order’ government was formed and led by General Suharto. This ‘New Order’ government recognized the population situation as a possible obstacle to socio-economic development, so in 1967 President Suharto joined other world leaders in signing the United Nations Declaration on Population, which accepted birth control as a basic human right. The government’s serious commitment to family planning was declared by President Suharto in his Independence Day speech on 16 August 1967 (Hull et al., 1977: 6; NFPCB, 1982: 6; Dwipayana and Ramadhan, 1988: 225).
birth control in collaboration with the PKBI. The growing government commitment to population control became more evident with the transformation in 1970 of LKBN into BKKBN (National Family Planning Co-ordinating Board), a non-departmental governmental institution directly responsible to the President, which has taken the lead in co-ordinating family planning over the past two decades.
BKKBN1 s main function is co-ordinating the implementation of the national family planning program: it mobilizes the available manpower from other institutions, such as medical and paramedical personnel, clinic facilities and equipment from the Department of Health and Armed Forces Implementing units, and information officials and information mobile units from the Department of Information (NFPCB, 1982: 5-10). BKKBN1 s goal, set in 1974, was to reduce the national 1971 national fertility level by 50 per cent before the end of the century; this target was later advanced to the end of the year 1990.
Being a co-ordinator, BKKBN’s function is to bring together various government departments, such as the Department of Education and Culture and the Department of Religious Affairs, and social organizations, such as PKBI, the Moslem Associations (.Muhammadiyah and Nahdlatul Ulama), and the Indonesian Council of Churches (.DGI), in the effort to recruit the people to adopt birth control. Its administrators are obliged to be flexible in maintaining the continued interest and participation of those groups. The effective delegation of authority for program management to provincial staff, administrators, religious and other local leaders has resulted in the active participation of local authorities and informal leaders (Heiby et al., 1979: 7; Snodgrass,
1979: 11)).
staff members could provide house-to-house motivation. To avoid plateaux in the number of new acceptors, and to reach a mass audience in the effort to reduce dramatically the national fertility level, the program had to be extended to the villages, which themselves had to assume responsibility for distribution. Accordingly in late 1974 BKKBN established the Village Contraceptive Distribution Centres (VCDC) program; a centre can be an office or a home (Hull et al., 1977: 7-12; Suyono,1979: 59- 62).
Further development of the program led to active participation of community members through formation of groups or voluntary organization of family planning acceptors. The family planning group is the basic unit of organization in the program. In some villages the group includes both family planning acceptors and non-acceptors, in other villages it is limited to acceptors only. The existence of a family planning group does not reduce or limit the role of family planning clinics, which become even more important, becoming central resupply points at the district level (Suyono, 1979: 59-62; Soeradji et al., 1987: 133-134).
The government’s commitment to fertility reduction and the population program is reflected in its integration in the program of national development. In the First and Second Five Year Development Plans (Repelita I and //)! only the family planning program was included, but from the Third Five Year Development, a population program, which was aimed at issues beyond family planning, was also covered (Soeradji et al., 1987: 133). This inclusion of birth control as an integral part of the national development strategy reflects a set of dynamic conditions which is a result of a particular interaction between internal socio-political developments and worldwide
forces. The specific form and content of the political commitment are purely Indonesian (Heiby et al., 1979: 3).
The geographical coverage of the program implementation has also expanded in stages. As was outlined in Repelita /, the program was initiated in Java and Bali, the most densely populated islands. It was also recommended in Repelita I that in the first years of the program, implementation should focus on urban areas, because the cities had most of the existing health facilities. In practice, however, rural outreach started at the very beginning of the program. In 1974, the beginning of the Second Five-Year Development Plan, the program expanded beyond Java and Bali to ten large provinces in the other islands. The concept of integration with other development efforts was set out in Repelita II. The program then included population education, nutrition and health improvement. The remaining 11 provinces outside Java and Bah were covered in 1979, at the beginning of the Third Five-Year Development Plan. In Repelita III, the integration efforts introduced in the Second Plan were strengthened.
In the fiscal year 1970/1971, the Indonesian government gave the equivalent of US$1.3 million to the national family planning program which was matched by over US$3 million from foreign donors. This commitment has increased in successive years. In 1984, it was estimated that the relative shares were equivalent to about US$25 million from foreign donors and US$65 million from the Indonesian government (Hugo et al.,
1987: 141-142).
increase in the percentage of women recruited as new acceptors was also experienced by the other areas outside Java and Bali (Figure 1.1). The surveys also found that the percentage of current users of modem methods increased from 9.4 per cent in 1973, when the program was limited to Java and Bali, to 44.0 per cent in 1987 for Indonesia as a whole (Sinquefield and Sungkono, 1979: 51; Central Bureau of Statistics, 1989: 34).
Figure 1.1: Percentage of married women who were annually recorded as new clients, Indonesia, 1971-1984
Indonesia Java-Bali Outer Islands! --- • — Outer IslandsII
Source: IPDP, draft paper. Data drawn from Buku Statistik Pelita I (the First Development Plan Statistical Book), and the March Statistical Summaries.
[image:22.567.55.492.331.648.2]those with higher parities, which implied that the main use of contraception was to limit childbearing (Hull, Hull, and Singarimbun, 1977: 22-23; Bukit, 1982: 87-92; Guritnaningsih, 1982: 181-189; Joelimar, 1982: 302-310; Wilopo, 1982: 410-420; Hugo et al., 1987: 148). As the program grows older, the idea of contraceptive use becomes socialized and institutionalized, and the need for contraception for birth spacing is more realized by young couples, so that more young people practise birth control. The decrease in the median age and number of living children of new acceptors over time has been shown by some studies (Suyono et al., 1976: 10-17; Moeljodihardjo and Parsons, 1977: 12-15; Hull, Hull and Singarimbun, 1977: 22-23; Purwanto and Ritonga, 1982: 6; Hugo et al., 1987: 148).
At the beginning of Repelita //, the government announced that the program target was a 50 per cent reduction of the 1971 fertility level to be achieved by the year 2000. The target date was then revised to 1990, because of their recruiting experience of a fast growth of new clients from 1970 to 1975. Seventeen years after the program was launched, the total fertility rate (TFR) in Indonesia had declined from 5.6 in the years 1967-1970 to 3.2 in 1987 (Hull and Dasvarma, 1987). The fact of fertility decline in Indonesia, and especially in Java and Sumatra, has been widely accepted by scholars (Hull, Hull and Singarimbun, 1977; Jones, 1977; Sinquefield and Sungkono, 1979; Hull and Mantra, 1981; McNicoll and Singarimbun, 1983; Mamas, 1983; Hugo et al., 1987; Hull and Dasvarma, 1987). The decline varies between provinces and within each province. In West Java, for example, the greatest decline between the period 1967-1970 and 1975-1979 was 26 per cent, recorded by kabupaten (district) Tasikmalaya (Table 1.1). However, although starting from a similar level of fertility, two other kabupaten in this province, Tangerang and Serang, experienced a fertility increase instead. The differentials in fertility and in fertility decline between kabupaten within each province, as well as in family planning performance (Table 1.2), have led to some questions which the present study tries to answer.
1.2 Study objectives
On the basis of the facts presented in the previous section, the present thesis research is aimed at the following objectives:
(i) To evaluate the efficiency of the family planning program implementation in Java, by considering program and non-program factors.
(iii) To examine the reasons for apparent contradictions between fertility levels and contraceptive use in some selected kabupaten.
To meet the three objectives, two different approaches are applied. For the first and second aims, the analysis uses the conventional demographic approach which employs quantitative information on large populations. The second approach is a micro approach, a type of study which remains close to traditional demographic data and population level measures but uses supplementary directly collected information to enrich the interpretation of the conventional demographic results. One justification for the micro-approach is that it provides qualitatively different information than can normally be expected from survey or census data (Hull, Hull and Singarimbun, 1988: 58).
By using the 1980 Indonesian Population Census as one of the sources of data and an aggregate level of kabupaten as units of analysis for the quantitative approach, the analysis refers to the late 1970s. However, although the micro approach data collection was carried out by the author in 1987, the analysis of these data in the last two chapters refers to the kabupaten experience from 1970 to 1987.
1.3 Analytical framework
Table 1.1a: Estimated fertility rates for kabupaten in West Java based on the 1971 and 1980 Indonesian Population Censuses
K abupaten Estim ated Total Fertility Rate
1967-1970* 1975-1980**
Percentage
Difference
O l.Pandeglang 6.22 6.07 -2.4
02.L ebak 7.07 6.51 -7.9
03.B ogor 6.71 6.34 -5.5
04.Sukabum i 6.27 5.13 -18.2
05.C ianjur 6.19 5.29 -14.5
06.B andung 6.21 5.66 -8.9
07.G arut 6.19 5.68 -8.3
08.T asikm alaya 6.08 4.50 -26.0
09.C iam is 4.77 3.58 -24.9
lO .Kuningan 6.17 5.17 -16.2
11 .Cirebon 6.24 5.80 -7.1
12.M ajalengka 4.83 4.50 -6.8
13.Sum edang 4.88 3.86 -20.9
14.1ndramayu 5.45 4.99 -8.4
15.Subang 5.06 4.09 -19.2
16-Purwakarta 5.45 5.20 -4.6
17.Kerawang 5.44 4.96 -8.8
18.Bekasi 6.19 5.86 -5.3
19.Tangerang 6.14 6.16 +0.3
20.Serang 5.77 5.80 +0.5
Source:* Biro Pus at Statistik, 1976: 7-8 * * United Nations, 1987:42-43
Table 1.1b: Estimated fertility rates for kabupaten in Yogyakarta based on the 1971 and 1980 Indonesian Population Censuses
K abupaten E stim ated Total Fertility Rate Percentage
1967-1970* 1975-1980** D ifference
O l.K ulon Progo 4.70 3.28 -30.21
02. Ban tul 4.56 3.39 -25.66
03.G unung K idul 5.15 3.50 -32.04
04.Slem an 4.76 3.32 -30.25
Table 1.1c: Estimated fertility rates for kabupaten in Central Java based on the 1971 and 1980 Indonesian Population Censuses
K abupaten Estim ated Total Fertility Rate
1967-1970* 1975-1980 **
Percentage
D ifference (%)
01. Cilacap 5.61 4.47 -20.4
02. Ban yum as 5.63 4.44 -21.1
03.Purbalingga 4.86 4.35 -10.5
04.B anjam egara 4.65 4.25 -8.6
05.K ebum en 6.19 4.45 -28.1
06.Purw orejo 5.67 3.77 -33.5
07.W onosobo 5.57 4.31 -22.6
08.M agelang 5.06 3.66 -27.7
09.B oyolali 5.25 3.83 -27.0
lO.Klaten 5.16 3.52 -31.8
ll.S u k o h a ijo 5.30 4.10 -22.6
12.W onogiri 5.22 3.40 -34.9
13.Karang A nyar 5.00 4.02 -19.0
14.Sragen 5.49 4.02 -24.2
15.Grobogan 5.78 4.16 -30.8
lö .B lo ra 5.05 4.00 -20.4
17.Rembang 4.78 3.63 -16.3
18.Pati 5.06 3.63 -28.3
19. K udus 5.03 3.76 -25.2
20.Jepara 5.35 4.39 -17.9
21.D em ak 5.78 4.38 -24.2
22.Sem arang 5.12 3.83 -25.2
23.T em angung 5.90 3.66 -38.0
24. Kendal 5.42 4.00 -26.2
25.Batang 4.61 3.92 -15.0
26.Pekalongan 5.12 4.29 -16.2
27.Pem alang 5.27 4.53 -14.0
28.Tegal 5.54 5.14 -7.2
29.Brebes 5.56 4.50 -19.1
Table l.ld : Estimated fertility rates for kabupaten in East Java based on the 1971 and 1980 Indonesian Population Censuses
Kabupaten Estim ated Total Fertility Rate
1967 - 70* 1975 - 80 **
Percentage
Difference
Ol.Pacitan 4.48 2.88 -35.7
02.Ponorogo 4.71 3.25 -31.0
03.Trenggalek 5.21 3.39 -34.9
04.Tulung Agung 4.88 3.45 -29.3
05.Blitar 4.85 3.34 -31.1
06.Kediri 4.63 3.71 -19.9
07. M alang 4.63 3.59 -22.5
08.Lumajang 4.12 3.11 -24.5
09.Jem ber 4.50 3.15 -30.0
lO.Banyuwangi 4.79 3.46 -27.8
ll.B o n d o w o so 4.19 2.94 -29.8
12.Situbondo 3.00 2.80 -6.7
13.Probolinggo 4.83 3.42 -29.2
14.Pasuruan 4.57 3.58 -21.7
15.Sidoarjo 5.44 3.57 -34.4
lö.M ojokerto 5.24 3.43 -34.5
17.Jombang 5.05 3.74 -25.9
18.Nganjuk 5.09 3.87 -24.0
19.Madiun 4.56 3.36 -26.3
20.M agetan 4.19 3.55 -15.3
21.Ngawi 4.74 3.44 -27.4
22.Bojonegoro 4.63 3.64 -21.4
23.Tuban 5.02 3.65 -27.3
24.Lam ongan 4.93 3.30 -33.1
25.Gresik 4.82 3.83 -20.5
26.Bangkalan 4.88 3.80 -22.1
27.Sampang 5.35 4.46 -16.6
28.Pamekasan 5.00 4.11 -17.8
29.Sum enep 4.30 3.13 -27.2
Table 1.2a: Estimated proportion of married women of reproductive age using contraception by kabupaten in West Java, 1979
K abupaten Proportion using contraception
01 Pandeglang 20.25
02 L ebak 16.06
03 B ogor 18.91
04 Sukabum i 22.57
05 C ianjur 31.74
06 B andung 25.83
07 G arut 12.38
08 T asik M alaya 24.14
09 C iam is 28.83
10 K uningan 13.33
11 C ire bon 20.98
12 M ajalengka 31.35
13 Sum edang 37.67
14 Indram ayu 26.24
15 Subang 36.61
16 P urw akarta 50.60
17 K eraw ang 21.94
18 B ekasi 30.26
19 T angerang 14.09
20 Serang 14.28
Source: BKKBN, Monthly Service Statistic Reports, 1978/1979 and 1979/1980
Table 1.2b: Estimated proportion of married women of reproductive age using contraception by kabupaten in Yogyakarta, 1979
K abupaten Proportion using contraception
01 K u lo n P ro g o 19.15
02 B antul 20.84
03 G u n u n g K id u l 35.15
04 Slem an 20.60
Table 1.2c: Estimated proportion of married women of reproductive age using contraception by kabupaten in Central Java, 1979
K abupaten Proportion using contraception
01 C ilacap 26.40
02 Banyum as 36.28
03 Purbalingga 36.80
04 B anjam egara 51.90
05 Kebumen 27.96
06 Purw orejo 20.65
07 W onosobo 36.32
08 M agelang 31.11
09 Boyolali 34.72
10 Klaten 32.86
11 Sukoharjo 49.11
12 W onogiri 28.93
13 Karan g Anyar 56.25
14 Sragen 32.54
15 Grobogan 33.67
16 Blora 22.19
17 Rem bang 31.93
18 Pati 33.07
19 Kudus 36.02
20 Jepara 41.19
21 D emak 41.30
22 Sem arang 47.75
23 Tem anggung 46.08
24 Kendal 51.39
25 Batang 39.47
26 Pekalongan 38.51
27 Pem alang 57.06
28 Tegal 39.03
29 Brebes 46.46
Table 1.2d: Estimated proportion of married women of reproductive age using contraception by kabupaten in East Java, 1979
K abupaten Proportion using contraception
01 Pacitan 37.68
02 Ponorogo 39.85
03 Trenggalek 54.19
04 Tulung Agung 51.42
05 Blitar 46.05
06 Kediri 47.59
07 M alang 41.24
08 Lum ajang 41.70
09 Jem ber 35.25
10 Banyuwangi 47.21
11 Bondowoso 31.96
12 Situbondo 70.76
13 Probolinggo 62.10
14 Pasuruan 50.54
15 Sidoarjo 79.11
16 M ojokerto 99.99
17 Jom bang 57.87
18 N ganjuk 70.33
19 M adiun 53.30
20 M agetan 48.73
21 Ngawi 47.90
22 Bojonegoro 42.94
23 Tuban 49.73
24 Lam ongan 42.34
25 Gresik 72.24
26 Bangkalan 50.98
27 Sam pan 62.78
28 Pam ekasan 68.14
29 Sumenep 60.03
Thus in the case where contraceptive devices are mostly supplied by the government, as in Indonesia, program input is another factor which affects birth control adoption. In the absence of a well developed theory of the determinants of aggregate fertility, the present study, in common with other such analyses, adopts a general framework that views fertility as a function of other demographic and ecological characteristics, the level of development or modernization and inputs from the program (Hermalin, 1979: 101). Determinants in the study are classified into:
(i) Demographic and ecological factors including: average number of living children ever borne and still living, infant mortality rate, life expectancy at birth, population density, dependency ratio, proportion arable land, proportion of urban residents, proportion of irrigated paddy field, proportion of landless farmers, proportion of high standard living households, proportion of households with non-nuclear family, and proportion of women aged 15-49 years.
(ii) Socio-economic and related factors including: female labour force participation rate, proportion of women 15-49 years non-family workers, proportion of women 15-49 years as employee, female employment rate, percentage of females illiterate, proportion of population speak Indonesian, proportion of women 15-49 years finished primary school, proportion of population 7-12 years attending school, percentage of women 15- 49 years in traditional job, number of primary schools per 10,000 population aged 7-12 years, and number of secondary schools per 10,000 women 15-24 years.
(iii) Family planning program input factors including: number of family planning clinics per 10,000 married women aged 15-44 years, number of family planning doctors per 10,000 married women aged 15-44 years, number of family planning midwives per
A full discussion of these variables will be contained in Chapter 4. In this introduction chapter a number of important variables are introduced.
(i) Demographic and ecological variables:
Infant mortality rate
Theoretically, the effect of infant and child mortality on fertility, which is also known as the ‘child survival hypothesis’, may operate at the community (macro) or individual (micro) level (Heer, 1975). On the community level, experience of high infant or child mortality will define the norms and behaviour of the community toward a larger family size: the insurance effect. Behavioural response by individual couples to infant as well as child mortality may concern the substitution for a child who has died: the substitution effect. Some empirical studies show that women who had experience of child loss had a higher number of desired additional children than those whose children survived (Pebley et al., 1979; Rizk et al., 1980). The additional number of children desired, however, depended on the sex of the dead child (Heer and Wu, 1978). Biologically, the death of a breastfed child will decrease the length of postpartum amenorrhoea, so it will increase the probability of being pregnant again. A mother may stop breastfeeding because the child is ill, that is, before its death. One of the findings in the studies on the relationship between infant and child mortality and fertility is that the length of postpartum amenorrhoea is positively associated with the duration of breastfeeding, hence the birth interval is shortened after a neonatal death (Wyon and Gordon, 1971; Chowdury et al., 1976). However, this effect would only be significant when the death happened to the last child (Chowdury et al., 1976).
and fertility and family planning practice may be tested: that high infant mortality will lead to high fertility through the above mentioned effects and hence will reduce the number of contraceptive users.
Rural and urban residence
A theory that has been suggested to explain the observed discrepancies in rural and urban fertility (without controlling for any socio-economic variables), is that this difference results from different compositional characteristics of the people in those areas, such as education, occupation, work status and income. Women in urban areas are likely to have higher educational levels and more chance to work in the modem sector, which will lead to lower fertility ( United Nations, 1987: 188). Another hypothesis for the urban-rural fertility differential, the subcultural hypothesis, is that the higher fertility of rural women than urban women may be due (at least partly) to rural residence per se which is associated with a wide range of norms and beliefs that tend to favour large families (Johnson, Stokes and Warland, 1978: 674). Another theory behind fertility diversity between women in urban and rural areas is that many social trends may begin in urban areas, and later spread more widely (Singh and Casterline, 1985).
rural women (Hatmadji and Soeradji, 1979; Chemichovsky and Meesook, 1980). Nevertheless, studies on fertility differentials in Indonesia using recent data have found different patterns of association between place of residence and fertility in different provinces (Molo, 1984; Rochim, 1984; Sudirdjo, 1984)
On the basis of the argument that the real costs of rearing children and the opportunity costs of bearing and rearing children in towns and cities are higher than in rural areas so that urban parents are motivated to desire smaller families, and also with more accessibility to the family planning service, the level of contraceptive use in urban areas is expected to be higher than in rural areas. Empirical studies among 19 WFS countries showed that all of these countries, except Indonesia and Finland which have the same percentages of current users for rural and urban areas, support the above expectation (Lightboume, 1980). However, this study showed that rurality is not an absolute obstacle to widespread adoption of family planning. Furthermore, using 1976 WFS data for Indonesia and applying multivariate analysis Soeradji and Hatmadji (1981: 80) have shown a higher percentage of women using modem contraceptives in rural than in urban areas. However, data from the 1987 National Indonesia Contraceptive Prevalence Survey shows that women residing in urban areas have higher contraceptive prevalence than those in rural areas.
(ii) Socio-economic and cultural variables:
Level of education
changed towards lower family size level, and the style of rearing may be changed towards one relatively more costly to the parents in time and money (Cochrane, 1979; United Nations, 1981; Pullum, 1983). The higher cost in the achievement of higher quality children may lead to the acceptability of fertility control. Although it is a minor effect, a higher educational level of women may increase their earning power, which ceteris paribus may result in higher fertility preferences, since they can afford to pay others to care for their children (Cochrane, 1979).
Educational levels of women in a community and contraceptive practice may be interrelated through several mechanisms. Education speeds up the diffusion of family planning; education increases husband-and-wife communication; education increases people’s wish to control their destinies, including the control of fertility behaviour; education increases earning power and hence the ability to obtain preferred contraceptive devices (United Nations, 1979). An empirical study of WFS countries confirmed the findings of preceding studies of the positive relationship between number of years of schooling and prevalence of contraceptive use, except in Fiji where the level of use did not vary with the length of schooling (Sathar and Chidambaram, 1984: 17).
Education, furthermore, may also have some effect on the number of surviving children. First, it may delay age at first marriage, which may imply a delay in the initiation of sexual activity. Second, it may lower the prevalence of sexual abstinence after giving birth and breastfeeding, and hence lead to increased fertility. Third, it may reduce child and adult mortality. Fourth, it may increase fecundability and lengthen the reproductive period because of better nutrition (Gray, 1983; Bongaarts and Potter, 1983; Hobcraft et al., 1985; Singh et al., 1985).
data in the ES CAP countries show that the inverse relationship between education and fertility does not always exist. For example, in Sri Lanka fertility of women with no schooling was slightly lower than that of women with seven or more years of education, and educated women in Indonesia had considerably higher fertility than that of women without education (Alam and Casterline, 1984: 41-43). Studies on Indonesian fertility differentials using the 1973 Indonesian Fertility and Mortality Survey have also indicated a positive relationship between fertility and such a social status measure as wife’s education within the range of a low educational society (Hull and Hull, 1977; Supraptilah and Soeradji, 1979). For the positive relation between socio-economic status and fertility, Hull (1976: 17) wrote that the reasons are complex, and include both voluntary and involuntary restrictions on the fertility of the lower class.
Other studies using the 1980 Indonesian Population Census data found curvilinear relationships between educational attainment and mean children ever borne (Hatmadji and Achmad, 1983; Rochim, 1984; Sudirdjo, 1984). In the case of a non-negative relationship between fertility and educational attainment, Singh and Casterline (1985) explain that in the short run women with more education may have higher fertility because contraceptive use does not compensate for the loss of traditional restraints; whereas in the long run, as countries pass the transitional period, the negative relationship will probably become dominant. Studies using 1976 Indonesian WFS data as well as the 1987 National Indonesia Prevalence Survey Report confirmed the expectation that the more education women have the higher the contraceptive prevalence rate (Freedman, Kho and Supraptilah, 1981; Soeradji and Hatmadji, 1981; Central Bureau of Statistics, 1989).
Safilios-Rothchild (1985: 6) gave a possible explanation of the curvilinear relationship between women’s level of education and fertility:
fact that literacy is not necessarily accompanied with greater access to income... under these conditions literate women continue having many children or may become motivated to have more children than illiterate women. Elementary school graduation, on the other hand, is usually accompanied with women’s greater access to income which makes women more valuable and increases parents’ propensity to make investments in girls’ education rather than to use their labour.
Thus, the relationship between education and fertility is indeed complex and it tends to
vary by region, with the relative level o f socio-economic developm ent and over time
(United Nations, 1987)
W om en’s employment
The simplest hypothesis about the relationship between w om en’s work and fertility is
an inverse relationship, based on perspectives which predict the relationship between
w om en’s em ployment and fertility: first, the role incom patibility and second,
opportunity cost o f children. The first hypothesis emphasizes the different roles that
women play in daily life, in this case as m other and worker. If economic and social life
are structured in ways that make it difficult for women to combine child rearing and
employment, and women feel that one of these roles hinders the other one, the
relationship o f the two will be negative. The second hypothesis, opportunity cost of
children, which is based on micro-economic theories o f household decision-m aking, is
the value or cost o f time allocated to bearing and rearing children (United Nations,
1987: 256).
Some early studies, analysing United States data, found that w om en’s employment was
a powerful way to reduce fertility, also, that the presence o f young children decreased
female participation in the labour force (Collver and Langlois, 1962; Cain, 1966; Sweet,
1973). Other studies, however, found that women working as family workers had no
difficulties in combining working with childbearing (Kasarda, 1971; Goldstein, 1972).
On the other hand, those who are working outside the house may find it difficult to
combine their role of bearing and rearing children with their work for a certain period of
fertility can be positive or negative, depending on the geographic and institutional environment.
A comparative study using data from 20 World Fertility Survey countries, by using three categories of women’s employment status (no work, family or self-employed, other non-family employee), found that in some countries the negative relationship between fertility and any type of work was confirmed, whereas in several other countries, the largest differences in fertility were between non-family workers and all others. In general, however, fertility of women engaged in non-family work was lower than among other groups (Rodriguez and Cleland, 1980). Safilios-Rothschild (1985) found that the more women work as unpaid family workers in a country, the lower the contraceptive use and the higher their level of fertility.
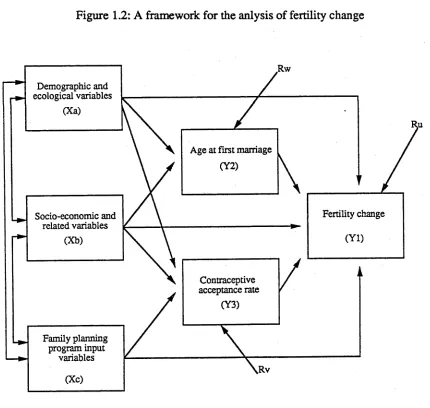
The above discussion results in a conceptual model that fertility is a function of demographic and ecological, and socio-economic conditions, that these will operate through intermediate or proximate variables such as those described by Davis and Blake (1956), Freedman (1975), and Bongaarts and Potter (1983). In the case of Indonesia, where contraceptive devices are mostly supplied by the government, family planning program inputs, which are discussed in Chapter 4, is another determinant factor. An example of this approach, using individual level data, is that by Hull (1978), Hatmadji et al. (1982), Hatmadji and Achmad (1984), and Adioetomo et al. (1989). In this thesis areal data are used and an analytical framework proposed by Hermalin (1979: 102) is adopted. This framework is illustrated in Figure 1.2.
Figure 1.2: A framework for the anlysis of fertility change
Fertility change Age at First marriage
(Y2)
Socio-economic and related variables Demographic and ecological variables
(Xa)
Family planning program input
variables
Contraceptive acceptance rate
(Y3)
Source: Hermalin, 1979:102
[image:40.567.70.500.327.735.2]1.4 Thesis structure
This thesis is divided into eight chapters. Chapter 2, sources and methods, describes the sources of data, both quantitative and qualitative, used in the present study. The second part of this chapter discusses the units of analysis, and the last part shows the methods of analysis applied in the thesis.
The chapter on the areal setting of Java, Chapter 3, describes the population growth of Java since the beginning of the twentieth century, its fertility, age at first marriage and mortality trends and regional differentials, as well as family planning program achievements in Java as a whole and in each province.
Using kabupaten as units of analysis and multiple regression as technique of analysis, Chapter 4 analyses determinants of family planning program performance in Java. To evaluate the efficiency of family planning program performance by taking into account demographic and socio-economic factors, predicted prevalence rate is calculated.
Chapter 5 analyses the effect of the family planning program in Java on fertility change, by using areal multivariate analysis. The direct effect of each predictor on the fertility change, the path coefficient, is calculated, by drawing some regression equations.
The experiences of four other observed kabupaten, Serang, Purwakarta, Gunung Kidul and Probolinggo, in family planning program implementation are described in Chapter 7. Particular factors in each region, such as the strong influence of religious leaders in kabupaten Serang, and the strong beliefs of people in kabupaten Gunung Kidul in postpartum abstinence contributed to the diversity in adoption of family planning and fertility change in those regions.
Chapter 2
Data Sources and Methods
As stated in Chapter 1 the present study applies two different approaches, the quantitative approach which employs information from large populations and the qualitative approach which remains close to traditional demographic data but uses additional information to enrich the interpretation of the numerical demographic results. This second approach focuses on values, attitudes and expectations at the level of individuals, and households, and social processes which result in the population level effect. Applying these two kinds of analysis, this study requires both quantitative and qualitative sources of data.
2.1 Sources of quantitative data.
This present study uses information collected through population censuses, surveys and service statistics, to provide numerical information. The population census used in this study is the 1980 Indonesian Population Census, which is the third census taken since Indonesian independence; the first and the second ones were taken in 1961 and 1971. As with the 1971 Census, the enumeration method of the 1980 Population Census was two-stage enumeration. First, a complete enumeration of all people residing in the Indonesian geographical area was made between 20 September and 31 October 1980. The second stage was enumeration of a sample of the population living in selected census blocks; this was done from 6 to 31 October 1980 (Biro Pusat Statistik, 1982a: xxviii-xxix).
information, such as education, labour force and economic activity, age at marriage, number of children, family planning and housing condition. Beside the 1980 Census, the present study also used some information on infrastructure conditions and facilities at the village level (potensi desa), such as number of school buildings and teachers, which were also assembled by the Central Bureau of Statistics in conjunction with the
1980 census.
The adoption of the family planning program in Indonesia, especially in the first decade, was very much influenced by the accessibility of the program to the people. This means that the availability of family planning program inputs, such as family planning clinics and their medical staff, family planning field workers and also contraceptive devices, are very important to the overall implementation. Since one of the aims of this study is to examine the determinants of family planning acceptance in kabupaten in Java, the family planning program input is also employed, so that the BKKBN’s service statistics, which provide such information through their recording and reporting system, are another source of quantitative data. Except for information on the contraceptive prevalence rate, data comparable to the family planning service statistics were not available in the census.
persons in the household to answer for married women, it is likely that the information on current users from the census may have been underreported.
Information on family planning from the 1980 Census was collected through questions on family planning ever used and currently used. For the first question, about contraceptive ever used, five precoded choices were available: l.Pill, 2.IUD, 4.Condom, O.Other, and 8.Never usedl. According to the instruction manual for sample interviewers (Buku Pedoman Pencacah Samp el), the interview was terminated without asking the next question, which is on current use, if the answer on ever use was ‘0, other’ or ‘8, never used’. This led to two possibilities: first, some women whose answers were coded ‘O’, who had used other methods (including traditional methods) but were currently using pill, IUD or condom, would not be included as modem methods current users. Second, women speaking in Javanese, might interpret the word ‘ever used’ as ‘once used’* 2, and would thus answer ‘never’, although they were currently using either pill, IUD or condom. These women would not be included as current users, since the question on current use was not put to them (Streatfield, 1985: 344).
The probability of an overestimate of the prevalence rate from the service statistics is first attributed to some possible reporting errors, such as repeat acceptors registered as new acceptors, underenumeration of contraceptive contribution through private sector, and the procedure of adjusting the number of current users for late reports. A second cause of error may lie in the appropriateness of the assumption used by BKKBN in estimating prevalence rates for each method (Streatfield, 1984: 21-22; 1985: 343; Soeradji et al., 1987: 275-276)
^ Since the respondent is allowed to mention more than one methods, code numbers 3,5, and 7 are provided for this possibility.
2 The census questionnaire is in the Indonesian language, and the Indonesian for'ever used’ is ‘ pernah dilakukan' ,
Beside these sources of data, which provide information for deriving variables used in the multivariate analysis, other sources of data, either from published material by the Central Bureau of Statistics or from articles, are also employed. These sources are the 1971 Indonesian Population Census, the 1973 Fertility and Mortality Survey, the 1976 Indonesian Fertility Survey, the 1979 National Socio-Economic Survey, the 1985 Intercensal Population Survey, and the 1987 National Indonesian Contraceptive Prevalence Survey. A list of quantitative sources of data and the chapters where these sources are employed is found in Table 2.1.
Table 2.1: Sources of quantitative data and the chapters employing them.
C en su s/ survey Sam ple coverage Chapter
1971 IPCa N ational (3.5 per cent) 3,4,5 1973 FM Survey13 Java (excluding Jakarta), Sumatra,
Su law esi, and Bali
3,7
1 9 7 6 IFSC Java and B ali 3,7
1979 N S E S d N ational 3
1980 IPCa N ational (5 per cent) 1 3 ,4 ,5 ,6 ,7
1 9 8 5 IPSe N ational 3
1987 N IC P Sf N ational 3
B K K B N Service Statistics R egional 1 3 ,4 ,5 Sources:
Biro Pusat Statistik, 1981, 1982a, 1982b, 1983, 1986, 1988; Central Bureau of Statistics, NFPCB and IRD/ Westinghouse, 1989; Cho L. J ., Suharto, S., M cN icoll,, G., and Mamas, S. G. M., 1976; Ross, J. and Poedjastoeti, 1983. Hugo et al., 1987; Hull, T. H. and Hatmadji, S. H., 1988; Martokoesoemo, B. S., 1979; Soeradji, B. and Hatmadji, S. H.,1982. IPDP, n. d.; BKKBN Monthly Service Statistics Report, 1978/79 -1982/83.
Notes:
a Indonesian Population Census; b Fertility and Mortality Survey; c Indonesian Fertility Survey; d National Socio-Economic Survey; e Intercensal Population Survey;
2.2 Source of qualitative data.
To examine discrepancies in family planning acceptance and fertility decline among selected kabupaten in every province, I needed to get some idea of the forces behind the program implementation in selected districts. As was found by Khoo (1982: 19), the way the program is implemented in each region and the involvement of the community’s activities in promoting family planning may be more effective in motivating people to practise modem contraception than the nature of the contraceptive service per se.
To meet this aim, a small survey was made of villages in selected districts. The selection of areas was taken in stages and was non-random, starting with kabupaten selection, based on certain criteria, and followed by selection of two kecamatan (sub districts) in each district. Since the main purpose of the survey was to collect more information on the implementation of the family planning program in each selected area, it was hoped to choose a number of villages in every kecamatan. However, with five selected kabupaten to be observed, scattered from west to east Java, and with limited time available, only five villages in each kecamatan were observed. In every selected village, 12 married women of reproductive age were interviewed, hence there were 120 married women respondents in every kabupaten.
married women at reproductive ages. Thus, the results of interviews with key persons and interviews with the married women are the sources of qualitative data in this study.
In contrast to large sample surveys, questions in a small survey can be modified to suit local conditions and take account of local dialects (Hull, Hull and Singarimbun, 1988: 58). In order to create as informal an atmosphere as possible during the interview, local languages were used where appropriate, since ethnic group is one of the considerations in selecting the regions to be observed. With this procedure, it was expected that respondents, particularly married women, would feel more at ease and free to relate their experiences and express their ideas without any fear. This was done by employing local research assistants who were able to speak regional languages (Sundanese, Javanese or Madurese), and who had a background of demographic knowledge^. Hence, each survey team consisted of three persons. We worked very closely during the entire period, and in the evening we discussed the information collected from the field during the day.
The information gathered from program implementers focused on problems raised during family planning program implementation; how they overcome the problems; responses of other key persons, such as religious leaders, toward the family planning program. Apart from the conventional demographic questions asked of married women, such as age, educational attainment, age at marriage, fertility behaviour and contraceptive use, other open-ended questions were developed in the field, for example on attitude concerning abstinence during the lactation period.
2.3 Units of analysis.
A study by Freedman (1978) on family planning evaluation and fertility in Indonesia,
quoted by Chem ichovsky and M eesook (1981: 24), found that the success o f family
planning program
rests fundamentally on a political commitment to use an established administrative system which is capable of reaching from centre through successively smaller administrative units to the village itself. This involves authority, power and respect relations resting on traditional forms of relationships, but strengthened as the fundamental framework for order and policy implementation by the present government.
O ther later studies on family planning in Indonesia using individuals as units o f analysis
have found that region and demographic factors have been the m ajor determinants of
contraceptive use (Freedman, Khoo and Supraptilah, 1981). Furthermore Freedman et
al. found that province is a more im portant factor than demographic and socio
econom ic background variables in affecting m odem contraceptive use. The extension of
their study, by Khoo (1982), also confirmed the im portant factor o f region in affecting
both program effort and contraceptive use. Freedman et al. wrote:
Why should region affect the use of modem contraceptives? One answer is that regions differ culturally in ways that affect fertility independently of the demographic and social variables considered in this and other studies.... For Indonesia, another possible explanation for the importance of region is that the family planning program was differentially implemented in the different provinces, which are semi autonomous (pp. 14-15).
On the basis o f this argument, two chapters o f the present study employ regions as units
o f analysis. The question is, w hat is the m ost suitable level of aggregation? Considering
that family planning in Indonesia is a governm ent-supported program, and its
implementation is integrated with the developm ent program, it is better to use
administrative territory, nam ely province, district, subdistrict or village, as the unit o f
Figure 2.1: Administrative division in Indonesia
Districts Kabupaten
Kotamadya
Villages Provinces
Sub-districts (Kecamatan)
Kelurahan
INDONESIA
Source: Soeradji, Hatmadji and Ananta, 1987:148. Notes:
1. Kotamadya mostly constitute big cities
[image:50.567.66.514.144.582.2]The form al administrative hierarchy has been well summarized by M cNicoll and
Singarim bun (1983: 34):
At the lowest level in rural areas is the administrative village ( kelurahan, desa--
the latter term confusing because the Javanese word desa means a pedukuhan),
usually comprising a group of hamlets (perhaps 6-8 on average), sometime clustered, in other cases strung out over a wide area. Its head, the lurah, is an elected official, although his term is indefinite, and in some regions the post is virtually hereditary. The higher administrative levels are headed by appointed
officials (camat, bupati, and provincial governor). Roughly paralleling this civil
administration is a military bureaucracy extending downward from the commander of each military district, the counterpart in the larger provinces to the governor.
To select an appropriate aggregate unit, each level has its own relevance to the study
(Table 2.2). The present study covers only the island o f Java, which has only five
provinces, but these are each large, complex regions with populations up to 30 million
people. On the other hand using the subdistrict, which is also a basic administrative unit
o f fam ily planning, as unit of analysis, implies potentially a large number of cases; but
data for the subdistrict level are very limited.
T a b le 2.2: Favourable level o f aggregation by different relevance o f analysis.
R e le v a n c e for F a v ou rab le le v e l C onsideration o f ag g reg a tio n
Program im p lem en ter S ub d istrict, v illa g e B a s ic a c tiv itie s and p rincipal ad m in istration
P o lic y m aker P ro v in c e, d istrict H ead o f p ro v in ce or district is d e v e lo p m e n t adm inistrator; ea ch p ro v in ce or d istrict is a u to n o m o u s w ith its o w n d e v e lo p m e n t p lan n in g and b u d g etin g
S ta tistics S u b -d istrict L a rge n um ber o f p oten tial c a s e s P ro v in c e A v a ila b ility o f w id e range reliab le data.