The utility of HepG2 cells to identify direct mitochondrial dysfunction
in the absence of cell death
Laleh Kamalian
a,1, Amy E. Chadwick
a,1,⇑, Mark Bayliss
a, Neil S. French
a, Mario Monshouwer
b,
Jan Snoeys
b, B. Kevin Park
aa
MRC Centre for Drug Safety Science, The Department of Clinical and Molecular Pharmacology, The University of Liverpool, Ashton Street, Liverpool L69 3GE, UK bPharmacokinetics Dynamics and Metabolism, Janssen Research and Development, Beerse, Belgium
a r t i c l e
i n f o
Article history:
Received 29 October 2014 Accepted 17 February 2015 Available online 5 March 2015
Keywords: Mitochondria
Drug-induced liver injury HepG2
Toxicity Dysfunction
a b s t r a c t
Drug-induced mitochondrial dysfunction has been hypothesized to be an important determining factor in the onset of drug-induced liver injury. It is essential to develop robust screens with which to identify drug-induced mitochondrial toxicity and to dissect its role in hepatotoxicity. In this study we have characterised a mechanistically refined HepG2 model, using a panel of selected hepatotoxicants and non-hepatotoxicants. We have demonstrated that acute metabolic modification, via glucose-deprivation over a 4 h period immediately prior to compound addition, is sufficient to allow the identification of drugs which induce mitochondrial dysfunction, in the absence of cell death over a short exposure (2– 8 h) using a plate-based screen to measure cellular ATP content and cytotoxicity. These effects were verified by measuring changes in cellular respiration, via oxygen consumption and extracellular acidifica-tion rates. Overall, these studies demonstrate the utility of HepG2 cells for the identificaacidifica-tion of mitochon-drial toxins which act directly on the electron transport chain and that the dual assessment of ATP content alongside cytotoxicity provides an enhanced mechanistic understanding of the causes of toxicity.
Ó2015 The Authors. Published by Elsevier Ltd. This is an open access article under the CC BY-NC-ND license (http://creativecommons.org/licenses/by-nc-nd/4.0/).
1. Introduction
Drug-induced liver injury (DILI) is a major clinical problem. Hepatic adverse drug reactions have a global incidence of 13.9 per 100,000 inhabitants/year and over 1000 drugs are known to induce DILI. However, in many cases DILI is not predictable from the primary pharmacology of the drug, is not detected pre-clinically, and in most cases have no defined mechanisms
(Hussaini and Farrington, 2014). Drug-induced mitochondrial
dysfunction has been hypothesized to be a determining link in the onset of such idiosyncratic DILI and 50% of drugs with Black Box Warnings for DILI contain mitochondrial liabilities (Boelsterli and Lim, 2007; Labbe et al., 2008). Due to several high profile drug
withdrawals and clinical trial failures, such as fialuridine and tro-glitazone, in which mitochondrial toxicity has been implicated it is essential to develop robust screens with which to identify the potential for mitochondrial toxicity in new chemical entities and models which can be used to link the onset of mitochondrial dys-function with cell death and ultimately the hepatotoxic response. Mitochondrial toxicity is difficult to modelin vivoas typical in-bred rodent models are young and healthy with a large respiratory capacity (Pereira et al., 2012). Hence, their efficiently functioning mitochondria can tolerate damage and toxicity is not induced. Some progress has been made in producing transgenic mice, such as SOD2(+/-), in which underlying mitochondrial stress is hypothe-sised to enhance sensitivity to mito-hepatotoxins (Ong et al., 2007; Ramachandran et al., 2011). Deficiencies also exist in the models of mitochondrial toxicityin vitro. In most standard preclinical models the tumour-derived cells, such as HepG2 cells, have gained the ability to vary routes of energy production allowing them to utilise glycolysis alongside oxidative phosphorylation (OXPHOS) in order to sustain continued growth in anaerobic conditions. However, this reduces their sensitivity to mitotoxicants. This area was trans-formed by the description of a technique to confer mitochondrial susceptibility to HepG2 cells by culturing the cells in media in
http://dx.doi.org/10.1016/j.tiv.2015.02.011
0887-2333/Ó2015 The Authors. Published by Elsevier Ltd.
This is an open access article under the CC BY-NC-ND license (http://creativecommons.org/licenses/by-nc-nd/4.0/). Abbreviations:ADR, adverse drug reaction; CCCP, carbonyl cyanide
m-chlor-ophenyl hydrazine; DILI, drug-induced liver injury; ETC, electron transport chain; EC50-ATP, drug concentration which decreases cellular ATP level by 50%; EC150-CT, drug concentration which increases cytotoxicity by 150%; ECAR, extracellular acidification rate; FHH, fresh human hepatocytes; Gal, galactose; Glu, glucose; MIP-DILI, mechanism based integrated systems for the prediction of drug-induced liver injury consortia; OCR, oxygen consumption rate.
⇑Corresponding author. Tel.: +44 (151) 7950148; fax: +44 (151) 7945540. E-mail address:[email protected](A.E. Chadwick). 1 These authors contributed equally to this work.
Contents lists available atScienceDirect
Toxicology in Vitro
which galactose had been substituted in the place of glucose, thus blocking ATP generation via glycolysis and forcing the cells to rely upon OXPHOS for the production of ATP (Marroquin et al., 2007). Subsequently this model has been adopted by many pharmaceuti-cal companies in order to screen for mitochondrial toxicity preclinically and several publications have detailed its relevance for the investigation of mitochondrial toxicity in several cell types (Pereira et al., 2012; Swiss et al., 2013; Will and Dykens, 2014). Indeed, a survey commissioned by the MIP-DILI (Mechanism-based Integrated systems for the Prediction of Drug-Induced Liver Injury) consortia revealed that 75% of the eight pharmaceutical companies that responded used the glucose/galactose model to screen for mitochondrial toxicity.
Funded by the European Innovative Medicines Initiative, the MIP-DILI consortia has been formed to develop and evaluate innovative mechanism-based integrated systems for the prediction of DILI with the goal of improving the tools used to test for liver toxicity during drug development. Within this framework we have performed studies to define the experimental utility of the HepG2 model against a panel of selected hepatotoxicants and mitochon-drial poisons (Table 1) using a refined method with increased mechanistic utility. Specifically, we report a method by which the metabolic switch, glucose/galactose media change, takes place over a 4 h period immediately prior to initiation of drug exposure rather than adaptation over several weeks (Fig. 1), based upon work in stem-cell derived hepatocytes and cardiomyocytes (Swiss et al., 2013). In this way it is possible to compare the absolute effects of metabolic modification on drug sensitivity in cells originating from the same source. Furthermore, most previous studies have used long exposure to hepatotoxins with an endpoint measure of cyto-toxicity which does not allow examination of the role of mitochon-drial dysfunction in the absence of cell death. The biological relevance of the screen was confirmed by the measurement of changes in mitochondrial respiration and glycolytic function using a Seahorse analyser. Overall, these studies confirm the utility of HepG2 cells to identify certain mitochondrial toxins, although it also highlights particular cases in which this screen is not appropri-ate. Additionally, these studies provide a clear mechanism, by measuring changes in cellular ATP content in the absence of cell death, with which to evaluate the role of mitochondrial dysfunction in the subsequent induction of cell death. However, our approach has exemplified the limitations of this assay both in terms of its applicability to targets within the mitochondria as well as the translatability of thesein vitroscreens to patients.
2. Materials and methods
2.1. Materials
All Seahorse consumables were purchased from Seahorse Biosciences (North Billerica, MA, USA), Mitochondrial ToxGlo Assay kit and the CellTiter-Glo Assay kit were purchased from Promega (Southampton, UK). Cytotoxicity Detection Kit was pur-chased from Roche Diagnostics Ltd (West Sussex, UK). All forms of Dulbecco’s modified media, Rat tail Collagen I and Phosphate Buffered Saline (PBS) were purchased from Life Technologies (Paisley, UK). HepG2 cells were purchased from European Collection of Cell Cultures (ECACC, Salisbury, UK). All other reagents and chemicals were purchased from Sigma Aldrich (Dorset, UK).
2.2. Cell culture
HepG2 cells were maintained in DMEM high-glucose media (glucose 25 mM) supplemented with fetal bovine serum (10% v/v), L-glutamine (2 mM), sodium pyruvate (1 mM) and
HEPES (1 mM). All cells were incubated under humidified air containing 5% CO2at 37°C. Cells were used up to passage 25.
2.3. Cell plating and metabolic switch
On the morning of the experiment WT HepG2 cells were collected by trypsinisation and then washed three times in either serum free glucose or galactose media (DMEM containing 25 mM glucose or 10 mM galactose, respectively, plus supplements listed above) before finally plating into a 96-well plate (12,000 cells/ 100
l
l/well). HepG2 were then incubated (4 h, 37°C, 5% CO2).Drug stock solutions were made up in DMSO and the final solvent concentration was below 0.5% v/v, with a vehicle control, in each experiment.
2.4. Assessment of mitochondrial toxicity using the Mitochondrial ToxGlo Assay to quantify cellular ATP content alongside cell death
Following drug incubation (2 h) the Mitochondrial ToxGlo Assay was performed according to the manufacturers’ instructions. Briefly, cytotoxicity reagent was prepared by adding bis-AAF-R110 substrate to the assay buffer (5
l
l/1 ml). 20l
l of the cytotoxicity reagent was added to each well containing 100l
l media. The plate was shaken for one minute before incubation (37°C, 30 min). The fluorescent signal indicating dead cell protease activity was measured at 485 nm Ex/520–530 nm Em using a plate reader (Varioskan, Thermo Scientific). The plate then was left to equili-brate (room temperature, 10 min). ATPase reagent (100l
l) was added to each well, the plate was shaken (1 min) before the luminescence signal was measured using a plate reader (Varioskan, Thermo Scientific).2.5. Assessment of cell viability using lactate dehydrogenase (LDH) content of the cells with ATP assay
Cells were plated as for the Mitochondrial ToxGlo Assay. Two plates were prepared, one plate to be used to measure the ATP level the other for LDH dehydrogenase quantification. Following drug incubation (4, 8 h) ATP content was assessed using the Promega Cell-titre glo assay according to the manufacturers’ instructions. Briefly, 30
l
l of ATP reagent was added to each well containing 100l
l of media. The plate was shaken (1 min), then 100l
l of the well content was transferred to a white 96 well plate and the ATPase luminescence was measured using a plate reader (Varioskan, Thermo Scientific). The LDH content of the cells and the supernatant was measured according to the manufacturer’s instruction.2.6. Seahorse assay
WT HepG2 cells were plated on collagen coated (50
l
g/ml in 0.02 M acetic acid), XF 96-well cell culture microplates (25,000 cells/100l
l medium/well) overnight. The culture medium was removed from each well and replaced by 175l
l of unbuffered Seahorse Assay media supplemented by either 25 mM glucose or 10 mM galactose, pre-warmed to 37°C. Cells were incubated in a CO2free incubator at 37°C for 1 h. Prior to the rate measurements,concentrations equal to the EC50-ATPgal concentration determined
by Mitochondrial ToxGlo Assay for each compound. The duration of the assay was 120 min.
2.7. Statistical analysis
Values are expressed as a mean ± standard deviation (S.D.) cal-culated from at least three independent experiments, denoted byn number. Data was analysed using one way ANOVA or pairedT-test when appropriate. All calculations were performed using Stats
Direct statistical software; results were considered to be significant whenP-values were less than 0.05.
3. Results and discussion
3.1. The dual assessment of cellular ATP content and cytotoxicity can identify the early onset of mitochondrial dysfunction before cell death in HepG2 cells
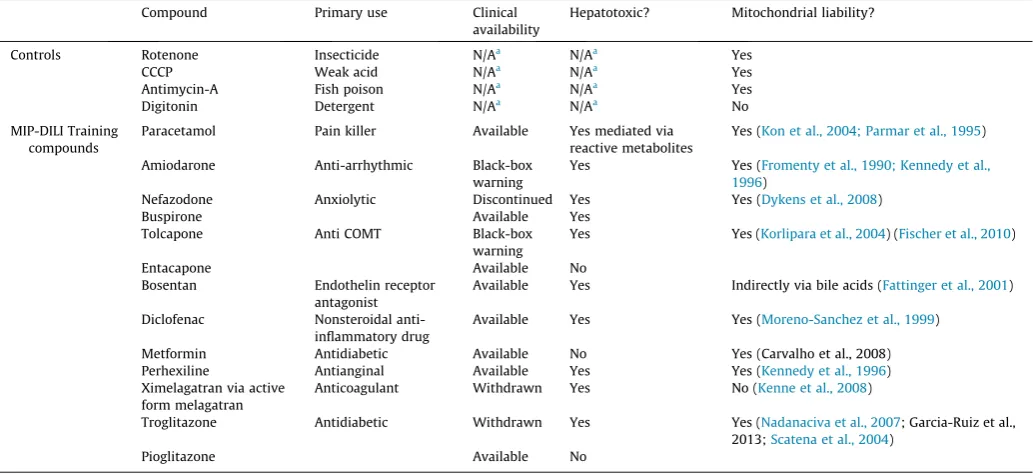
[image:3.595.36.553.87.324.2]The effect of classic mitochondrial toxins with well-defined mitochondrial targets; rotenone, antimycin A and carbonyl cyanide Table 1
A summary of literature review for the mitochondrial liabilities of the compounds used in this manuscript.
Compound Primary use Clinical
availability
Hepatotoxic? Mitochondrial liability?
Controls Rotenone Insecticide N/Aa
N/Aa
Yes
CCCP Weak acid N/Aa N/Aa Yes
Antimycin-A Fish poison N/Aa
N/Aa
Yes
Digitonin Detergent N/Aa
N/Aa
No
MIP-DILI Training compounds
Paracetamol Pain killer Available Yes mediated via
reactive metabolites
Yes (Kon et al., 2004; Parmar et al., 1995)
Amiodarone Anti-arrhythmic Black-box
warning
Yes Yes (Fromenty et al., 1990; Kennedy et al.,
1996)
Nefazodone Anxiolytic Discontinued Yes Yes (Dykens et al., 2008)
Buspirone Available Yes
Tolcapone Anti COMT Black-box
warning
Yes Yes (Korlipara et al., 2004) (Fischer et al., 2010)
Entacapone Available No
Bosentan Endothelin receptor
antagonist
Available Yes Indirectly via bile acids (Fattinger et al., 2001)
Diclofenac Nonsteroidal
anti-inflammatory drug
Available Yes Yes (Moreno-Sanchez et al., 1999)
Metformin Antidiabetic Available No Yes (Carvalho et al., 2008)
Perhexiline Antianginal Available Yes Yes (Kennedy et al., 1996)
Ximelagatran via active form melagatran
Anticoagulant Withdrawn Yes No (Kenne et al., 2008)
Troglitazone Antidiabetic Withdrawn Yes Yes (Nadanaciva et al., 2007; Garcia-Ruiz et al.,
2013;Scatena et al., 2004)
Pioglitazone Available No
a
[image:3.595.106.477.354.576.2]Non-applicable.
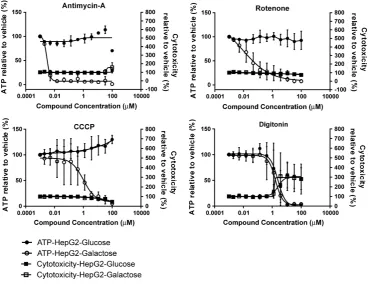
m-chlorophenyl hydrazine (CCCP) (0–100
l
M), on the ATP level and membrane integrity of HepG2 cells was examined alongside digitonin, a non-mitochondria targeted cytotoxic detergent as a negative control. Mitotoxicity was defined by calculating the parameters of EC50-ATP (the concentration which causes a 50% dropin ATP content) and EC150-CT (the concentration which causes a
150% increase in cytotoxicity) in glucose and galactose media from dose–response curves (Fig. 2). In these experiments ATP levels measured in galactose media are correlated with mitochondrial function due to the lack of glycolytic function. After 2 h of exposure, rotenone, CCCP and antimycin A produced an EC50-ATP in cells
cul-tured in glucose-free galactose medium at significantly lower con-centrations compared to those cultured in high glucose medium, when cells remained viable. A compound is defined as mitotoxic if the difference between values for EC50-ATPglu and EC50-ATPgal,
and also the difference between EC50-ATPgal and EC150-CTgal were
statistically significant (One Way ANOVA,pvalues less than 0.05)
(Table 2). In most cases where there was calculated to be a signifi-cant difference, the EC50-ATPglu/EC50-ATPgal ratio and also the
EC150-CTgal/EC50-ATPgal wereP2, which is in line with previous
publications (Swiss et al., 2013). These ratios represent different aspects of mitochondrial toxicity. An EC50-ATPglu/EC50-ATPgal of
P2 indicates that the tested compound contains a mitochondrial liability and thus has a more significant effect in galactose media due to the absence of glycolysis. An EC150-CTgal/EC50-ATPgal of
P2 is indicates that mitochondrial dysfunction precedes cell death.
3.2. The acute HepG2 metabolic model can identify drugs which induce toxicity via mitochondrial dysfunction
3.2.1. Standard two hours exposure to limited concentrations of the compounds
[image:4.595.118.489.253.540.2]The assay was next performed using a panel of compounds, selected by MIP-DILI as training compounds (Table 1). In the
Fig. 2.The effect of rotenone, antimycin A, CCCP and digitonin exposure on ATP levels and cytotoxicity of HepG2 cells (2 h) compared to the vehicle control. Serial concentrations of the compounds were used up to 100lM in glucose or galactose serum free media. The values are expressed as percentage of those of the vehicle control. Key: ATP and cytotoxicity levels are reported as the percentage of the vehicle control ± S.D. (n= 3).
Table 2
Compounds found to be positive for mitotoxicity, alongside control compounds, following 2 h exposure in HepG2 cells.
EC50-ATP (lM) ± S.D. EC150-CTa(lM) ± S.D. EC50ATPglu/EC50ATPgal (pvalueb) EC150CTagal/EC50ATPgal (pvaluec)
Glucose Galactose Glucose Galactose
Control compounds
Rotenone >100 0.05 ± 0.04 >100 >100 >2000 (< 0.0001) >2000 (<0.0001)
Antimycin A >100 0.003 ± 0.001 >100 49 ± 2 >33,300 (<0.0001) 16,400 (0.02)
CCCP >100 0.90 ± 0.80 >100 >100 >110 (<0.0001) >110 (<0.0001)
Digitonin 2.8 ± 1.7 2.1 ± 1.5 2.7 ± 1.5 2.7 ± 2.3 1 (Not significant) 1 (Not significant)
MIP-DILI training compounds
Amiodarone >300 158 ± 30 >300 196 ± 5 >2 (0.001) 1 (0.001)
Nefazodone 39 ± 3 17 ± 5 76 ± 7 142 ± 59 2 (0.047) 8 (0.016)
Troglitazone 81 ± 42 28 ± 8 >300 84 ± 24 3 (Not significant) 3 (0.0073)
Tolcapone >300 53 ± 4 >300 >300 >6 (<0.0001) >6 (<0.0001)
Buspirone >900 338 ± 105 >900 >900 >3 (0.0008) >3 (0.0008)
The results are quoted ± standard deviation (n= 3). Key: a – cytotoxicity;Pvalueb
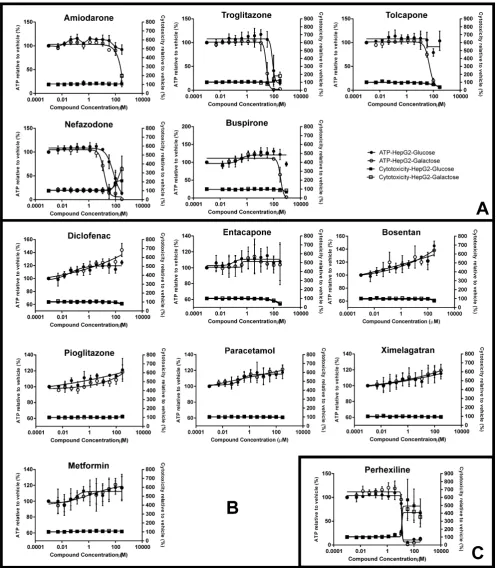
[image:4.595.41.566.606.736.2]standard assay cells were exposed to drugs (0–300
l
M) for 2 h (Fig. 3). Four of the fourteen compounds tested; nefazodone, trogli-tazone, amiodarone and tolcapone could be classified as containing a mitochondrial liability (based upon the EC50-ATPglu vsEC50-ATPgal) and that mitochondrial dysfunction preceded cell
death (based upon the EC50-ATP gal vs EC150-CT gal), as defined
[image:5.595.44.541.135.704.2]above (Fig. 3A andTable 2). Buspirone could also be classified as mitotoxic when an extended concentration range was used
(Fig. 3A and Table 2). These five compounds have all previously been cited as causing mitochondrial dysfunction predominantly via some effect on the electron transport chain (Table 1).
Over 2 h seven compounds; diclofenac, bosentan, paracetamol, metformin, pioglitazone, entacapone and ximelagatran were seen to induce concentration-dependent increases in cellular ATP content in both glucose and galactose medium in the absence of cytotoxicity (Fig. 3B). This increase was most prominent for diclofenac and bosentan (up to 140% of vehicle only). This phenomenon has been reported previously for drugs such as vali-nomycin (Lofrumento et al., 2011). We hypothesise that this increase may form part of a protective mechanism and the activa-tion of cellular defence. For example, cells may either up-regulate ATP synthesis or switch off ATP consuming processes in order to increase and/or maintain ATP for processes such as glutathione synthesis or apoptotic cell death. These compounds were therefore subject to further testing at extended concentrations; 30 mM, 10 mM, 3 mM and 1 mM for paracetamol, metformin and
diclofenac respectively and 2.7 mM for pioglitazone and entaca-pone (2 h). However, this did not lead to the classification of any of these compounds as either positive or negative for mitochon-drial toxicity (data not shown).
[image:6.595.89.518.281.709.2]Surprisingly, the action of perhexiline, a known inhibitor of fatty acid oxidation, closely resembled digitonin and induced cell death in tandem with decreases in ATP levels (Fig. 3C). This finding may result from the action of perhexiline as an inhibitor of fatty acid oxidation via its inhibition of CPT-1, a carnitine transporter (Kennedy et al., 1996). The compound etomoxir has been shown to use this mechanism to induce both a decrease in OXPHOS with-out a substantial increase in glycolysis, alongside a significant cyto-toxic effect due to the generation of reactive oxygen species (Pike et al., 2011). This may explain the findings here of a decrease in ATP occurring in both media alongside the induction of cell death. Therefore, this assay incorrectly defines perhexilline as negative for mitochondrial toxicity, thus exemplifying that this short assay can-not identify all forms of mitochondrial dysfunction.
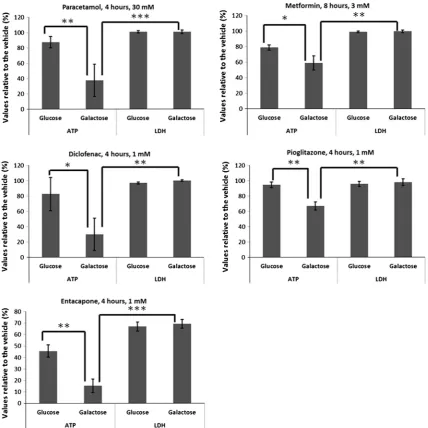
Fig. 4.The effect of the negative MIP-DILI training compounds on ATP and cytotoxicity of HepG2 cells compared to the vehicle control when exposed for extended concentrations and time courses. The graphs show the lowest concentration and shortest time at which cells remained viable (calculated by LDH) in both media, but ATP content of cells was significantly decreased in galactose media compared to glucose media. Key: ATP and cytotoxicity levels are reported as the percentage of the vehicle control ± S.D. (n= 3).⁄
P< 0.05⁄⁄
P< 0.01,⁄⁄⁄
3.2.2. Extended exposure to high concentrations of the compounds Several of the compounds which remained unclassified in the 2 h assay are known inducers of mitochondrial dysfunction (Table 1) and so we investigated whether this discrepancy was due to the acute exposure by using an extended concentration range and time course (4 or 8 h) for the remaining compounds, except for bosentan, as it induces cholestatic injury which would not be evident in unpolarised HepG2 cells (Fattinger et al., 2001). Monitoring baseline cell health revealed that the method of acute glucose starvation could only be reliably used up to 8 h and that LDH is a more sensitive and reproducible cell death marker than the cell death protease included in the Mitochondrial ToxGlo Assay at these extended timepoints (data not shown). In this way we defined the shortest duration, with the lowest concentration of drug, at which a differential effect upon ATP content was observed in the two media in the absence of cell death (Fig. 4). Using this classification system, five of the seven tested com-pounds, paracetamol, metformin, pioglitazone, diclofenac and entacapone, could be classified as weak mitochondrial toxins in accordance with the literature, in which each of these compounds has been described to have a mitochondrial liability via the ETC (Table 1). However, in the case of entacapone and pioglitazone this liability is substantially weaker than their structurally related, more hepatotoxic counterparts, tolcapone and troglitazone and exemplifies the power of this assay in detecting the weakest mitochondrial toxins and to rank compounds in terms of potency of mitotoxicity. This is a clear advantage of this model system. In each case of related compounds studied here, nefazodone and bus-pirone; tolcapone and entacapone and troglitazone and pioglita-zone the striking difference in potency of mitochondrial dysfunction can be correlated with clinical hepatotoxic potential. Specifically, entacapone, pioglitazone and buspirone are clinically useful drugs with low rates of hepatotoxicity, in contrast to their pairs, all of which have been withdrawn, discontinued during
development or have a black-box warning for hepatotoxicity. Moreover, although we have correctly identified the weak mitochondrial liability within metformin it is not classified as a clinical hepatotoxin (Table 1).
Paracetamol was unexpectedly observed to induce mitochon-drial dysfunction after 4 h, but only at a high concentration (30 mM). Although paracetamol is reported to target the mitochondria, toxicity is mediated via CYP P450 mediated reactive metabolites, especially the quinoneimine (Nelson, 1990). As it is known that levels of many CYP enzyme isoforms are low in HepG2 cells (Gerets et al., 2012) we carried out HPLC-MS/MS analysis to measure the concentrations of metabolites produced by the cells (data not shown). This revealed that the key reactive metabolites were present only in very low levels, close to or below the limit of detection. This correlates with iTRAQ analysis of the HepG2 proteome (data not shown, to be published elsewhere) which indicates the overall level of drug metabolising enzymes in HepG2 cells to be less than approximately 1% of those found in fresh human hepatocytes. Therefore, it is unlikely that the toxi-city observed in these studies is related to the usual mechanism of paracetamol toxicity via the formation of reactive metabolites.
[image:7.595.46.543.453.695.2]Ximelagatran was negative as a mitotoxin throughout these experiments which was anticipated (Kenne et al., 2008). However, Ximelagatran is a pro-drug; the active component, melagatran, is formed via two intermediate metabolites (hydroxyl melagatran and ethyl-melagatran) with formation mediated via non-CYP P450 enzyme systems (Clement and Lopian, 2003; Eriksson et al., 2003). Therefore it was considered important to determine whether the active metabolite was produced in the model systems utilised here. HPLC-MS/MS analysis detected insignificant levels of melagatran and the two intermediate metabolites (data not shown) and hence it is not possible to unequivocally rule out mitochondrial toxicity induced by metabo-lism of Ximelagatran using this assay.
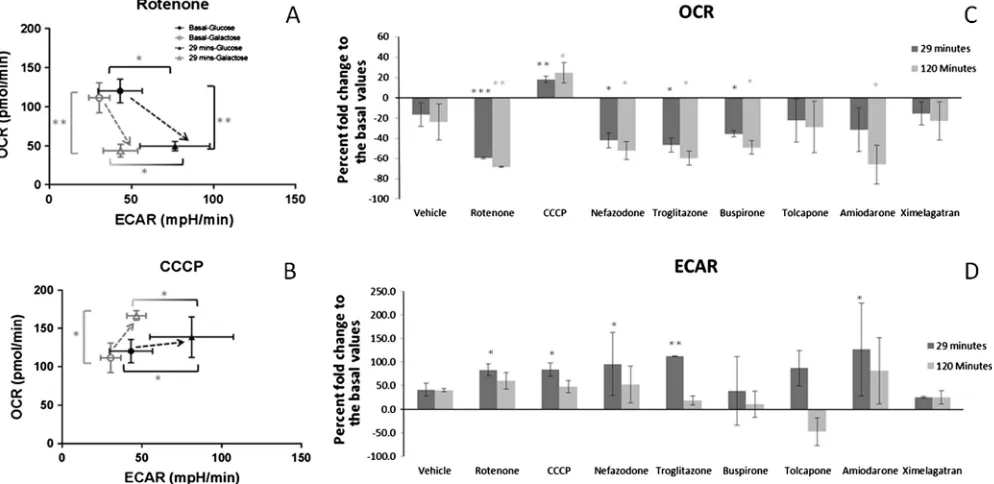
Fig. 5.Oxygen consumption rate (OCR) and extra cellular acidification rate (ECAR) in HepG2 cells in response to drug exposure. (A) and (B) Shift in the bioenergetic profile of HepG2 cells as a result of exposure to rotenone or CCCP at 29 min in glucose and galactose media. (C) and (D) Percent fold change of OCR and ECAR to the basal measurement after 29 and 120 min exposure to rotenone, CCCP, amiodarone, tolcapone, troglitazone, buspirone, nefazodone, ximelagatran and vehicle control (0.5% DMSO) in glucose media, at the concentrations determined by mito-tox assay (EC50-ATPgal). Results are reported as the percentage fold change compared to the basal level ± S.D. (n= 3).
⁄ P< 0.05,⁄⁄
P< 0.01,⁄⁄⁄
3.3. ATP/cytotoxicity assessment in HepG2 cells reflects the effects of the compounds upon cellular respiration
In order to confirm that the ATP measurements are representa-tive of the functional effects on the mitochondria Seahorse technology was used to define the bioenergetic phenotype of the cells cultured with and in the absence of glucose and to determine how this affects their response to mitochondrial toxicants. Cells in both conditions had similar basal phenotypes in terms of OCR (indicative of OXPHOS rates) and ECAR (indicative of glycolysis rates) with differences only becoming apparent once cells were exposed to mitochondrial toxins (Fig. 5). Although rotenone induced a similar decrease in OCR in both media at 29 min, only in glucose media is this accompanied by a significant increase in ECAR (Fig. 5A). In response to CCCP, OCR was only significantly increased in galactose whilst ECAR was only significantly increased in glucose media (Fig. 5B). In each case the significant increase in ECAR is only measured when cells are cultured in the presence of glucose as this allows the compensatory increase in glycolysis thus demonstrating the metabolic mechanisms underlying the acute glucose deprivation screen for mitochondrial damage.
Using this protocol to measure respiration in glucose media tro-glitazone, nefazodone, buspirone and amiodarone were seen to behave in a fashion similar to rotenone; decreasing OCR with a con-comitant increase in ECAR (Fig. 5C and D), indicative of their ability to induce mitochondrial dysfunction via inhibition of the electron transport chain (Table 1). The compounds generated similar results in galactose media (data not shown). Interestingly, amiodarone and tolcapone did not increase OCR, as would be expected, due to their reported action as uncouplers of respiration. Further work revealed that this discrepancy was not concentration related (data not shown). However, amiodarone has been described to have pleiotropic effects on the mitochondria; it is an uncoupler and also an inhibitor of the electron transport chain andb-oxidation, and this may underlie this result (Fromenty et al., 1990; Kennedy et al., 1996). Moreover, tolcapone has been identified as an uncou-pler and inhibitor of several complexes of the electron transport chain (Table 1). These results suggest that bioenergetic profile pat-terns are compound dependent and that the mitotoxicity screen may be more sensitive at defining mitotoxicity via ETC dysfunction than screening basal OCR and ECAR. However, Seahorse technology may be important when conducting further in-depth mechanistic investigations of the cause of mitotoxicity.
4. Conclusion
HepG2 cells are used extensively as a preclinical model during pharmaceutical drug discovery and development despite their lack of xenobiotic metabolic capacity, altered bioenergetic phenotype and lack of polarisation. Therefore, it is often postulated that HepG2 cells are of limited relevance to clinical hepatotoxicity. However, in terms of detecting mitochondrial toxicity we postulate that the tumorigenic bioenergetic phenotype of HepG2 cells is an advantage over fresh human hepatocytes (FHH). Specifically, the Warburg effect, which confers tumorigenic cells with the ability to utilise glycolysis as an additional mechanism to produce ATP when needed, does not occur in primary hepatocytes (Warburg, 1956). Therefore, although FHH are able to detect cell toxicity/ death caused via mitochondrial dysfunction, their fixed bioener-getic phenotype means that they lack the advantage of HepG2 cells in determining mechanistically whether cytotoxicity arises due to mitochondrial dysfunction as the glucose/galactose switch cannot be applied.
Overall, we have demonstrated that HepG2 cells acutely deprived of glucose are a suitable model for the identification of
mitochondrial toxicity when used alongside HepG2 cells in the presence of glucose. Furthermore, the dual assessment of ATP con-tent alongside cytotoxicity provides an enhanced mechanistic understanding of the causes of toxicity. Importantly, in this way ATP is a functional endpoint indicative of mitochondrial respiration which is sensitive enough to be measured early in toxicity, in the absence of cell death. This has allowed the identification of the time-dose window of the onset of mitochondrial dysfunction enabling the delineation of ensuing changes in cellular function to be assessed in a cause and effect manner. The utility of this assay to identify compounds which induce dysfunction of the ETC directly has been proven, with zero to low levels of false positive results. However, the use of a panel of hepatotoxins has also high-lighted limitations of the screen in detecting alternative mecha-nisms of mitochondrial dysfunction or mitotoxicity induced via reactive metabolites or fatty acid oxidation. The functional model developed here is able to give information on the potency of a ser-ies of compounds upon mitochondrial dysfunction which may be indicative of the propensity to cause hepatotoxicity. However, it cannot be used to replace the current preclinical testing strategies to predict compounds which will induce hepatotoxicity, as there is no clear link between the concentrations which cause mitochon-drial dysfunction and peak plasma concentration in humans. Therefore we propose that this updated method provides a sensi-tive, convenient, cost effective and fast first tier screening platform to identify mitochondrial liabilities during drug development which should be used for parent compound alongside synthetic equivalents of any significant human drug metabolites. However, we emphasise that despite the very low false positive rate of this method, the compounds identified as negative by this model should go through further cytotoxicity assessment in order to rule out their cyto- or hepato-toxicity. This method therefore provides a starting point from which to conduct further studies delineating the mechanistic pathways linking mitochondrial toxicity with the onset of DILI.
Conflict of Interests
Dr. Mario Monshouwer and Dr. Jan Snoeys are empolyed by Janssen Pharmaceutica and hold stock in Johnson & Johnson.
Transparency Document
TheTransparency documentassociated with this article can be found in the online version.
Acknowledgments
This work is supported by the European Community under the Innovative Medicines Initiative (IMI) Programme through [Grant Agreement Number 115336 (MIP-DILI)] and Janssen Pharmaceutica N.V. [Agreement ICD #387882], as part of the Drug Safety Centre supported by the Medical Research Council, United Kingdom [Grant Number G0700654] to [LK].
References
Boelsterli, U.A., Lim, P.L.K., 2007. Mitochondrial abnormalities – a link to idiosyncratic drug hepatotoxicity? Toxicol. Appl. Pharmacol. 220, 92–107.
Clement, B., Lopian, K., 2003. Characterization ofin vitrobiotransformation of new, orally active, direct thrombin inhibitor ximelagatran, an amidoxime and ester prodrug. Drug Metab. Dispos. 31, 645–651.
cytotoxicity of nefazodone, trazodone, and buspirone. Toxicol. Sci. 103, 335– 345.
Eriksson, U.G., Bredberg, U., Hoffmann, K.J., Thuresson, A., Gabrielsson, M., Ericsson, H., Ahnoff, M., Gislen, K., Fager, G., Gustafsson, D., 2003. Absorption, distribution, metabolism, and excretion of ximelagatran, an oral direct thrombin inhibitor, in rats, dogs, and humans. Drug Metab. Dispos. 31, 294–305.
Fattinger, K., Funk, C., Pantze, M., Weber, C., Reichen, J., Stieger, B., Meier, P.J., 2001. The endothelin antagonist bosentan inhibits the canalicular bile salt export pump: a potential mechanism for hepatic adverse reactions. Clin. Pharmacol. Ther. 69, 223–231.
Fischer, J.J., Michaelis, S., Schrey, A.K., Baessler, O.G.N., Glinski, M., Dreger, M., Kroll, F., Koester, H., 2010. Capture compound mass spectrometry sheds light on the molecular mechanisms of liver toxicity of two parkinson drugs. Toxicol. Sci. 113, 243–253.
Fromenty, B., Fisch, C., Berson, A., Letteron, P., Larrey, D., Pessayre, D., 1990. Dual effect of amiodarone on mitochondrial respiration – initial protonophoric uncoupling effect followed by inhibition of the respiratory-chain at the levels of Complex-I and Complex-Ii. J. Pharmacol. Exp. Ther. 255, 1377–1384.
Gerets, H.H.J., Tilmant, K., Gerin, B., Chanteux, H., Depelchin, B.O., Dhalluin, S., Atienzar, F.A., 2012. Characterization of primary human hepatocytes, HepG2 cells, and HepaRG cells at the mRNA level and CYP activity in response to inducers and their predictivity for the detection of human hepatotoxins. Cell Biol. Toxicol. 28, 69–87.
Hussaini, S.H., Farrington, E.A., 2014. Idiosyncratic drug-induced liver injury: an update on the 2007 overview. Expert Opin. Drug Safety 13, 67–81.
Kenne, K., Skanberg, I., Glinghammar, B., Berson, A., Pessayre, D., Flinois, J.P., Beaune, P., Edebert, I., Pohl, C.D., Carlsson, S., Andersson, T.B., 2008. Prediction of drug-induced liver injury in humans by using in vitro methods: the case of ximelagatran. Toxicol.In Vitro22, 730–746.
Kennedy, J.A., Unger, S.A., Horowitz, J.D., 1996. Inhibition of carnitine palmitoyltransferase-1 in rat heart and liver by perhexiline and amiodarone. Biochem. Pharmacol. 52, 273–280.
Korlipara, L.V., Cooper, J.M., Schapira, A.H., 2004. Differences in toxicity of the catechol-O-methyl transferase inhibitors, tolcapone and entacapone to cultured human neuroblastoma cells. Neuropharmacol. 46, 562–569.
Kon, K., Kim, J.S., Jaeschke, H., Lemasters, J.J., 2004. Mitochondrial permeability transition in acetaminophen-induced necrosis and apoptosis of cultured mouse hepatocytes. Hepatology 40, 1170–1179.
Labbe, G., Pessayre, D., Fromenty, B., 2008. Drug-induced liver injury through mitochondrial dysfunction: mechanisms and detection during preclinical safety studies. Fundam. Clin. Pharmacol. 22, 335–353.
Lofrumento, D.D., La Piana, G., Abbrescia, D.I., Palmitessa, V., La Pesa, V., Marzulli, D., Lofrumento, N.E., 2011. Valinomycin induced energy-dependent mitochondrial
swelling, cytochrome c release, cytosolic NADH/cytochrome c oxidation and apoptosis. Apoptosis 16, 1004–1013.
Marroquin, L.D., Hynes, J., Dykens, J.A., Jamieson, J.D., Will, Y., 2007. Circumventing the crabtree effect: replacing media glucose with galactose increases susceptibility of HepG2 cells to mitochondrial toxicants. Toxicol. Sci. 97, 539– 547.
Moreno-Sanchez, R., Bravo, C., Vasquez, C., Ayala, G., Silveira, L.H., Martinez-Lavin, M., 1999. Inhibition and uncoupling of oxidative phosphorylation by nonsteroidal anti-inflammatory drugs - Study in mitochondria, submitochondrial particles, cells, and whole heart. Biochem. Pharmacol. 57, 743–752.
Nadanaciva, S., Bernal, A., Aggeler, R., Capaldi, R., Will, Y., 2007. Target identification of drug induced mitochondrial toxicity using immunocapture based OXPHOS activity assays. Toxicol.In Vitro21, 902–911.
Nelson, S.D., 1990. Molecular mechanisms of the hepatotoxicity caused by acetaminophen. Semin. Liver Dis. 10, 267–278.
Ong, M.M.K., Latchoumycandane, C., Boelsterli, U.A., 2007. Troglitazone-induced hepatic necrosis in an animal model of silent genetic mitochondrial abnormalities. Toxicol. Sci. 97, 205–213.
Parmar, D.V., Ahmed, G., Khandkar, M.A., Katyare, S.S., 1995. Mitochondrial ATPase: a target for paracetamol-induced hepatotoxicity. Eur. J. Pharmacol. 293, 225– 229.
Pereira, C.V., Oliveira, P.J., Will, Y., Nadanaciva, S., 2012. Mitochondrial bioenergetics and drug-induced toxicity in a panel of mouse embryonic fibroblasts with mitochondrial DNA single nucleotide polymorphisms. Toxicol. Appl. Pharmacol. 264, 167–181.
Pike, L.S., Smift, A.L., Croteau, N.J., Ferrick, D.A., Wu, M., 2011. Inhibition of fatty acid oxidation by etomoxir impairs NADPH production and increases reactive oxygen species resulting in ATP depletion and cell death in human glioblastoma cells. Biochim. Biophys. Acta – Bioenergetics 1807, 726–734.
Ramachandran, A., Lebofsky, M., Weinman, S.A., Jaeschke, H., 2011. The impact of partial manganese superoxide dismutase (SOD2)-deficiency on mitochondrial oxidant stress, DNA fragmentation and liver injury during acetaminophen hepatotoxicity. Toxicol. Appl. Pharmacol. 251, 226–233.
Scatena, R., Martorana, G.E., Bottoni, P., Giardina, B., 2004. Mitochondrial dysfunction by synthetic ligands of peroxisome proliferator activated receptors (PPARs). IUBMB Life 56, 477–482.
Swiss, R., Niles, A., Cali, J.J., Nadanaciva, S., Will, Y., 2013. Validation of a HTS-amenable assay to detect drug-induced mitochondrial toxicity in the absence and presence of cell death. Toxicol.In Vitro27, 1789–1797.
Warburg, O., 1956. Origin of cancer cells. Science 123, 309–314.