DMUNI
Statistical Office of the European Communities
NOMICA EUP >,RBON ET DE L'ACIER EUROPÄISCHE GEMEINSCHAFT FÜR KOHLE U N D STAHL COMUNITÀ' EUROPEA DEL CARBC * U T Ï EUROPEENNE DU CHARBON ET DE L'ACIER COMUNITÀ' EUROPEA DEL CARBONE E DELL'ACCIAIO ; H A P VOOR KOLEN EN STAAL EUROPAISCHE WIRTSCHAFTSGEI, OMMUNAUTE ECONOMIQUE EURO
ECONOMICA EUROPEA EUROPESE ECONOMISCHE GEMEENSCHAP EUROPAISCHE ATOMGEMEINSCHAFT COMM ï DE L'ENERGIE ATOMIQUE COMUNITÀ' EUROPEA DELL ENERGIA ATOMICA EUROPESE GEMEENSCHAP VOOR AT< JNAUTE EUROPEENNE DU CHARBON ET DE L'ACIER EUROPÄISCHE GEMEINSCHAFT FÜR KOHLE U N D STAI lOPEA DEL CARBONE E DELI " VOOR KOLEN EN S T A A L C O M M U N A U X E EUROPAl
VIUNAUTE E' E DE L'ENERI JNAUTE EUÌ tOPEA DEL c| ι EUROPÄI vlUNAUTE El| A EUROPE! NNE DU CHI I STAAL EL A EUROPE WIQUE C(| JROPEENNE E E DELL'AC' IRTSCHAFTS NNE DE L'EI 1EENSCHAP >N ET DÉ L
iUROPESE GEMEENSCHAP VO H A F T COMUNITÀ' ECONOI IMIQUE EUROPÄISCHE ATC AENERGIE EUROPÄISCHE C JROPESE GEMEENSCHAP VO' : H A F T COMUNITÀ' ECON ERGIE ATOMIQUE EUROPAl DR ATOOMENERGIE EUROP R COMUNITÀ' EUROPEA DEI «.FTSGEMEINSCHAFT COMMU MEENSCHAP EUROPAISCHE AT«.
OMIQUE JROPEA
NNE DU CHARBON ET DE L'ACIER IE E DELL'ACCIAIO EUROPESE G
WIRTSCHAFTSGEMEINSCHAF1 IUNAUTE EUROPEENNE DE L'ENERGIE
ATOMICA EUROPESE GEMEENSCHAP COMMUNAUTE EURO
3MUNITA' EUROPEA I
B A S I C
S T A T I S T I C S
O F T H E
C O M M U N I T Y
MICA EUROPEA EUROPESE ECONOMISCHE ι OMGEMEINSCHAFT COMUNITÀ' EUROPEA E 'MICA EUROPESE GEMEENSCHAP VOOR ATC HE GEMEINSCHAFT FÜR KOHLE U N D STAI R KOLEN EN STAAL COMMUNAUTE ECON MICA EUROPEA EUROPESE ECONO: OMGEMEINSCHAFT COMUNITÀ' EUROPEA C
EMEINSCHAFT FÜR KOHLE U N D STAHL CC i.E DELL'ACCIAIO EUROPESE GEMEENS' *IQUE EUROPEENNE COMUNITÀ' y ' - COMMUNAUTE EUROPEEN " VOOR ATOOMENERGIE STAHL COMUNITÀ' El >NOMIQUE EUROPEE* 'EMEENSCHAP CC y \ ELL ENERGIA ATO, •y 'MMUNAUTE EUR « A JSCHAP VOOR I TA' ECONOMIC NNE DE L'ENEI ■MMUNAUTE E ι DEL CÄRBOf ROPÄISCHE V·. MUNAUTE El ¿ICA EUROPE JPEENNE DU CI , EN STAAL EU Û J * SOPEAEUROPE Λ γ ,'OMIQUE COMU / φ J E N N E DU CHARBO OELL'ACCIAlO EURI SCHAFTSGEMEINSCHAF' J V ? <NE DE L'ENERGIE ATOMIC M * * MEENSCHAP VOOR ΑΤΟΟΜΕΓ. RBON ET DE L'ACIER COMUNIT SCHE WIRTSCHAFTSGEMEINS IP VOOR KOLEN EN STAÍ
Addresses
Luxembourg, Centre Louvigny, P.O. Box 130 - Tel. 2 88 31
1040 Brussels, Bâtiment Berlaymont
200, rue de la Loi (Liaison Office) - Tel. 35 80 40
BASIC STATISTICS
OF THE COMMUNITY
Comparison with some European countries,
Canada, the United States of America, Japan
and the Union of Soviet Socialist Republics
LA ROCHEFOUCAULD
"The principal point of wisdom,
is to know how to value
things just as they deserve"
ALAIN
"Knowing is to know that you know'
Brussels
—
0.
0
□
<
%
gm kg t t - t mm km ha sq km hi eu. m tec Teal PCS kWh GWh MW kV mio DM Ffr Litnil very small
(generally less than half the unit used or half the last decimal place) not available
uncertain or estimated
estimate made by the Statistical Office of the European Communities less than
percentage gramme kilogramme metric ton ton for ton millimetre kilometre hectare square kilometre hectolitre cubic metre ton coal equivalent teracalory = 10* kllocalory Gross calorific value kilowatt-hour
gigawatt-hour = 10* kWh megawatt =■ 10a kilowatt kilovolt
Fl Guilders Fb Belgian Francs Flbg Luxembourg Francs ï Dollars £ Pounds sterling Dr Drachma Lt Turkish Lira Cr Crowns Sfr Swiss Francs Sch Schillings (Austrian)
Esc Escudos /
Mkf Finnish Markka Pes Pesetas R Roubles GDP Gross domestic product GNP Gross national product
EFTA European Free Trade Association ECSC European Coal and Steel Community EEC European Economic Community UN United Nations
ILO International Labour Office
SOEC Statistical Office of the European Communities FAO Food and Agriculture Organization
AOM Overseas states, territories and departments associated with the EEC OT Overseas territory
UIC International Union of Railways IATA International Air Transport Association EPU European Payments Union
PART I:
COMPARISON BETWEEN THE COMMUNITY AND OTHER COUNTRIES
Table Page POPULATION
1 Area, population, density per sq. kilometre and estimated
population growth 14 2 Population by age and sex ('000) 15
3 Population by age and sex (% of total) 16
4 Births, marriages and deaths 17
5 Size of households 18
LABOUR FORCE
6 Civilian labour force by occupational status 19 7 Civilian labour force by main sectors of economic activity . . . 20
8 Unemployment 21
NATIONAL ACCOUNTS
9 Gross national product at market prices 22 10 Volume indices of gross national product at market prices . . 23
11 Averageannualratesofgrowth—1959-1969 — at constant prices 24
12 Origin of gross domestic product at factor cost 25
13 Distribution of national income (%) 26 14 Use of gross domestic product ( %) 27 15 Use of gross domestic product ($ '000 mio) 28 16 Gross fixed asset formation by type of asset ( %) 29 17 Expenditures and receipts of general government (in % of GNP at
market prices) 30 18 Breakdown of revenue from taxation 32
AGRICULTURE
19 Indices of agricultural output 33 20 Pattern of land utilization 34 21 Production of cereals 35 22 Production of selected agricultural commodities ' 36
Table Page
ENERGY
27 Production of primary energy 41 28 Inland consumption of primary energy products and equivalents 42
29 Coal - Lignite 43 30 Production of secondary fuels from solid fuels 44
31 Production and reserves of crude oil and natural gas 45
32 Crude oil and petroleum products 46 33 Refining capacity and crude oil intake 48 34 Production of electrical energy 49 35 Electrical power plant 50 36 Consumption of electrical energy 52
INDUSTRY
37 General indices of industrial production 53
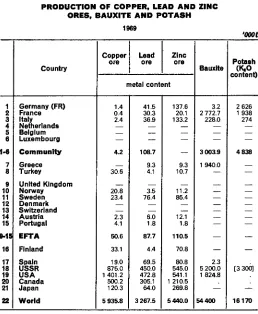
38 Output of iron ore 54 39 Production of copper, lead and zinc ores, bauxite and potash . 55
40 Production of tobacco 56 41 Spindles and looms installed 57 42 Production of cotton and woollen yarns and fabrics 58
43 Production of man-made fibres 59 44 Production of wood pulp, newsprint, paper and board . . . . 60
45 Production of certain basic chemicals 61 46 Chemicals: production of ammonia, fertilizers and plastics . . 62
47 Production of cement and building bricks 63 48 Production of pig iron, steel and finished rolled products . . . 64
49 Production of aluminium, copper, lead, zinc and tin 65 50 Merchant vessels under construction and launched 66 51 Motor vehicles, production and assembly 67 52 Building: number of dwellings completed 68
TRANSPORT
53 Railways: length of line, passenger-kilometres and ton-kilometres 69
EXTERNAL TRADE
57 External trade figures of EEC, EFTA and other countries . . . 73
58 Total imports 74 59 Total exports 76 60 Balance of trade 78 61 Imports from member countries of EEC ($ mio) 80
62 Imports from member countries of EEC {% share of total imports
of importing country) 82 63 Exports to member countries of EEC ($ mio) 84
64 Exports to member countries of EEC ( % share of total exports of
exporting country) 86 65 Total imports by area of origin ($ mio) 88
66 Total imports by area of origin (%) 89 67 Total exports by area of destination ($ mio) 90 68 Total exports by area of destination ( %) 91 69 Imports by groups of products ($ mio) 92 70 Imports by groups of products ( %) 93 71 Exports by groups of products ($ mio) 94 72 Exports by groups of products (%) 95 73 EEC share in imports by main non-EEC countries 96
74 EEC share in exports by main non-EEC countries 97 75 Development of EEC-trade by most important partner-countries,
Extra-EEC (destination) 98 76 Development of EEC-trade by most important partner-countries.
Extra-EEC (origin) 99
SOCIAL STATISTICS
77 Social security benefits per head (Total population) 100 78 Social security benefits per head (Persons aged 15-65) . . . 101
79 Social security expenditure as percentage of gross national product
at market prices 102
STANDARD OF LIVING
80 Nutritional value of food consumption 103 81 Consumption of selected vegetable products 104 82 Consumption of selected animal products 105 83 Consumption of energy and steel per head of population . . . 106
Table Page
FINANCE
87 Central government debt 110
88 Money supply 111 89 Money market rates 112 90 Financial market rates 113 91 Balances of payments by main heading 114
92 Gross reserves in gold and convertible currencies 116 93 International Monetary Fund positions (IMF) 117
PART I I :
ADDITIONAL FIGURES FOR THE COMMUNITY
EDUCATION
94 Numbers attending school and university 121
95 Attendance rate 122 96 Primary education: pupils and teachers 124
97 Secondary education: certificates awarded 126 98 Higher education : courses taken by students 128
LABOUR FORCE
99 Population and employment 130 100 Persons in employment by industrial status and by sector. . . 131
101 Salaried employees and wage-earners by NICE classes. . . . 132
102 Average weekly hours worked by manual workers 134
AGRICULTURE
103 Farms of 1 hectare and over, by size group 136
109 Production of primary energy products 143
110 Energy trade 144 111 Gross inland consumption of primary energy products and
equivalents 145 112 Share of each product in the gross inland consumption of primary
energy products and equivalents 146 113 Dependence on foreign energy sources 147
114 Coal - total output 148 115 Petroleum products - total production 149
116 Electrical energy - gross production by sources 150 117 Electrical energy - total gross production 151
INDUSTRY
118 Production of crude steel 152 119 Consumption of steel per head of population 153
TRANSPORT
120 Rail freight traffic 154
EXTERNAL TRADE
121 Intra-Communlty trade 155 122 Volume index of external trade - imports 156
123 Volume index of external trade - exports 157
SOCIAL STATISTICS
124 Social accounts: General account of social expenditure . . . 159
125 Social accounts: Benefits by contingency 160 126 Social accounts: Sources of receipts 162 127 Avumyi! hourly gross earnings . 164 128 Employers' expenditures on wages and related elements of
labour cost (per hour) (wage-earners) 166 129 Employers' expenditures on wages and related elements of
labour cost (per month) (salaried employees) 168 130 Employers' expenditures on wages and related elements of
labour cost (per hour) (salaried wage-earners and employees). 170
131 Index of wages in industry 172
PRICES
Table Page
FINANCE
•134 Money supply 175 135 Index of share prices 176 136 Official gross reserves of gold and convertible currencies . . . 177
REGIONAL PRODUCT 137 GDP at market prices (global and per capita) 138 Origin of GDP at market prices ( %) 139 GDP at market prices (global and per capita) 140 Origin of GDP at market prices ( %) 141 GDP at market prices (global and per capita) 142 Origin of GDP at factor cost ( %)
143 GDP at market prices (global and per capita)
Netherlands, Belgium, Luxembourg 186 144 Origin of GDP at market prices ( %)
Netherlands, Belgium, Luxembourg 187 Germany (FR) Germany (FR) France France Italy Italy
178 180 182 183 184 185
PART III:
ADDITIONAL FIGURES FOR IRON AND STEEL INDUSTRY AND MINING
145 Personnel employed in the Community's coal-mining, iron-mining
and iron and steel industries 190 146 Foreign workers employed in the Community's coal and steel
industries (by nationality) 192 147 Supply of iron ore in the Community 194
148 Consumption of steel in the Community 195 149 Production of finished steel in the Community 196 150 All iron and steel products-Imports by ECSC from non-ECSC
countries ' 197 151 All iron and steel products-Exports from ECSC to non-ECSC
countries 198 152 All iron and steel products-lntra-Community trade 199
Civilian labour force by main sectors of economic activity. . . . 206
Gross national product at market prices 207 Average annual rates of growth of gross national product at
market prices 208 Gross fixed asset formation 209
Industrial production: general index 210 External trade, world trade by major groups. 211 Breakdown of population and labour force by age groups . . . . 212
Origin of gross domestic product at factor cost 213
Use of gross domestic product 214 Gross fixed asset formation by type of asset 215
Inland consumption of primary energy products and equivalents. . 216 Index of gross hourly wages of workers in industry and index of
consumer prices 217 Intra-EEC trade 1958 and 1969 218
P A R T I
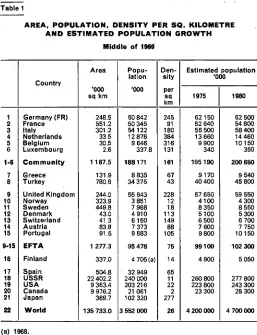
AREA, P O P U L A T I O N , DENSITY PER SQ. KILOMETRE A N D E S T I M A T E D P O P U L A T I O N G R O W T H
Middle of 1969
1 2 3 4 5 6 1-6
7 8 9 10 11 12 13 14 15 9-15
16 17 18 19 20 21 22
Country
Germany (FR) France Italy Netherlands Belgium Luxembourg C o m m u n i t y Greece Turkey United K i n g d o m Norway Sweden Denmark Switzerland A u s t r i a Portugal E F T A Finland Spain USSR U S A Canada Japan
W o r l d
A r e a
'000 sq km
248.5 551.2 301.2 33.5 30.5 2.6 1167.5 131.9 780.6 244.0 323.9 449.8 43.0 41.3 83.8 91.5 1 277.3 337.0 504.8 22 402.2 9 363.4 9 976.2 369.7 135 733.0
P o p u lation '000
60 842 50 345 54122 12 878 9 646 337.8 188171
8 835 34 375 55 643 3 851 7 968 4 910 6150 7 373 9 583 95 478 4 705(a) 32 949 240 000 203 216 21 061 102 320 3 552 000
D e n sity per sq km
245 91 180 384 316 131 161 67 43 228 12 18 113 149 88 105 75 14 65 11 22 2 277 26
Estimated p o p u l a t i o n '000
1975
62150 52 640 56 500 13 660 9 900 340 195190 9170 40 400 57 650 4100 8 350 5100 6 500 7 600 9 800 99100 4 900
260 800 223 800 23 300
4200 000 1980
62 500 54 800 58 400 14 460 10 150 350 200 650 9540 45 800 59 550 4 300 8 550 5 300 6 700 7 750 10150 102 300 5 050
277 800 243 300 25 300
4 700 000
[image:16.309.31.288.29.364.2]I. P O P U L A T I O N
Table 2
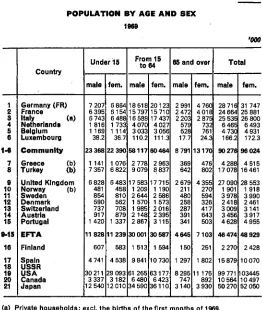
P O P U L A T I O N BY AGE A N D SEX
•000 1 2 3 4 5 6 1-6 7 8 9 10 11 12 13 14 15 9-15 16 17 18 19 20 21
C o u n t r y
Germany (FR) France
Italy (a) Netherlands
B e l g i u m L u x e m b o u r g C o m m u n i t y Greece (b) T u r k e y ( b ) United K i n g d o m Norway (b) S w e d e n
D e n m a r k Switzerland A u s t r i a P o r t u g a l E F T A Finland S p a i n U S S R U S A Canada J a p a n
Under 15 male 7 207 6 395 6 743 1 816 1 169 38.2 23 368 1 141 7 357 6 828 481 854 590 737 917 1 420 11 828 607 4 741 30 211 3 337 12 540 fern. 6 864 6154 6 488 1 733 1 114 36.7 22 390 1 076 6 822 6 483 458 810 562 708 879 1 337 11239 583 4 538 29 093 3182 12010
F r o m 15 t o 64
male 18518 15 797 16 589 4 070 3 033 110.2 58117 2 778 9 079 17 583 1 209 2 644 1 570 1 985 2 148 2 867 30 001 1 513 9 841 61 265 6 480 34 590 fern. 20123 15710 17 437 4 027 3 056 111.3 60 464 2 963 8 837 17715 1 190 2 586 1 573 2 016 2 395 3115 30 587 1 594 10 730 63177 6 423 36110
65 and over
male 2 991 2 472 2 203 579 528 17.7 8 791 369 642 2 679 211 480 258 287 391 341 4645 150 1297 8 295 747 3140 fern. 4 760 4018 2 875 732 761 24.3 13170 476 802 4 355 270 594 326 417 643 503 7103 251 1 802 11 175 892 3 930
T o t a l
male 28 716 24 664 25 535 6 465 4 730 166.2 90 276 4 288 17 078 27 090 1 901 3 978 2418 3 009 3 456 4 628 46474 2 270 15 879 99 771 10564 50 270 fern. 31 747 25 881 26 800 6 493 4 931 172.3 96 024 4515 16 461 28 553 1 918 3 990 2 461 3141 3 917 4 955 48 929 2 428 10 070 103445 10 497 52 050
Table 3
P O P U L A T I O N BY AGE A N D SEX
1969
% of total
1 2 3 4 5 6 1-6 7 8 9 10 11 12 13 14 15 9-15 16 17 18 19 20 21 Country Germany (FR) France Italy (a) Netherlands Belgium Luxembourg Community Greece (b) Turkey (b) United Kingdom Norway (b) Sweden Denmark Switzerland Austria Portugal EFTA Finland Spain USSR USA Canada Japan Under 15 male 11.9 12.7 12.9 14.0 12.1 11.3 12.5 13.0 21.9 12.3 12.6 10.7 12.1 12.0 12.4 14.8 12.4 12.9 14.4 14.9 15.8 12.3 fern. 11.4 12.2 12.4 13.4 11.5 10.8 12.0 12.2 20.3 11.7 12.0 10.2 11.5 11.5 11.9 14.0 11.8 12.4 13.8 14.3 15.1 11.7 From 15 to 64 male 30.6 31.3 31.7 31.4 31.4 32.6 31.2 31.6 27.1 31.6 31.7 33.2 32.2 32.3 29.1 29.9 31.4 32.2 29.9 30.1 30.8 33.8 fern. 33.3 31.1 33.3 31.1 31.6 32.9 32.5 33.7 26.3 31.8 31.2 32.5 32.2 32.8 32.5 32.5 32.1 33.9 32.6 31.1 30.5 35.3
65 and over
male 4.9 4.9 4.2 4.5 5.5 5.2 4.7 4.2 1.9 4.8 5.5 6.0 5.2 4.7 5.3 3.6 4.9 3.2 3.9 4.1 3.5 3.1 fern. 7.9 7.9 5.5 5.6 7.9 7.2 7.1 5.4 2.4 7.8 7.1 7.5 6.7 6.8 8.7 5.2 7.4 5.3 5.5 5.5 4.2 3.8 Total male 47.5 48.8 48.8 49.9 49.0 49.1 48.5 48.7 50.9 48.7 49.8 49.9 49.6 48.9 46.9 48.3 48.7 48.3 48.2 49.1 50.2 49.1 fern. 52.5 51.2 51.2 50.1 51.0 50.9 51.5 51.3 49.1 51.3 50.2 50.1 50.4 51.1 53.1 51.7 51.3 51.7 51.8 50.9 498 50.9
POPULATION
Table 4
B I R T H S , MARRIAGES A N D D E A T H S 1969 1 2 3 4 5 6 1-6 7 8 9 10 11 12 13 14 15 9-15 16 17 18 19 20 21 Country Germany (FR) France Italy Netherlands Belgium Luxembourg C o m m u n i t y Greece
Turkey (a) United K i n g d o m Norway Sweden
Denmark (c) Switzerland A u s t r i a Portugal E F T A Finland Spain
USSR (c) U S A
Canada Japan Births '000 903 840 946 248 141 4.5 3 083 154.0 920.9 68.1 108.0 74.5 102.5 121.0 185.3 1 580.3 68.2 663.4 4118.0 3 571.0 371.1 1 870.8 per '000 p o p u l a t i o n
14.8 16.7 17.3 19.2 14.6 13.3 16.4 17.4 43.0 16.6 17.7 13.5 15.3 16.5 16.4 19.4 16.7 14.5 20.1 17.3 17.7 17.6 18.3 Marriages '000 447 380 385 117 72 2.2 1 403(a) 71.4 451.2 (c) 29.9 47.9 39.5 46.9 54.4 79.2 749.0 40.7 238.1 2 119.0 2146.0 182.1 956.3 per '000 p o p u l a t i o n
7.3 7.6 7.1 9.1 7.5 6.6 7.5 8.1 8.1 (c)7.7 6.0 8.1 7.5 7.4 8.3 7.9 8.7 7.2 8.9 10.6 8.6 9.3 Deaths '000 744 570 537 108 119 4.2 2082 72.3 659.5 38.1 83.3 47.3 58.0 97.7 99.8 1 083.7 46.0 302.3 1 843.0 1 916.0 154.4 686.4 per '000 p o p u l a t i o n
SIZE OF H O U S E H O L D S (a)
'000
1 2 3 4 5 6 1-β 7 8 9 10 11 12 13 14 15 9-15
16 17 18 19 20 21
Country
Germany (FR) France Italy Netherlands Belgium Luxembourg C o m m u n i t y Greece Turkey United Kingdom Norway Sweden Denmark Switzerland Austria Portugal EFTA Finland Spain USSR USA Canada Japan
Date
1969 1969 1969 1969 1969 1969
1961 23.10.60
1961 1,12,60 1,11,65 26, 9,60 1,12,60 1, 6,61 15,12,60
31,12,60
1964 1, 6,61 1965
Number of persons constituting household 1
5 795 3 369 1 797 306 503 44.9
11815 217 158
1 919 205 621 306
454 185
283
8 718 425 1 863
2
6 230 4 370 3 306 813 984 23.2
15 726 369 428
4 820 269 770 422
626 419
225
15 287 1 012 3 292
3
4 347 3 056 3 834 681 659 17.0
12 594 432 557
3 780 235 585 312
482 490
234
9 808 809 4 207
4
3 272 2 506 3 568 672 478 10.0
10506 448 734
3 1 0 0 221 479 276
345 417
213
9 435 837 5 146
5 or more
2 6 1 6 2 9 7 2 3 200 636 525 7.9
9 957
677 2 958
2 570 209 322 228
402 722
330
12 90é 1 472 8 577
Total
22 259 16 273 15 705 3 1 0 8 3 1 4 8 103.0
60 596 2 143 4 885
16189 1 139 2 778 1 534 1 581 2 308 2 233
1 315
56154 4 555 23 085
I. LABOUR FORCE
Table β
C I V I L I A N LABOUR FORCE BY O C C U P A T I O N A L S T A T U S
'000
1 2 3 4 5 6 1-6 7 8 9 10 11 12 13 14 15
9-15
16 17 18 19 20 21
Country
Germany (FR) France Italy
Netherlands (b) Belgium Luxembourg
Community
Greece
Turkey (c) United Kingdom Norway Sweden
Denmark (c) Switzerland (c) Austria
Portugal (c)
EFTA
Finland Spain USSR USA Canada Japan
Year
1969 1969 1969 1969 1969 1969 1969 1967 1965 1969 1969 1969 1969 1967 1969 1968
1969 1968 1967 1969 1969 1969
Employ-. ers
and others working
on own account
2 927 4 653(a 4 451
748(a 608
19.5
4019 1 819(a)
274 396 364 329(a) 836(a) 498
268 4 547(a) (7 148)
869 9 930
Unpaid family
work ers
1975 1 668
180
15.2
6 501
29 90 122
201
276
.
(1048) 191 8 440
Wage-earners
and employ
ees
21435 15 501 12 554 3 702 2 895 105.7
2 543 23 085 1 171 3 335 1808 2 376 2181 2 387
1 572 7 566 (82 300) [69 706) 6 720 31 990
Unem ployed
179 340 663 63 88 0
152
518 16 74 25 43
62 240 (2 831)
382 570
Total
26 516 20 494 19 336 4 513 3 771 140.4
3 762 13 063 25 422 1 490 3 895 2319 2 705 3 060 3 087
2178 12 353 82 300) 80 733) 8162 50 930
(a) Incl. unpaid family workers. (b) Man-years.
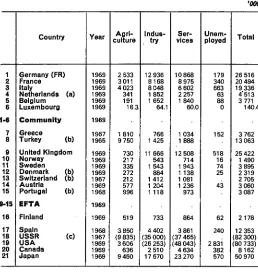
C I V I L I A N LABOUR FORCE BY M A I N S E C T O R S OF ECONOMIC A C T I V I T Y
'000
1 2 3 4 5 6 1-6 7 8 9 10 11 12 13 14 15 9-15
16 17 18 19 20 21
C o u n t r y
Germany (FR) France Italy
Netherlands (a) B e l g i u m
L u x e m b o u r g C o m m u n i t y Greece
Turkey (b) United K i n g d o m Norway S w e d e n
D e n m a r k (b) Switzerland ( b ) A u s t r i a
P o r t u g a l (b) E F T A
Finland S p a i n
U S S R (c) U S A
Canada J a p a n
Year
1969 1969 1969 1969 1969 1969 1969
1967 1965 1969 1969 1969 1969 1967 1969 1968 1969 1969 1968 1967 1969 1969 1969
A g r i c u l t u r e
2 533 3011 4 023 341 191 16.3
1810 9 750 730 217 335 272 212 577 996
519 3 850 (9 835) 3 606 636 9 460
I n d u s -. »ry
12 936 8168 8 048 1852 1 652 64.1
766 1 425 11 666 543 1 543 884 1 412 1 204 1 118
733 4 402 (35 000) (26 253) 2 510 17 670
Ser vices
10 868 8 975 6 602 2 257 1 840 60.0
1034 1888 12 508 714 1943 1 138 1 081 1 236 973
864 3 861 (37 465) (48 043) 4 634 23 270
U n e m ployed
179 340 663 63 88 0
152
518 16 74 25 43
62 240 2 831 382 570
T o t a l
26 516 20 494 19 336 4'513 3 771 140.4
3 762 13 063 25 422 1 490 3 895 2 319 2 705 3 060 3 087
2178 12 353 (82 300) (80 733) 8162 50 970
(a) Man-years.
[image:22.309.31.289.79.352.2]I. LABOUR FORCE
Table 8
UNEMPLOYMENT 1963 - 1 0 0
1 2 3 4 5 6 1-6 7 8 9 10 11 12 13 14 15 9-15
16 17 18 19 20 21
Country
Germany (FR) France Italy Netherlands Belgium Luxembourg Community Greece Turkey United Kingdom Norway Sweden Denmark Switzerland Austria Portugal EFTA Finland Spain USSR USA Canada Japan
1965
79 99 143 103 102
—
92
62 76 69 55 36 93
97 147 83 75 98
1966
87 103 153 132 108
—
93
65 67 94 63 36 87
109 123 71 71 110
1967
247 134 137 253 148
—
120
100 64 126 77 31 91
197 146 73 84 158
1968
174 158 138 238 177
—
106
105 93 166 37 100
275 182 69 102
1969
96 131 132 185 142
—
104 89 114 57
60
194
Table 9
GROSS N A T I O N A L P R O D U C T A T MARKET PRICES
(at current prices and exchange rates)
S '000 mio
1 2 3 4 5 6 1-β 7 8 9 10 11 12 13 14 15 9-15 16 17 18 19 20 21 Country Germany (FR) France Italy Netherlands Belgium Luxembourg Community Greece Turkey United Kingdom Norway Sweden Denmark Switzerland Austria Portugal EFTA Finland Spain USSR USA Canada Japan 1958 [592] 53.6 30.3 9.5 10.4 0.4 163.4 3.1 6.0 64.8 4.0 5.0 7.2 5.3 2.2 4.0 9.7 455.0 32.0 1960 72.0 61.1 34.9 11.2 11.4 0.5 191.2 3.5 5.4 72.2 4.5 13.1 6.0 8.5 6.2 2.5 112.9 4 9 10.3 511.4 38.7 43.1 1963 96.0 83.4 50.0 14.6 13.9 0.5 258.5 4.7 7.0 86.0 5.7 16.9 7.9 11.5 7.8 3.1 138.9 6.4 16.1 5997 41.8 68.0 1964 105.2 92.5 54.7 17.2 15.6 0.6 285.8 5.3 7.6 93.3 6.3 18.9 9.0 12.7 8.5 3.4 152.1 7.3 18.1 642.8 45.8 80.1 1965 115.1 99.2 58.9 '19.2 17.0 0.7 310.0 5.9 8.1 100.3 7.0 20.9 10.2 13.7 9.3 3.8 165.1 8.0 21.5 696.3 505 88.3 1966 122.7 107.9 63.7 20.8 18.3 0.7 334.1 6.5 9.5 106.8 7.7 22.7 11.1 14.8 10.1 4.1 177.2 8.6 24.6 762.7 56.5 101.5 1967 123.7 116.1 70.1 22.9 19.6 0.7 353.0 7.0 10.6 110.2 8.4 24.4 12.1 15.7 10.7 4.6 186.3 8.7 26.7 808.1 60.4 119.7 1968 134.6 127.3 75.4 25.4 20.7 0.8 384.2 7.6 11.7 103.2 9.0 25.9 12.3 17.0 11.4 5.2 184.0 8.1 25.8 880 1
I. NATIONAL ACCOUNTS
Table 10
VOLUME INDICES OF GROSS NATIONAL PRODUCT
AT MARKET PRICES
1tt3-109
1 2 3 4 5 6 1-6 7 8 9 10 11 12 13 14 15 9-15 16 17 18 19 20 21C o u n t r y
G e r m a n y (FR) France Italy Netherlands B e l g i u m L u x e m b o u r g C o m m u n i t y Greece T u r k e y United K i n g d o m Norway S w e d e n D e n m a r k Switzerland A u s t r i a P o r t u g a l E F T A Finland S p a i n U S S R U S A Canada J a p a n
Table 11
AVERAGE ANNUAL RATES OF GROWTH 1959-1969
(at constant prices)
%
1 2 3 4 5 6 1-6
7 8 9 10 11 12 13 14 15 9-15
16 17 18 19 20 21
Country
Germany (FR) France Italy Netherlands Belgium
Luxembourg (a) Community
Greece Turkey United Kingdom Norway
Sweden (a) Denmark
Switzerland Austria Portugal EFTA Finland Spain USSR USA
Canada (a) Japan
Gross national product at market prices
total
5.1 5.9 5.6 5.4 4.8 3.3
5.5
7.1 5.4
3.0 4.9 4.7 4.9 4.6 4.7 6.3
3.7
5.2
7.1
4.3 5.5 11.4
per capita
4.0 4.8 4.8 4.0 4.2 2.5
4.4
6.4 2.8
2.3 4.1 3.9 4.1 3.0 4.2 5.6
2.9
4.5
6.1
2.9 3.6 10.3
Gross domes tic product at market prices per person
employed
4.7 5.4 6.3 4.2 4.1 2.8
5.2
6.0 4.4
2.6 4.2 3.9 3.8 3.1 4.9 6.9
3.4
4.8
6.5
2.3 2.5 9.7
N A T I O N A L A C C O U N T S
Table 12
ORIGIN OF GROSS DOMESTIC P R O D U C T A T FACTOR C O S T 1968
(a) Net domestic product at factor cost. (b) Gross domestic product at market prices. (c) 1967.
(d) Excl. Switzerland.
%
1 2 3 4 5 6 1-6
7 8 9 10 11 12 13 14 15 9-15
16 17 18 19 20 21
Country
Germany (FR) France Italy Netherlands Belgium Luxembourg Community Greece
Turkey (a) United Kingdom
Norway
Sweden (b)(c) Denmark
Switzerland Austria Portugal
EFTA (d)
Finland Spain USSR
USA (b) Canada
Japan (a) Agri culture, forestry and fishing
4.5 7.8 11.2 7.0 5.2 5.3
7.0
21.0 33.7 3.1 7.0 5.0 8 9 8.1 18.3 4.9
15.3 16.2 2.9
10.1
Industry (Incl. con struction)
50.8 43.7 38.6 41.9 40.7 52.0 44.8 27.5 26.4 46.1 37.9 40.4 39.5 50.3 43.2 44.3 39.4 34.1 36.2 40.5
Services and General govern
ment
44.6 48.5 50.2 51.1 54.1 42.6 48.2 51.5 39.9 50.8 55.1 54.7 51.6 41.6 38.5 50.8 45.4 49.7 60.9 49.3
Gross domestic
product at factor cost
100 100 100 100 100 100
100
100 100
100 100 100 100
100 100
100
100
loo
DISTRIBUTION OF NATIONAL INCOME
1968
(a) Gross national product at factor cost.
%
1 2 3 4 5 6 16 7 8 9 10 11 12 13 14 15 915 16 17 18 19 20 21 CountryGermany (FR) France Italy Netherlands Belgium Luxembourg
C o m m u n i t y
Greece Turkey
United Kingdom Norway
S w e d e n ( a ) Denmark Switzerland Austria Portugal
E F T A ( b )
Finland
Spain U S S R U S A Canada Japan
«
o e o « tom Φ C φ Φ >> α ο ε α ο Ε υ ω
64.1 62.7 56.7 65.6 62.8 67.3 62.2 40.0 75.5 67.9 72.1 67.3 62.7 68.6 72.3 64.1 56.5 71.9 70.8 54.4 Ο Ρ. 3 α
Ε2«,
ο α α
S ?
s·»
Ι
Ε c ο
29.4 31.1 38.2 26.5 35.5 27.3 31.9 57.6 19.8 31 16.6 31 27.8 25.9 2: 27.2 34.7 21.1 21.4 32.3
of
W φ Q.J3 3 Ο
SS
η Ο ■ο ε· 3 υ
5.7 7.0 5.3 8.6 4.9 3.5 6.2 1.8 6.5 .4 8.4 .7 8.1 5.9 .9 6.3 7.7 8.7 8.1 13.0 men t opert y urshi p
Ε α °
¡ES
o o a
^ * 2
ce CO'Ji Φ E o c o co u ?
[image:28.309.25.298.39.404.2]I. N A T I O N A L A C C O U N T S
Table 14
USE OF GROSS DOMESTIC P R O D U C T 1969
%
1 2 3 4 5 6 1-6 7 8 9 10 11 12 13 14 15 9-15
16 17 18 19 20 21
Country
Germany (FR) France Italy Netherlands Belgium Luxembourg Community Greece Turkey United Kingdom Norway Sweden Denmark Switzerland Austria Portugal EFTA Finland Spain USSR USA Canada Japan
Private con sump
tion
55.4 60.5 63.9 56.1 62.6 (55.4)
59.1 68.4
63.2 55.1 53.8 61.8 58.8 57.2 72.1 60.8 53.8 68.2 61.5 50.8
Public con sump
tion
15.6 12.3 13.5 15.7 14.2 (10.9)
14.0 13.6
18.1 18.2 22.2 17.7 12.0 15.5 13.5 17.8 16.1 10.4 21.0 8.2
Gross fixed asset forma tion
24.3 25.4 20.6 25.6 21.4 (25.5)
23.9 30.3
17.5 25.1 22.9 21.9 26.1 23.2 18.5 20.2 23.6 21.9 16.8 35.1
Change in stocks
2.2 2.5 0.4 2.7 1.6 (0.0)
2.0 0.1
0.7 - 0 . 4 1.5 0.7 0.7 3.8 0.2 0.9 5.5 2.3
io
4.2Net exports of goods
and services
2.6 - 0 . 7 1.6 - 0 . 1 0.2 (8.3)
1.0 - 1 2 . 3
0.5 2.0 - 0 . 4 - 2 . 1 2.4 0.3 - 4 . 4 0.3 0.9 - 2 . 8 - 0 . 2 1.7
Gross do mestic product
at market
prices
loo 100 100 100 100 100 100 100
100 100 100 100 100 100 100 100 100 100
loó
Table 15
USE OF GROSS DOMESTIC P R O D U C T 1969
t '000 mìo
1 2 3 4 5 6 1-6 7 8 9 10 11 12 13 14 15 9-15
16 17 18 19 20 21
Country
Germany (FR) France Italy Netherlands Belgium Luxembourg Community Greece Turkey United Kingdom Norway Sweden Denmark Switzerland Austria Portugal EFTA Finland Spain · USSR USA Canada Japan
Private con sump
tion
84.7 84.6 52.2 15.8 14.2 (0.5) 252.1
5.6
68.5 5.4 15.2 8.7 10.6 7.1 4.1 119.7 5.0 19.7 580.0 42.6 84.8
Public con-
sump-tion
23.8 17.2 11.0 4.4 3.2 (0.1) 59.8
1.1
19.6 1.8 6.3 2.5 2.2 1.9 0.8 35.0 1.5 3.0 198.1 12.7 13.7
Gross fixed asset forma tion
37.1 35.5 16.9 7.2 4.9 (0.2) 101.8
2.5
19.0 2.5 6.5 3.1 4.7 2.9 1.1 39.7 2 2 6.3 158.7 15.7 58.5
Change in stocks
3.4 3.6 0.3 0.8 0.4
(—)
8.4 0.00.7 0.0 0.4 0.1 0.1 0.5 0.0 1.8 0.5 0.7 9.0 1.0 7.0
Net exports of goods
and services
4.0 - 1 . 0 1.3 0.0 0.0 (0.1)
4.4 - 1 . 0
0.5 0.2 - 0 . 1 - 0 . 3 0.4 0.0 - 0 . 3 0.5 0.1 - 0 . 8 - 2 . 3 0.3 2.8
Gross do mestic product
at market prices
153.0 140.0 81.7 281 22.7 (0.9) 426.5
8.2
108.4 9.8 28.3 14.0 18.1 12.4 5.7 196.7 9.2 28.9 943.5 73.2a) 166.8
I. N A T I O N A L A C C O U N T S
GROSS FIXED A S S E T FORMATION BY T Y P E OF A S S E T
Table 16
1968
%
1 2 3 4 5 6 1-6 7 8 9 10 11 12 13 14 15 9-15
16 17 18 19 20 21
Country
Germany (FR) France Italy Netherlands Belgium Luxembourg Community Greece Turkey United Kingdom Norway Sweden Denmark Switzerland Austria Portugal EFTA Finland Spain USSR USA Canada Japan
Dwellings
24.1 27.4 32.7 21.3 26.7 34.1 26.6 25.3 19.1 20.0 17.8 26.2 21.1 24.5 18.8 23.5 21.4 22.6 18.6
21.6 18.2 20.1
Non-resi dential buildings and other construc
tion
33.6 31.1 31.8 36.8 36.2 37.4 32.7 36.6
8C 31.4 34.4 40.5 349 39.6 33.2 39.1 34.5 44.7 34.4
38.0 46.5 37.3
Equip ment
42.4 41.5 35.5 41.9 37.1 28.4 40.6 38.1 .9
48.5 47.8 33.3 44.0 35.8 47.9 37.5 44.0 32.7 47.0
40.4 35.4 42.6
Gross fixed asset
formation
100 100 100 100 100 100 100 100 100 100 100 100 100 100 100 100 100 100 100
Table 17
EXPENDITURES A N D RECEIPTS 1968
1 2 3 4 5 6 1-0 7 8 9 10 11 12 13 14 15 9-15
16 17 18 19 20 21
Country
Germany (FR) France Italy Netherlands Belgium Luxembourg Community Greece Turkey United Kingdom Norway Sweden Denmark Switzerland Austria Portugal EFTA Finland Spain USSR USA Canada Japan
Expenditures
Con sump
tion
15.5 12.7 13.5 15.6 13.9 11.9
12.9
18.0 17.7 21.9 17.8 11.6 15.2
16.8 10.3 21.0 15.3 8.4
Gross asset forma tion
3.9 3.4 2.6 5.1 3.4 4.7
5.1 4.4
4.9
6.4
5.5
3.2 4.3
Interest on the public debt
1.0 1.2 2.2 2.9 3.1 1.6
0.8
4.2 1.3 1.7 1.0 1.5 1.1
1.1
0.7
1.4 3.4 0.6
Current trans
fers
16.1 20.3 16.2 17.6 15.9 19.6
10.6
11.1 16.2 13.8 12.9 9.2 15.4
10.9 6.3
6.4 11.6 5.5
Capital trans
fers
1.6 1.5 1.6 1.2
1.7 0.3
i .4
0.3
Total (a)
37.5 38.9 35.8 41.8
39.0 39.3
38.7
34.3
I. NATIONAL ACCOUNTS
Table 17
OF GENERAL GOVERNMENT
¡n % of GNP at market prices
Receipts
Income from property and en
trepre neurship
1.6 0.6 2.1 2.2 0.6 3.1
1.3
2.9 1.8
r i £
' 2.7 0.7
3.1 1.7
3.2 0.7
Taxes
23.8 22.4 19.3 24.2 23.4 21.6
19.3
29.2 29.2 34.1 33.2 17.9 28.5
28.6 12.9 24.6 27.8 15.4
Contri butions
to social security
10.7 14 11.2 13.4 9.5 9.7
6.2
5.0 9.1 8.2 1.9 5.1 8.2
4.3
7.1 5.4 3.4 3.6
Othef current
trans fers
0.7 .8
0.7 1.0
0.6
0.2 1.6 0.6 1.5 0.0
0.7
0.9 1.1
Capital trans
fers
0.4 0.2 0.0 0.4
1.0 0.1 0.2 0.1
0.1
Total
36.8 38.0 33.3 41.3
38.3 41.9 37.7 37.6
36.8 1 2 3 4 5 6 1-0 7 8 9 10 11 12 13 14 15 9-15
16 17 18 19 20 21
Country
Table 18
BREAKDOWN OF REVENUE FROM T A X A T I O N
1968
1 2 3 4 5 6 1-6 7 8 9 10 11 12 13 14 15 9-15
16 17 18 19 20 21
Country
Germany (FR) France Italy Netherlands Belgium Luxembourg Community Greece
Turkey (a) United Kingdom
Norway Sweden Denmark Switzerland Austria Portugal EFTA Finland Spain USSR USA Canada Japan
Total revenue
from taxation
Mio S
31 980 28 470 14517 6152 4 858 167
1 460 1 803 30 209
2 613 8 716 4 066 3 011 3 238
2 325 3 287 217 141 17 298 21 883
Indirect taxes
Direct taxes
on corpo
rations on households
in % of total revenue from taxation
57.3 70.6 64.9 45.8 56.8 50.8
82.9 64.9 55.3 52.5 40.8 50.2 40.3 57.8
51.9 66.7
36.9 54.3 48.7
8.6 8.1 9.0 11.4 8.6 10.9
2.3 6.0 8.5 5.2 4.5 3.1 13.2 6.3
8.8 20.0
19.0 14.0 26.0
34.1 21.3 26.1 42.8 34.6 38.3
14.8 29.1 36.2 42.3 54.7 46.7 46.5 35.9
39.3 13.3
44.1 31.7 25.3
I. AGRICULTURE
INDICES OF AGRICULTURAL O U T P U T (a) Average 1952 - 1956 = 100
Table 19
1 2 3 4 5 6 1-0 7 8 9 10 11 12 13 14 15 9-15
16 17 18 19 20 21 22
C o u n t r y
Germany (FR) France Italy Netherlands B e l g i u m 1 L u x e m b o u r g / C o m m u n i t y Greece T u r k e y
United K i n g d o m Norway S w e d e n D e n m a r k Switzerland A u s t r i a P o r t u g a l E F T A Finland S p a i n U S S R U S A Canada J a p a n W o r l d
1962
123 131 121 130 119
126 131 133 132 83 104 125 110 131 119
117 129 112 114 130
1963
129 129 114 122 123
125 147 140 133 82 97 116 111 140 124
132 146 118 127 130
1964
127 130 124 125 116
127 154 146 139 78 104 119 112 139 120
136 132 117 118 135
1965
118 140 126 120 111
128 164 141 143 82 103 123 109 124 123
140 133 118 131 135
1966
127 135 130 123 106
129 171 157 146 80 93 120 114 134 110
132 146 118 144 139
1967
140 149 135 134 126
141 175 160 149 82 107 122 122 145 124
142 143 124 123 155
1968
145 155 132 144 131
145 164 166 146 86 111 128 127 148 122
142 154 125 134 162
1969
143 151 138 150 136
145 175 158 149 81 95 123 126 151 113
156 155 123 141 163
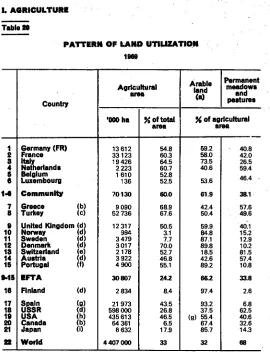
Table 20
PATTERN OF LAND UTILIZATION
1909
1 2 3 4 5 0 1-0 7 8 9 10 11 12 13 14 15 9-15
10 17 18 19 20 21 22
Country
Germany (FR) France Italy Netherlands Belgium Luxembourg Community Greece
Turkey (b) (c) United Kingdom (d) Norway
Sweden Denmark Switzerland Austria Portugal EFTA Finland Spain USSR USA Canada Japan World
(d) (d) (d) (e) (d) (f)
(d)
(g) (d) (h) (b) (i)
Agricultural area
'000 ha
13 612 33123 19 426 2 223 1 610 136 70130 9 090 52 736 12317 994 3 479 3017 2178 3 922 4 9 0 0 30807 2 834 21 973 598 000 435 613 64 361 6 632 4407 000
% of total area
54.8 60.3 64.5 60.7 52.8 52.5 60.0 68.9 67.6 50.5 3.1 7.7 70.0 52.7 46.8 55.1 24.2 8.4 43.5 26.8 46.5 6.5 17.9 33
Arable land
(a)
Permanent meadows
and pasture·
% of agricultural area
59.2 58.0 73.5 40.6 53.6
61.9 42.4 50.4 59.9 84.8 87.1 89.8 18.5 42.6 89.2 66.2 97.4 93.2 37.5 (g) 55.4
67.4 85.7 32
40.8 42.0 26.5 59.4 46.4
38.1 57.6 49.6 40.1 15.2 12.9 10.2 81.5 57.4 10.8 33.8 2.6 6.8 62.5 40.6 32.6 14.3 68
(a) Incl. land under permanent cultivation (orchards, vineyards, etc.). (b) 1966.
I. AGRICULTURE
Table»
P R O D U C T I O N OF CEREALS (a) Average 1967-1969 (b)
'000 t 1 2 3 4 5 β 1-0 7 8 9 10 11 12 13 14 15 9-15 10 17 18 19 20 21 22 Country Germany (FR) France Italy Netherlands Belgium Luxembourg Community Greece Turkey United Kingdom Norway Sweden Denmark Switzerland Austria Portugal EFTA Finland Spain USSR USA Canada Japan World Total of all cereals 18 675 32 804 14 580 1703 1 855 153 69 769 2 907 16248 13 731 649 4 286 6 299 632 2 876 1 474 29 947
2 283 10142 155 034 192 759 34 216 2 272 864000 Wheat
6 005 14 576
9 595 698 825 47 31746 1839 9808 3 615 10 922 428 394 996 565 6 930
464 5 283 90 428 40 006 18778 1011 313000 Rye and mesiin (c)
3 227 351 76 228 86 7 3 975 12 857 15 2 164 129 58 384 173 925 139 348 13 416 638 357 1 32000 Barley 4946 9 487 282 408 585 49 15 757 601 3 720 8 736 504 1583
4 529 112 749 72 16285 665 2 674 22146 8630 6 351 1053 122000 Oats and mix tures of sum mer cereals (d) 4 201 3 094 479 368 355 50 8 547 140 490 1 243 130 1358 877 32 328 101 4069 962 491 10 805 12239 5 353 99 61000 Grain maize 294 5 080 4 1 1 9
0 3
—
9496 310 1017—
—
—
22 330 563 915—
1277 8 801 112352 1876 58 252000 Other cereals (e) 217 31 0—
0 247 6 357 122 2 260 336 14 89—
823 54 69 4438 18894 1 500 50 93000(a) Excl. rice.
(b) Non-EC countries: average 1966-1968. (c) Non-EC countries: excl. mesiin.
P R O D U C T I O N OF SELECTED A G R I C U L T U R A L C O M M O D I T I E S
Average 1967-1969
1 2 3 4 5 β 16 7 8 9 10 11 12 13 14 15
915
16 17 18 19 20 21 22
C o u n t r y
G e r m a n y (FR) France Italy N e t h e r l a n d s B e l g i u m L u x e m b o u r g
C o m m u n i t y
G r e e c e T u r k e y U n i t e d K i n g d o m N o r w a y S w e d e n D e n m a r k S w i t z e r l a n d A u s t r i a P o r t u g a l
E F T A
F i n l a n d S p a i n U S S R U S A C a n a d a J a p a n
W o r l d
Rice (a) (b)
'000 t
82 599
—
—
—
681 73 183
—
—
—
—
—
150 150
—
294 712 3 368
—
14 422 216 900
P o t a t o e s
(a)
' 0 0 0 t
18 823 9 804 3 981 4 863 1 662 73 39 206 572 1771 6 875 936 1 360 898 1 091 3 1 7 6 1 101 15 437 952 4 454 95157 13 709 2 343 3 692 305 500
S u g a r b e e t
(a)
'000 t
13 422 16 085 11 827 5 067
L 3 981
50 382 755 4 797 6 866
—
1 740 2 239 414 2 083 120 13462 425 4 1 9 7 85154 19 625 973 1 911 233000
Refined s u g a r
(c) '000 t
1831 1815 1 316 628
L 477
6 067 101 674 881
—
214 304 58 293
—
1 750 54 587 8 733 4 484 129 342 59 755
W i n e (d) '000 hi
(à)
5 941 62 561 68 251 (e) 10 (e) 7 123 136 893 3 893 467
—
—
—
873 2 1 7 3 10120 13166
—
27 403 17 663 11 630 300 147 281 107
(a)
(b)
(c)
(d)NonEC countries: average 19661968. Husked rice.
Average of the crop years from 1966/67 to 1968/69; except for the USA average of the calendar years from 1966 to 1968).
I. AGRICULTURE
LIVESTOCK 1968 or 1969
(a) Census every third year. (b) Excl. Portugal.
Table 23
'000
1 2 3 4 5 6 1-0 7 8 9 10 11 12 13 14 15 9-15
16 17 18 19 20 21
Country
Germany (FR) France Italy Netherlands Belgium Luxembourg (a) Community Greece Turkey United Kingdom Norway Sweden Denmark Switzerland Austria Portugal EFTA Finland Spain USSR USA Canada Japan
Date of census
XII-1969 X-1969 XII-1969 XI1-1969 XII-1969 XII-1969
XII-1968 XII-1968 VI-1968 VI-1968 VI-1968 VII-1968 IV-1968 XII-1968 1968
VI-1968 1968 1-1968 1-1968 XII-1968 11-1968
Cattle
Total
14 286 21886 9612 3 879 2713 186 52 562 1094 14165 12151 1008 2 065 3141 1855 2 480 920 23 620 2 071 4000 97 167 109152 11 783 3155
of which cows
5848 9 434 4 510 1 891 1 066 64 22 813 775 4 850 5 203 470 1380 1 292 1087 1 241
(b) 10 673 1 045
41 541 50 049 5 537 1683
Pigs
19 323 10 622 9 224 5 294 3 094 109 47 666 640 14 7 387 610 2043 7 963 1 849 2 932 1660 24444 680 5 662 50 867 55 265 6 060 5 535
Sheep and goats
Table 24
MEAT PRODUCTION (a) (b) 1968
'0001 (carcass weight, excl. offal fat)
1 2 3 4 5 6 1-0 7 8 9 10 11 12 13 14 15 0-15
16 17 18 19 20 21
Country
Germany (FR) France Italy Netherlands Belgium Luxembourg Community Greece Turkey United Kingdom Norway Sweden Denmark Switzerland
Austria (f) Portugal
EFTA Finland Spain USSR USA Canada
Japan (g) Total meat and offal (c)
3 802 4115 1 765 1 080 691 24 11477 277 229(d) 2 692
149 452 1 103 368 548(d) 249 5 561 201 1 185 9 520(d) 22 512
2 045 1085
Beef and veal(d)
1 174 1 553 572 274 201 11 3785 74 101 935(e)
53 157 247 127 195 58 1772 88 242 4 675 9 793 976 176
Mutton lamb and goats (d)
11 113 35 9 2
—
17077 99 251 18 3 3 3 2 30 310 1 132 800 276 9 1
Pigmeat (d)
2119 1 089 428 521 333 10 4 6 0 0 41
—
83761 237 739 189 300 84 2 447 86 419 3 075 5 923 537 590
(a) Gross home production: incl. meat equivalent of animals exported alive but not incl. meat equivalent of animals imported alive.
(b) The Community countries (lines 1-6); without slaughtering fats.
(c) For FAO figures (lines 7-21), edible offal covers only animals slaughtered within the country.
(d) Excl. offal.
(e) Incl. meat equivalent of animals imported for fattening. (f) Incl. slaughter fats.
I. AGRICULTURE
MILK PRODUCTS AND EGGS
1968
Tab!· β
1 2 3 4 5 β 1-0 7 8 9 10 11 12 13 14 15 0-15
10 17 18 19 20 21
Country
Germany (FR) France Italy Netherlands Belgium Luxembourg Community Greece Turkey United Kingdom Norway Sweden Denmark Switzerland Austria Portugal EFTA Finland Spain USSR USA Canada Japan
Milk
22176 31447 10 628 7 710 3 902 215 76 078
1 329 4 451 12 478 1 805 3 308 5122 3 321 3 392 517
29943
3 592 3 723 82 300 53197 8317 4 020
Butter
538 575 68 118 97 7
1 403
7 123 54 24 66 160 38 49 2(b)
393
102 5 1 165
533 156 32(b)
Cheese (a)
437 714 469 250 33 1
1904
125 90 120 46 59 106 86 41 23
481
34 100 460 1 179(b)
106 33(b)
Eggs
809 621 495 228 198 4
2 355
88 88 877 36 101 86 36 83 35
1254
54 296 1 970 4 083 308 1400
Table 20
WOODED AREA A N D TIMBER PRODUCTION 1968
1 2 3 4 9 6 1-6 7 8 9 10 11 12 13 14 15 9-15
16 17 18 19 20 21 22
Country
Germany (FR) France Italy Netherlands Belgium Luxembourg Community Greece Turkey United Kingdom Norway Sweden Denmark Switzerland Austria Portugal EFTA Finland Spain USSR USA Canada Japan World
Wooded area ('000 ha)
(a)
7 207 12 000 6193 270 617 83 26 370 2 512 10 584 1 760 8 990 23 441 399 1 008 3 352 3108 42 058 21 741 26 706 910 009 307101 443 108 25 053 4126 000
Total production
of roundwood
(OOOcu.m)
24 274 32 300 16 071 800 2 565 168 76178 2 676 16160 3 202 6 662 51 200 2100(b) 3 635 11 158 5 900 83 857 42 312 12 787 380 400 337 291 107 572(b)
54 502 2086 000
Production of sawn softwood (OOOcu.m)
7 256 5 214(b)
791 85 325 33 13 704 228 1 632
274 1 619 11 291 460(b) 1 125 4 578 1 450 20 797 5 817 1 400 93 750 71 116 25162 30 940 301 300
Production of sawn hardwood ('OOOcu.m)
1 695 3 123(b) 1 684
255 285 13 7 055 162 485 586 28 257 380(b) 104 200 120 1 675
117 650 16 550 16 426 1 038 8 076 87 600
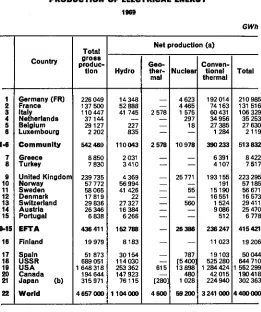
I. ENERGY
Table 27
PRODUCTION OF PRIMARY ENERGY
1969
'000 tec
1 2 3 4 5 6 1-6 7 8 9 10 11 12 13 14 15 9-15
16 17 18 19 20 21 22
Country
Germany (FR) France Italy Netherlands Belgium Luxembourg C o m m u n i t y Greece Turkey
United Kingdom Norway Sweden Denmark Switzerland Austria Portugal E F T A Finland Spain U S S R U S A Canada Japan W o r l d
Coal (a)
112 307 37 537 169 5 456 12 001
—
167 470_
4 680 152 796 391—
—
—
—
360 153 567—
11 580 468 000 504 000 7848 44 652(d) 1 800 000
Lignite
29 656 1 483 716
—
—
—
31 8552189 1 353
_
—
—
363—
1 92012 2 295
—
1 362 85 000 1 485 628 83 (d) 400 000Crude petrol eum
11 262 3 569 2114 2 888
—
—
198355148 143
—
—
—
—
3 861—
4004—
143 470184 729 300 90 900 1 144 3050000Natural gas
10110 7 951 14 298 24 207 74
—
56 642—
2 240—
—
—
—
1 769—
4009—
215 521 689 243 73 570 2 594 (d) 1128 000
Primary elec tricity
(b)
6 170 18 638 14 782 105 84 39 39 820 718 1 204 11 764 20149 14 667 8 9 872 5 851 2 214 64 525 3 061 11 005 42 413 96111 52 481 27 279 420 000
Total primary
energy (c)
170 634 70165 32 550 32 660 12 197 43 318 253 2 907 12 385 166 943 20 540 14 667 371 10161 13 401 2 586 228400 3 061 24 090 1 281 118 2 020139 225 427 75 752 6 798 000
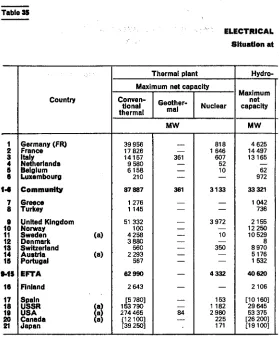
(a) Except for the Community countries, production figures for hard coal are given ton for ton.
Table 28
I N L A N D C O N S U M P T I O N OF PRIMARY ENERGY P R O D U C T S A N D EQUIVALENTS (a)
1969
mio tec
1 2 3 4 5 6 1-0 7 8 9 10 11 12 13 14 15 9-15
16 17 18 19 20 21 22
Country
Germany (FR) France Italy Netherlands Belgium Luxembourg Community Greece Turkey United Kingdom Norway Sweden Denmark Switzerland Austria Portugal EFTA Finland Spain USSR USA Canada Japan World
Coal and lignite
133.8 56.6 13.1 9.5 20.8 3.9 237.6 2.5 7.0 142.5 1.7 3.1 4.3 0.5 6.5 1.1 159.7 3.4 18.4 463.2 454.1 23.4 85.0 [2 300.0]
Crude petrol eum
158.8 115.0 102.8 35.8 31.0 1.9 445.3 7.9 9.7 132.8 9.7 36.9 22.8 16.3 11.3 4.9 234.7 14.1 33.2 846.3 87.9 198.1 [3 050]
Natural gas
13.0 10.5 14.2 15.9 3.2 0 56.8
_
—
7.8
—
—
—
0 3.0—
10.8—
0.1 250.0 753.5 33.8 3.0 1 270Primary elec tricity
(b)
8.3 18.4 15.6 0 0 0.7 42.9 0.7 1.2 12.0 19.7 16.0 - 1.2
9.0 4.6 2.2 62.4 3.1 10.2 41.0 95.6 52.0 27.3 420.0
Total energy
315.0 200.6 146.2 61.1 54.8 6.5 784.2 11.1 17.9 295.1 31.1 56.0 25.9 25.8 25.4 8.2 467.6 20.6 61.9 2 149.5 197.1 313.4
I. ENERGY
Table 29
COAL - LIGNITE 1969
1 2 3 4 5 6 1-0 7 8 9 10 11 12 13 14 15 9-15
16 17 18 19 20 21 22
Country
Germany (FR) France Italy Netherlands Belgium
Luxembourg Community Greece Turkey United Kingdom Norway Sweden Denmark Switzerland Austria Portugal EFTA Finland Spain USSR USA Canada Japan World (i)
Coal
Produc tion '0001
t = t 117035
40 583 303 5 778 13 200
—
176 8994 680 152 796 391
—
—
360 153 567—
11 580 468 000 504 000 7848 44 652 1 800 000Collie ries In opera
tion (a)
69 52 1 7 25
—
154304(f)
—
—
5 327(g) Under ground work
ers on the books (b) '000
141 74 1 10 30
—
256245
—
—
Man/shif yield per under ground
worker
kg 3 837 2 522 2 437 2 927 2 408
—
3 2653 304
—
—
17 600(h) Output
per colliery and day worked
t - t 6 552(d) 3 004(e) 1 261 3 070 1 947
—
4369—
—
LigniteOutput (c)
'0001 108187
2 950 3 248
—
—
—
114 3856 684 4100
—
—
—
1 100—
384040 4980
—
2 724 170 000 4500 1 908252 795 000
(a) At the end of the year. (b) Monthly average. (c) All qualities added t = t.
(d) Excl. a certain number of small collieries. (e) "Charbonnages de France" only. (f) National Coal Board.
(g) Incl. lignite mines and anthracite mines (1968). (h) Excl. anthracite mines (1968).
Table 30
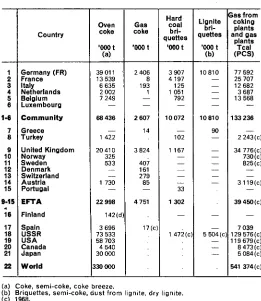
PRODUCTION OF SECONDARY FUELS FROM SOLID FUELS J 969
1 2 3 4 5 6 1-6 7 8 9 10 11 12 13 14 15 9-15
16 17 18 19 20 21 22
Country
Germany (FR) France Italy Netherlands Belgium Luxembourg Community Greece Turkey United Kingdom Norway Sweden Denmark Switzerland Austria Portugal EFTA Finland Spain USSR USA Canada Japan World
Oven coke
'0001 (a)
39 011 13 539 6 635 2 002 7 249
—
68 4361 422 20 410 325 533
—
1 730—
22 998142(d) 3 696 73 533 58 703 4 540 30 000 330 000
Gas coke
'0001
2 406 8 193 1
—
—
2 60714
3 824 407 161 279 85
—
4 75117(c) Hard
coal bri quettes
'0001
3 907 4 197 125 1 051 792
—
10 072102 1 167
—
—
—
—
331 302
—
1 472(c) Lignite
bri quettes
'0001 (b)
10810
—
—
—
—
—
1081090
—
—
—
—
—
—
—
5 504(c)
—
—
—
Gas from coking
plants and gas
plants Teal (PCS)
77 592 25 707 12 682 3 687 13 568
—-133 236
2 243(c) 34 776(c) 730(c) 825(c)
—
—
3119(c)—
39 450(c)—
7 039 129 576(c) 119 679(c) 8 473(c) 5 084(c) 541 374(c)(a) Coke, semi-coke, coke breeze.
(b) Briquettes, semi-coke, dust from lignite, dry lignite. (c) 1968.