1: Corresponding author e-mail: m.tiryakioglu@unf.edu Tel: 904-620-1390
Hardness-Strength Relationships in the Aluminum Alloy 7010
M. Tiryakioğlu1,1, J.S. Robinson2, M.A. Salazar-Guapuriche3, Y.Y. Zhao4, P.D. Eason1
1School of Engineering, University of North Florida, Jacksonville, FL 32224, USA
2Department of Mechanical, Aeronautical and Biomedical Engineering, University of Limerick
Limerick, Ireland
3Materials Laboratory, Airbus UK, Broughton, Chester CH4 0DR, UK
4School of Engineering, The University of Liverpool, Liverpool L69 3GH, UK
Abstract
The relationship between Vickers hardness, yield stress and tensile strength were analyzed by combining data from two independent studies involving 7010 alloy plate and a rectilinear forging. The hardness-yield stress data from the two studies overlapped, suggesting a possible fundamental relationship. Constraint factors calculated by using contact mechanics models were evaluated and the one found by Shaw and DeSalvo was found to agree with the slope for the hardness-yield stress data. The y-intercept of the hardness-yield stress relationship was explained by the work hardening taking place during Vickers testing. The equation found to fit the hardness-yield stress data for 7010 plate and forgings also provided a very respectable fit to a third independent study. Moreover, an empirical equation was developed to express the hardness-tensile strength relationship.
Introduction
Wrought Al-Zn-Mg-Cu alloys are used extensively in aerospace applications due to their high strength-to-density ratio (specific strength). Heat treatment of these alloys involves a solution treatment, subsequent quenching, and finally artificial aging that may involve several stages depending on the desired temper. Aluminum alloy 7010 was developed for applications requiring high strength, high fracture toughness, exfoliation resistance and stress corrosion cracking resistance in thick sections [].
Quality assurance practices in the aerospace industry usually require tensile tests be conducted on specimens excised from the aluminum parts []. Although this practice yields reliable results, excising the tensile coupons not only is time consuming, but also in some applications, leads to the destruction of the part. Therefore, nondestructive methods to estimate the tensile properties, especially yield stress (σY) and tensile strength (ST), have been of interest
to process engineers. One of the most common techniques to estimate yield stress and tensile strength has been hardness testing because of its nondestructive (or semi-destructive) nature, leaving behind only an indentation. Moreover, mechanical data can be gathered quickly without the need for excising samples for testing.
Brinell and Rockwell are among the hardness tests most commonly used in industry. Brinell and most scales in Rockwell use spherical indenters, which yield geometrically dissimilar indentations []. Vickers hardness tests use pyramidal indenters, which result in geometrically similar indentations [3]. There have been numerous studies on the geometrical aspects of spherical [3,,,,] and Vickers [,,] indentations. In addition, there has been a strong interest in estimating tensile properties from hardness tests. These efforts can be categorized in three groups:
1. estimating σYand STdirectly from the correlation with hardness [,,,]
2. taking multiple hardness measurements at different loads, calculating mean pressure values and coefficients in given equations which can then be used to estimate σY and
ST[11,,]
The present study follows the first method, building on the contact mechanics principles established in the literature. Data from two independent studies, one conducted on a 7010 forging [] with different quench paths but the same aging treatment, the other [13,] on 7010 plate with the same quench path but different aging treatments, are combined in the analysis.
Background
The mean pressure under the indenter, Pm, alternatively referred to as the Meyer hardness [], is
found by dividing the load, L, by the projected area of indentation, Ai;
(1)
The flow stress under the indenter, σf, is related to mean pressure;
(2)
where C is the constraint factor. Hill et al. [] developed a solution for the stress distribution under a wedge indenter and showed that the pressure normal to the surface of the indenter tip can be found as;
(3)
where τcis the critical maximum shear stress and θ is an angle in the geometric model developed
by Hill et al. that is a function of the half angle of the nose of the wedge. For a flat punch, θ=π/2. For Vickers indentation, Tabor [3] assumed that the model for a flat punch would be a good approximation. Tabor also used the Huber-Mises criterion, such that;
2τc= 1.15 σY (4)
Combining Equations 3 and 4 and taking θ=π/2, we obtain
(5)
Therefore,
(5.a)
2In this study, Vickers hardness is reported in MPa, which is found by multiplying the traditional Vickers number by the gravitational acceleration.
2.8 and 2.8, respectively. Since Tabor’s statement that C ≈ 3, many researchers assumed the mean pressure under an indenter to be three times the tensile yield strength of the metal.
In calculating Vickers hardness, HV2, load is divided by the contact area of indentation,
not the projected area. Therefore, HVand Pmare related by:
(6) Equations 5.a and 6 can be combined to obtain
(7)
Taking C=2.956, HV (MPa) versus σY (MPa) plots can be expected to have a slope of 0.365
(3.580 when HV is given in kg/mm2) and the best fit lines should go through the origin.
However, research on steels [,,,,], magnesium [], aluminum [13,], showed that the relationship between Vickers hardness and tensile yield stress is better expressed in the form
(8)
In steels, the slope in Equation 8, β1, was found [25] to change between 0.268 and 0.390. In all
studies, the y-intercept, β0, was found to be negative. To the authors’ knowledge, the consistent
presence of a y-intercept that is different from zero has not been fully addressed in the literature. That is why some researchers [25,28] have chosen to report their findings in terms of ΔσY/ΔHV
(β1).
Estimating tensile strength from hardness data has been mostly empirical in nature because the phenomenon of tensile instability after which engineering stress decreases with increased engineering strain does not occur during indentation. Based on data published in the literature, Zhang et al. [] made the observation that for most carbon and alloy steels with different thermal treatments, ST is approximately HV/3, which if plotted against one another
respectively would produce a slope of 0.333. This slope is similar to the one found (0.312) by Arptin and Murphy [] for metals with E ≈ 70 GPa, such as aluminum.
Although estimating σY and ST directly from the correlation with hardness has been
best-fit equations to experimental data has not been addressed in detail. This study is intended to fill this gap in the literature.
Experimental Details
A rectilinear open die forging of 7010 alloy was manufactured by HDA Forgings Ltd (now Mettis Aerospace, Ltd), Redditch, UK on a 20 MN draw down hydraulic press. The forging temperature was in the range 390 – 400°C. This forging was similar to a production item that receives extensive machining and ultimately forms part of the wing spar assembly in the Airbus A330/A340. The rectilinear forging had dimensions of 3045 mm (L, longitudinal) × 158 mm (LT, long transverse) × 125 mm (ST, short transverse). The chemical composition of the forging is given in Table 1. Tensile specimens with 6 mm diameter and 30 mm gage length were excised from the forging. The long axis of the specimens corresponded to the L direction of the forging. Specimens were solution treated in an air-recirculating furnace at 475oC for 50 minutes.
Solution treatment was followed by 32 different quench paths, both interrupted and delayed quench [] to obtain a wide interval of yield strength and hardness values. Quenches were interrupted at seven temperatures for various durations by inserting specimens into a salt bath filled with a eutectic mixture of KNO3 and NaNO2. In delayed quench experiments, specimens
were initially cooled in still air until the target temperatures (400, 350, 300, 250, 200oC) were
reached, and subsequently quenched in cold water. For each interrupted and delayed quench path, two tensile specimens were used. In addition, two specimens were quenched directly in cold water from the solution treatment temperature. Specimens were then naturally aged at room temperature for 5 days. Subsequently they were artificially aged at two stages, 120ºC for 10 hours followed by 173ºC for 8 hours, to attain the overaged condition.
Tensile and Vickers hardness tests were conducted on each specimen. A Zwick tensile tester was used at an engineering strain rate of 0.001/s and σY and ST values were recorded. A
total of sixty five tensile tests were conducted. Three Vickers hardness tests at 20 kg load were conducted on an Instron Wolpert 930 Tester machine. At least three indentations were made on each specimen and their average was taken as the representative hardness value.
perpendicular to the rolling direction. Each slice was further cut into five strips of equal width, each representing a different depth through the plate thickness. Flat tensile test specimens were manufactured from the strips to the dimensional requirements of British Standard BS 4A-4. They had a gauge length of 50 mm, a minimum parallel length of 63 mm, a minimum transition radius of 25 mm, a width of 12.5 mm and a thickness of 3 mm. The tensile test specimens were solution treated at 475ºC for 50 minutes in a Caltherm air circulating furnace, quenched in water (~ 22ºC) at a quenching rate of about 95ºC/s, and then chilled to -18ºC for subsequent treatments. Three different aging treatments were employed:
1. natural aging for different durations between 15 minutes to 386 hours (W-temper); 2. natural aging for 16 days, artificial aging at 120ºC for 10 hours followed by 172ºC for
different durations ranging from 10 minutes to 8 hours;
3. natural aging for 16 days, artificial aging at 120ºC for 10 hours followed by 172ºC and overaging at 172ºC for different durations ranging from 1 hour to 100 hours. The experimental matrix allowed a wide range of temper conditions to be obtained by varying the duration of natural aging, artificial aging and overaging. The hardness measurements of the specimens were performed on a surface polished to approximately 1.5 μm prior to the tensile tests. The hardness was measured by a Vickers HTM8313 hardness tester with a 5 kg load. The tensile tests were carried out using an Avery Denison testing machine, Model 6157, with a load capacity of 100 KN, according to British Standard B.S. EN 10002-1.
Results and Discussion
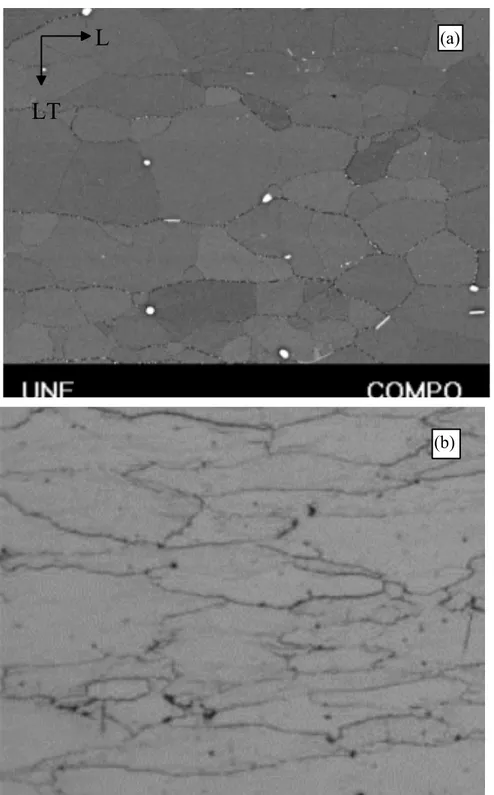
7010 is insensitive to Hall-Petch effects over this grain size range, just like in other aluminum alloys [].
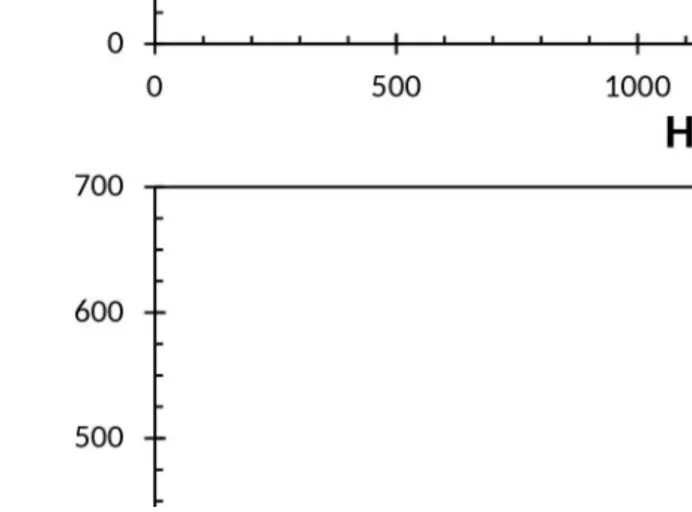
The HV- σY relationship for both datasets is presented in Figure 2. Note that the two
datasets overlap each other almost completely. Because the variation in properties were obtained by different quench paths and by different aging treatments for the forging and plate specimens, respectively, the overlap in Figure 2 may not be coincidental and requires further theoretical analysis.
The estimated coefficients, β1and β0, for the best fit line are provided in Table 2. Note
that the slope of 0.365 expected from Tabor’s analysis is not within the 95% confidence interval for β1. Therefore the common assumption that ΔPm/ΔσY= 3 is not valid for 7010.
Shaw and DeSalvo [], in their analysis for a blunt axisymmetric indenter, found that the constraint factor, C, is 2.82. This value is very similar to the one found by Shield [] (C = 2.84) for a round punch pushing against a deforming metal. Moreover, C = 2.82 is essentially the same as the constraint factors that Tabor [23] reported for copper and mild steel. Larsson [] reported C = 2.80 in his study of Vickers hardness test by finite element modeling. Inserting C=2.82 into Equation 7, the slope (ΔσY/ΔHV) is calculated as 0.383 (3.752 when HV is in
kg/mm2). This slope is very close to the one obtained by linear regression and is within the 95%
confidence interval given in Table 2. Hence, the fit was recalculated by holding the slope constant at 0.383;
(8.a) The coefficient of determination, R2, for Equation 8.a is 0.957 which is almost identical to the R2
obtained by linear regression given in Table 2. The line in Figure 2 is drawn by using Equation 8.a. If the line obtained by regression were drawn in Figure 2, it would almost completely overlap the line obtained by Equation 8.a. Therefore, it is recommended that ΔσY/ΔHV be taken
as 0.383 for 7010.
To check for further consistency, the data from a third independent quench sensitivity study by Flynn [,] for a 7010 aluminum alloy forging were used and fitted with Equation 8.a. The results are presented in Figure 3. Despite more scatter in this dataset, it is remarkable that the same equation provided such a respectable fit to Flynn’s data, with R2= 0.874.
Table 2 shows the 95% confidence interval for the y-intercept, β0. Because zero is not
the origin, a result consistent with previous studies. It should be mentioned that Vickers hardness test is designed to generate a constant characteristics strain under the indenter. This characteristic strain was stated as 8% by Tabor [3] and 7% by Johnson []. In fully work-hardened materials, stress increases elastically to yield stress after which it remains constant despite increasing strain (full plasticity). In many early studies on the hardness of metals, the materials were specifically chosen to be fully work-hardened, ensuring that flow stress was equal to yield stress so that stress calculations always resulted in an estimate of the yield stress. In metals that are not yet fully work hardened, the effect of work hardening that occurs during indentation must be accounted for. The calculation of stress under the indenter leads to the estimate of the flow stress at the corresponding strain. Hence, Equation 7 can be written in a more generalized form;
(7.a)
Consequently, in a Vickers hardness test on a metal that has not fully work-hardened, σf ≥ σY.
The stress generated under the Vickers indenter in a work-hardening metal can be represented as: (9)
where Δσ is the increase in stress due to work hardening during deformation to 8% characteristic strain. Obviously, for fully work-hardened metals, Δσ = 0. After inserting Equation 9 into Equation 7 and rearranging, we obtain;
(10)
Equation 10 helps explain why the y-intercept is consistently negative in previous studies for materials that work-harden during plastic deformation. Moreover, Equation 10 is consistent with the model suggested by Larsson [38]. Further research is needed to investigate the effect of work hardening on Vickers-hardness-yield stress relationship among other structural and process variables.
Turning the attention to tensile strength, the relationship between Vickers hardness and tensile strength is presented in Figure 4. Again, the results from two studies overlap significantly. In Figure 4, the best fit line has the following equation:
The coefficient of determination is quite respectable (R2 = 0.954). The line for yield stress is
also included in Figure 4 for reference. The confidence intervals for the slope and the intercept for Equation 1 are presented in Table 2.
The value of β1 = 0.247 (2.423 when HV is in kg/mm2) is significantly different from
0.333 observed in steels, indicating a clear behavioral distinction between steels and the 7010 alloys in this study. However, it is unclear why the value of the slope found in this study is significantly different from the one reported by Arbtin and Murphy [32] for alloys with a modulus of elasticity similar to that of 7010. Additionally, zero is not within the 95% confidence interval for β0, indicating a positive y-intercept. Because of the empirical nature of the HV-ST
relationship, no further analysis has been conducted at this time.
Conclusions
1. The Vickers hardness-yield stress relationship in 7010 has been developed from two independent datasets:
The slope of 0.383 is linked to contact mechanics principles reported in the literature. Specifically, the constraint factor of 2.82 was used in deriving the slope.
2. The negative y-intercept found in this study has been consistently reported in the literature. The reason for the negative intercept can be explained by the increase in stress under the indenter due to work hardening until it reaches the characteristic strain in Vickers hardness testing. While the model proposed is consistent with the analytical solution of Larsson, a phenomenological study is planned to investigate the effect of work hardening among other structural and process variables.
3. That data from two independent studies using the aluminum alloy 7010 overlapped is quite significant and indicates a fundamental relationship between hardness and strength. The same fit to both datasets also provided a very respectable fit to a third independent study. 4. An empirical relationship between tensile strength and Vickers hardness was also developed:
Table 1. Chemical Composition (in wt.%) of 7010 alloys used in this study.
Si Fe Cu Mg Zn Zr Al
Forging 0.03 0.06 1.69 2.44 6.26 0.14 Balance
Plate 0.04 0.05 1.75 2.34 6.30 0.12 Balance
Table 2. Results of linear regression analyses.
β1 β0(MPa)
estimate lower95% upper estimate95% lower95% upper95% R2
σY (MPa) 0.391 0.376 0.406 -195.7 -218.6 -172.7 0.958
12 (a)

![Figure 3.Vickers hardness versus yield stress relationship drawn from the data of Flynn [39,40]](https://thumb-us.123doks.com/thumbv2/123dok_us/8047955.222704/14.918.114.801.116.617/figure-vickers-hardness-versus-yield-stress-relationship-flynn.webp)