International Conference on the Technology of Plasticity, ICTP 2017, 17-22 September 2017,
Cambridge, United Kingdom
Modelling and experimentation of the evolution of texture in an
Al-Mg alloy during earing cupping test
Saeed Tamimi
a*, Giribaskar Sivaswamy
a, Ioannis Violatos
a, Shanmukha Moturu
a,
Salah Rahimi
aand Paul Blackwell
aba Advanced Forming Research Centre (AFRC), University of Strathclyde, 85 Inchinnan Dr, Inchinnan, Renfrew PA4 9LJ, UK b Design Manufacture & Engineering Management (DMEM), University of Strathclyde, 75 Montrose St, Glasgow G1 1XJ, UK
Abstract
Earing and thinning are often the major manufacturing problems occur during deep drawing processes. Thinning occurs when a section of a part undergoes localised deformation, and earing is the formation of wavy edges at the open end of a drawn part that must be trimmed at final stage leading to higher manufacturing costs. The anisotropic mechanical behavior of the initial sheet metal is the predominant source of thinning and earing problems. This work aims to establish a relationship between the properties of a sheet blank and thinning and earing issues during deep drawing by studying the evolution of crystallographic texture throughout the sheet forming process using crystal plasticity simulation modelling and experimental measurements.
Firstly, to understand the impact of individual texture components on the mechanical properties of the material, Lankford coefficients for FCC crystal structure during uni-axial tensile loading were analysed using Visco-Plastic Self Consistent (VPSC) model. Subsequently, Finite Element (FE) analyses were carried out to study the effect of initial state of the material on earing and thinning issues occurred during deep drawing. It was observed that the existing Cube and Goss texture components evolved during annealing heat treatments were responsible for the generation of troughs along 45° to the rolling direction (RD) and peaks along the transverse direction (TD), respectively. Optical 3D scanning of a manufactured part confirmed that earing is less prominent in the case of as-rolled and shear-formed condition due to weakening of Cube and Goss texture components. Furthermore, a combination of FE simulation and the VPSC model has been used to simulate texture evolution during a standard earing cupping test at various points of interest. The results of texture evolution simulations were compared to those measured experimentally by electron backscatter diffraction (EBSD), and a good qualitative agreement is achieved.
© 2017 The Authors. Published by Elsevier Ltd.
Peer-review under responsibility of
the scientific committee of the International Conference on the Technology
of Plasticity
.Keywords: earing cupping test; crystallographic texture; crystla plasticity; FE simulation
1.Anisotropy of texture components
Generally, with a view to meet the environmental and economic concerns, manufacturers need to design lighter, safer and more complex shaped products. In recent years, aluminum alloys have received attentions of many researchers as promising structural materials for various applications due to their high strength to weight ratio and excellent corrosion resistance. However, their formability during sheet metal forming processes such as deep drawing is noticed to be inferior to sheets of steels of different grades. Overall, the deep-drawability of sheet metals is strongly related to their forming anisotropy which is defined as R-value or Lankford coefficients as written in equation 1. 𝑅 =𝜀𝑤
𝜀𝑡 (1)
where, 𝜀𝑤 and 𝜀𝑡 are true plastic strains along the width and through the thickness directions of a tensile test sample,
respectively. Usually, the R-value of sheet metals varies along different directions with respect to the RD due to differences in the microstructure and crystallographic texture characters distributions. Hence, two parameters of the normal anisotropy (𝑅 ) and the planar anisotropy (∆𝑅 ) are defined to represent plastic anisotropy of sheet metals as shown in equations 2 and 3 [1]:
R =R0+2R45+R90
4 (2)
and
∆R =R0−2R45+R90
2 (3)
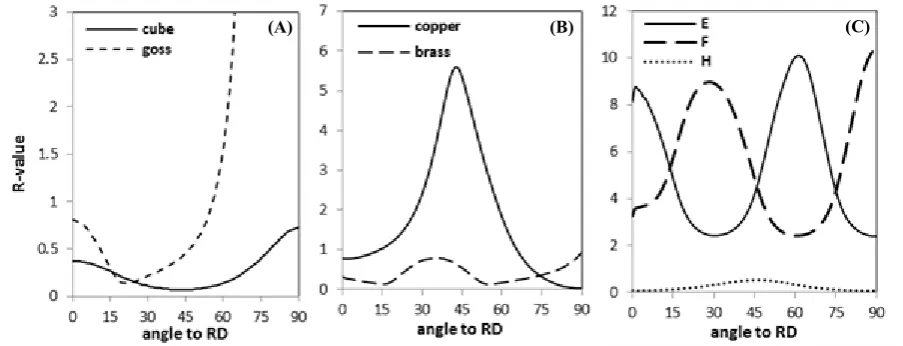
Where R0 , R45 and R90 are the R-values for sample orientations at 0°, 45° and 90˚ from the RD, respectively. The normal and planar anisotropies are of great importance for a deep drawing process, especially to control the two prominent modes of failures namely earing and thinning. These are closely related to crystallographic orientations of the constituting grains of the sheet metal [2]. Figure 1 shows the variation of R-value as a function of sample orientation with respect to the RD for a sheet metal having FCC crystal structure with different dominant typical texture component, analysed by VPSC. It is shown that recrystallization texture (i.e. cube {001}<100> and Goss {110}<001> components) possesses low values of normal anisotropy compared to rolling texture (i.e. copper {112}<111> and brass {110}<112> texture components). Similarly, the presence of E {111}<110> and F {111}<112> shear texture components led to higher normal anisotropy, while H {001}<110> component, known as rotated cube, has insignificant influence on R-values along different directions. E and F shear texture components belongs to the {111}//ND fiber which can be developed during shear plastic deformation.
Figure 1c indicates that {111}//ND fiber can enhance formability of material. This is the reason why annealed low carbon steels possess high formability, since annealing heat treatment leads to the development of {111}//ND in this material [3]. However, improvement of the formability in aluminum sheets using heat treatment is challenging, since the cube and Goss are the dominant texture components developed during recrystallisation [4]. There are a number of investigations reported on the improvement of formability of recrystallised materials, by inducing desired texture components during plastic deformation. Aiming at texture randomisation of recrystallised Al-Mg alloy, Huh et al. have modified the rolling texture using an additional step of cross-rolling during the forming process [5]. It was also shown that shear texture produced by asymmetric rolling could solve the thinning problem in deep drawing of Al-Mg, however, the earing problem was more pronounced [6].
2.Earing cupping test
The 1.2mm thick AA-5083 sheet used for earing cupping test had rolling textures. Recrystallisation and shear texture components were developed by subjecting the same as received material to annealing treatment and Miyauchi in-plane shear test. For further information on Miyauchi in-plane shear to generate shear texture components, the readers are referred to Miyauchi’s work [7]. The R-values for these materials are listed in Table 1.
Table 1. R-values for the materials with different texture components along 0˚, 45˚ and 90˚ from the RD
Texture type 0RD 45RD 90RD ∆𝑅 𝑅
Recrystallisation texture 0.56 0.35 1.1 0.48 0.59
Rolling texture 0.64 0.8 0.57 0.19 0.70
Shear texture 0.96 1.12 0.70 0.28 0.98
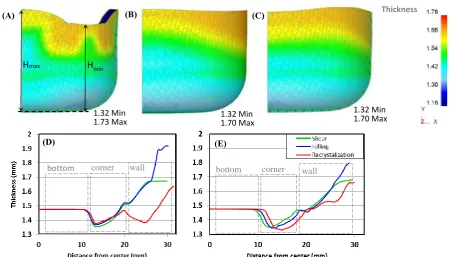
in-planed sheared) as presented in Table 1. For these FE simulations, similar boundary conditions as those of standard earing cupping test are implemented in DEFORM (Ver11.1) by considering 4 layers of brick elements for meshing and a constant clamping force of 500N. Additionally, the Coulomb friction condition with the constant of 0.01 friction was applied for the friction between the tool and the part. The simulated drawn cups for three different material inputs are shown in Figure 2. In this figure, X and Z directions represent the initial sample orientations of 0° and 90° to the RD, respectively. The earing feature is more pronounced in the cup drawn from the recrystallised sheet compared to the cups drawn from the rolled and sheared materials. The troughs are more pronounced along 45˚ from the RD whereas the peaks appear along the RD and the TD.
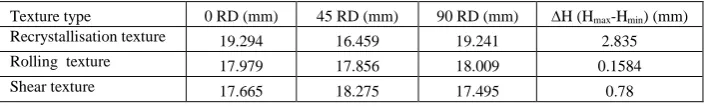
The results of FE simulations presented in Figure 2a-c confirmed the influence of anisotropy on the development of earing during earing cupping tests. The height of each drawn cups along various directions are presented in Table 2 where ∆H is the difference between the highest peak (Hmax) and the lowest valley (Hmin) shown in Figure 2a. Higher
[image:3.544.74.430.254.307.2]value of ∆H for recrystallisation condition is mainly due to the higher planar anisotropy⁰ (see Table 1). This indicates that the materials exhibited peaks in the final drawn cup along the directions with the higher R-values.
Table 2. Summary of earing characteristics simulated by FE using different initial material conditions
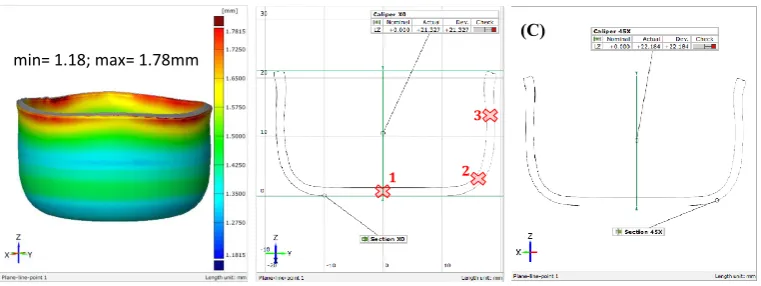
FE results also confirmed that there is a difference in the sheet thickness along different directions with respect to the RD. Figure 2d and e shows the variations in the thickness from the sections made along 0° and 45° to the RD, respectively. Cup drawn from the sheet subjected to recrystallisation treatment had undergone predominant thinning compared to the cups drawn from the sheets dominant shear and rolling texture components. This could be due to low normal anisotropy value for the recrystallised sheet compared to those of the rolled and sheared sheets. To validate the results of FE simulations, following the earing cupping tests, the deep drawn cups were scanned in 3D using GOM® Atos system followed by thickness analyses (see Figure 3). The highest difference between the peaks and troughs in this sample is 0.14mm. This is in agreement with the results of simulation presented in Figure 2b. However, a discrepancy is observed between the thicknesses measured by GOM at different locations of the cup and those simulated by FE.
The results of FE simulation show that the sheet thickness of the wall starts thinning from top to bottom of the cup, while the experimentally measured thickness by GOM shows a band of thin region in the middle of the wall. This might be due to a non-uniform friction coefficient exists during earing cupping test while the friction condition have been considered as uniform and remains the same throughout the simulation. A comparison between Figures 1, 2 and 3 indicates that the dominance of Cube and Goss texture components during recrystallisation treatment could be the main reason of earing problem. Rolling and shear texture components, especially copper component in as-rolled and E/F components in shear deformed samples, can prevent thinning problems during drawing.
3.Texture evolution
In order to study the evolution of texture at different points of interest in the drawn cups, a VPSC crystal plasticity based model is used by taking the initial materials’ texture information and applying the mechanical boundary conditions obtained from the results of FE simulations. The VPSC model has initially been proposed by Molinari et al. [8] which was further developed by Lebensohn and Tome [9]. It is assumed that plastic deformation occurs by crystallographic slips on {111}〈1 1 0〉 slip systems. In addition, strain hardening over plastic deformation regime can be described by a Voce-type law which is characterised by an evolution of the threshold resolved shear stress as a function of accumulated shear strain in each grain (equation 4) [10].
τ = τ0+ (τ1+ θ1Г)(1 − exp −Г
θ0
τ1
)
(4)
Texture type 0 RD (mm) 45 RD (mm) 90 RD (mm) ∆H (Hmax-Hmin) (mm)
Recrystallisation texture 19.294 16.459 19.241 2.835
Rolling texture 17.979 17.856 18.009 0.1584
where Г and τ
are accumulated shear strain and threshold resolved shear stress, respectively. Additionally, the
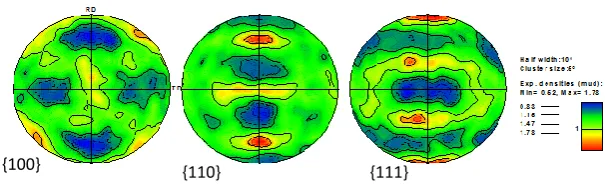
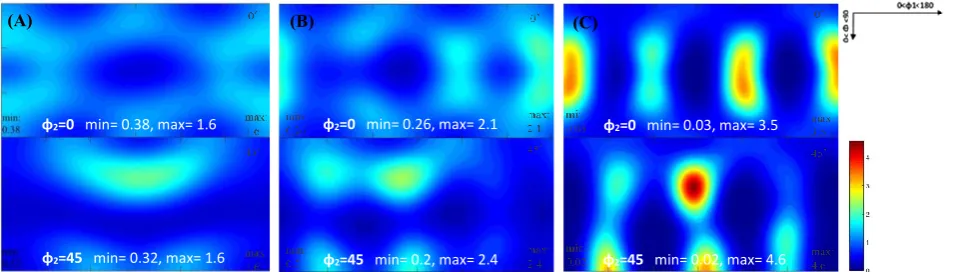
material constants of 𝜃0, 𝜃1, τ1 and(τ0+ τ1)are the initial critical resolved shear stress (CRSS), initial strain hardening rate, asymptotic hardening rate and back-extrapolated CRSS, respectively. These material constants, which are obtained by a good fit to tensile stress-strain curve along the RD, are 455, 22, 55 and 127MPa, respectively. Figure 4 shows the polefigures obtained EBSD for the rolled sample which is used as an initial texture input file for the VPSC model. The copper and brass are the predominant texture components with the maximum intensity of 1.78 in this sample.As shown in Figure 3b, three points of interest have been chosen based on their strain states and magnitudes during deep-drawing operation including one on the cup wall, one at the corner and one at the bottom of drawn cup. The predicted texture of these points after earing cupping test is presented in Figure 5.
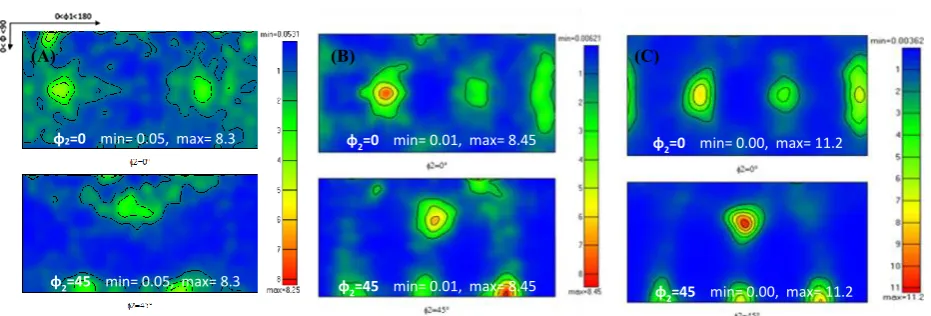
At point 1, since the applied strain is near zero and also no friction exists, the final texture is predicted with no significant changes from the initial rolling texture. However, points 2 experiences both bending and friction, and point 3 on the wall experiences a plane strain state with no significant friction condition. As a consequence, the rolling component rotated slightly, but the copper component became stronger in particular at the point 3 (i.e. wall) as shown in Figure 5. This might be due to the same direction of plane strain stretching with the direction of plane strain rolling of the initial sheet. In order to compare the simulated and experimental results, an EBSD observation have been carried out to measure texture at the same points as those indicated in see Figure 3 and presented in Figure 6. It can be seen that the measured textures and the simulated texture are in a good agreement qualitatively, at the points of interest despite of a significant difference in the intensities.
4.Conclusions
In this study, the influence of initial Al-Mg alloy sheet states on earing and thinning issues during deep drawing operations are explored by both modelling and experimentations. The major observations of this work are concluded as follows:
The rolling and shear texture components in the sheet metal prior to forming can reduce the earing problem in aluminum sheets during deep drawing.
Crystal plasticity based VPSC modelling taking the results of FE simulations as boundary conditions is employed to predict texture evolution during deep drawing. The changes in texture at the bottom of drawn cup is not significant however, texture at the wall and the corner of the cup are changed. The results showed that the simulated textures at the selected locations are in a good qualitative agreement with the experimentally measured texture.
References
[1] W.F.Hosford, R.M.Caddell; Metal forming-Mechanics and Metallurgy; Cambridge University Press, ISBN 13 978-0-521-88121-0.
[2] H.Inoue, T.Takasugi; Texture control for improving deep drawability in rolled and annealed aluminum alloy sheets; Mater.Trans. 48 (2007) 2014-2022.
[3] Y.Yazawa, Y.Ozaki, Y.Kato and O.Furukimi; Development of ferritic stainless steel sheets with excellent deep drawability by {111} recrystallization texture control; JSAE review, 24 4 (2003) 483-488.
[4] W.C.Liu, Z.Lib, C.S.Man, D.Raabe, J.G.Morris; Effect of precipitation on rolling texture evolution in continuous cast AA 3105 aluminum alloy; Mater. Sci. Eng. A, 434 (2006) 105–113.
[5] M.Y.Huh, S.Y.Cho, O.Engler; Randomization of the annealing texture in aluminium 5182 sheet by cross-rolling; Mater. Sci. Eng. A, 315 (2001) 35–46.
[6] S.Tamimi, J.Correia, A.Lopes, S.Ahzi , F.Barlat, J.Gracio; Asymmetric rolling of thin AA-5182 sheets: Modelling and experiments; Mater. Sci. Eng. A, 603 (2014) 150–159.
[7] K. Miyauchi; A proposal for a planar simple shear test in sheet metals; Sci. Pap. Inst. Phys. Chem. Res.(Jpn). 78 3 (1984) 27-40.
[8] A.Molinari, G.R.Canova, S.Ahzi; A self consistent approach of the large deformation polycrystal viscoplasticity; Acta Mater. 35 (1987) 2983-2994.
[9] R.A. Lebensohn, C.N.Tome, A self-consistent anisotropic approach for the simulation of plastic deformation and texture development of polycrystals: Application to zirconium alloys, ActaMetall.Mater, 41(1993) 2611-2624.
(A) (B) (C)
(A) (B) (C)
1.32 Min
1.73 Max 1.32 Min1.70 Max
1.32 Min 1.70 Max
Thickness
Hmax Hmin
(D)
bottom
(E)
wall
[image:6.544.48.503.64.321.2]corner bottom corner wall
(A) (B)
1
3
2
(C) min= 1.18; max= 1.78mm
[image:7.544.72.453.80.223.2]Min= 0.52 Max= 1.78
Figure 4. Plots of polfigures obtained by EBSD for the as rolled sheet {110}
φ2=0 min= 0.38, max= 1.6
(B) (C)
φ2=0 min= 0.26, max= 2.1 φ2=0 min= 0.03, max= 3.5
φ2=45 min= 0.2, max= 2.4
φ2=45 min= 0.32, max= 1.6 φ2=45 min= 0.02, max= 4.6
[image:9.544.45.524.79.215.2](A)
b)
c)
a)
φ2=0 min= 0.05, max= 8.3
φ2=45 min= 0.00, max= 11.2
φ2=0 min= 0.00, max= 11.2
φ2=45 min= 0.01, max= 8.45
φ2=0 min= 0.01, max= 8.45
φ2=45 min= 0.05, max= 8.3
[image:10.544.43.509.45.203.2](A) (B) (C)