City, University of London Institutional Repository
Citation:
Tyler, C.W. (2015). Peripheral Color Demo. i-Perception, 6(6), doi:
10.1177/2041669515613671
This is the published version of the paper.
This version of the publication may differ from the final published
version.
Permanent repository link:
http://openaccess.city.ac.uk/14792/
Link to published version:
http://dx.doi.org/10.1177/2041669515613671
Copyright and reuse: City Research Online aims to make research
outputs of City, University of London available to a wider audience.
Copyright and Moral Rights remain with the author(s) and/or copyright
holders. URLs from City Research Online may be freely distributed and
linked to.
City Research Online:
http://openaccess.city.ac.uk/
[email protected]
Short and Sweet
Peripheral Color Demo
Christopher W Tyler
Division of Optometry and Vision Science, City University, London, UK Smith-Kettlewell Eye Research Institute, San Francisco, Ca, USA
Abstract
A set of structured demonstrations of the vividness of peripheral color vision is provided by arrays of multicolored disks scaled with eccentricity. These demonstrations are designed to correct the widespread misconception that peripheral color vision is weak or nonexistent.
Keywords
Periphery, color vision, eccentricity, cone distribution, fovea
There is a widespread misconception even among vision scientists, and hence the population in general, that the high cone density in the fovea implies that color vision is restricted to the central vision, and conversely that the high density of rods in the periphery implies a lack of color vision in the periphery. For example, the Wikipedia article on peripheral vision says
Peripheral vision is weak in humans, especially at distinguishing colour and shape. . .rod cells are unable to distinguish colour and are predominant at the periphery, while cone cells are concentrated mostly in the centre of the retina, the fovea. (https://en.wikipedia.org/wiki/ Peripheral_vision)
In fact, however, both historical (Østerberg, 1935) and more recent (Curcio, Sloan, Packer, Hendrickson, Kalina, 1987; Song, Chui, Zhong, Elsner, & Burns, 2011) measurements of photoreceptor densities indicate otherwise. Despite the high concentration of cones in the fovea, even the central 5 of the retina contains only about 50,000 cones (1% of the total), while the remainder of the total population of about 5 million cones is distributed throughout the peripheral retina with an average density of about 5,000 cones/mm2(beyond about 10 eccentricity). Since the cone inner segments act as their light-catching apertures, and since their diameter is about 10 mm in peripheral retina (Jonas, Schneider & Naumann, 1992), this density implies that the light-catching area of the cones is about 0.3 mm2 per mm2 of peripheral retina, while the rod light-catching area accounts for most of the rest. Thus, about one third of the peripheral retina should be considered to support color vision (Williams, 1991).
The mapping from retina to cortex can be approximated as a linear scaling from the fovea to the periphery, particularly for the cortical mappings of V2 and V3 (Schira, Tyler,
Corresponding author:
Christopher W Tyler, City University London, Northampton Square, London EC1V 0HB, UK. Email: [email protected]
i-Perception
2015, 6(6) 1–5
!The Author(s) 2015
DOI: 10.1177/2041669515613671 ipe.sagepub.com
Breakspear, & Spehar, 2009). To project from the retina to equal regions of early visual cortex, therefore, the stimuli should be scaled in proportion to eccentricity, and studies of peripheral color processing should use such scaling in order to assess the cortical capabilities of color processing. Indeed, with suitable areal scaling, color discrimination can be equated at all eccentricities This is not the place for an extensive review, but it should be noted that many studies of peripheral processing have used constant stimulus size and report progressive declines in hue discrimination (Nagy & Wolf, 1993; McKeefry, Murray & Parry, 2007; Mullen, 1991), chromatic saturation (Stabell & Stabell, 1982; Abramov, Gordon & Chan, 1992, McKeefry, Murray & Parry, 2007; Volbrecht & Nerger, 2012), and conspicuity (Gunther, 2014). Those studies using appropriate size scaling of the stimuli generally find approximate invariance of the processing properties as a function of eccentricity (Noorlander, Koenderink, den Ouden, & Edens, 1983; Rovamo & Iivanainen, 1991; Abramov, Gordon & Chan, 1991, 1992; Sakurai &
Figure 1. Foveal color vividness demo designed to be viewed at two viewing distances. At a viewing
distance of 12the circular array width it spans the 5fovea where the variegated color disks show the
vividness of foveal color perception. At 60the circular array width, it spans the 1foveola, illustrating
fine-resolution color processing.
Mullen, 2006). Where significant effects are reported, one may question the precise choice of scaling factor. Tyler (1987a), for example, proposed that the appropriate scaling factor should be based on stimulating the same number of cones at each eccentricity, whereas most scaling studies attempt to equate the number of ganglion cells stimulated or the cortical magnification factor per se (although some such studies do not apply this logic to the central foveal stimuli).
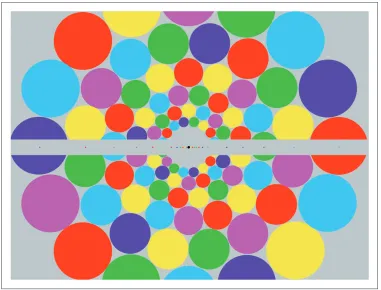
[image:4.499.66.447.60.350.2]These properties are indicated by the following demonstration images, which should be viewed at a distance so as to make the width of the central disk measure about one twelfth of the viewing distance (e.g., 1 inch diameter at a 12 inch viewing distance). This ratio corresponds to about the most liberal definition of the foveal region (5 diameter). Figure 1 shows an array of multicolored ‘‘balloons’’ within this foveal region scaled to stimulate about 1 cm2 of visual cortex at each eccentricity. In Figure 2, the same form of array is scaled up to project to the periphery beyond the foveal limit (2.5 eccentricity) into the periphery. If periphery color vision had weaker color vision, the colors when viewing Figure 2 should appear desaturated relative to those in Figure 1, but inspection verifies that they do not. (To reach the farther periphery, the viewing distance should be reduced to 5 inches with the 1 inch central disk region, when the outer rim will reach out to 45 eccentricity with central fixation.) Figure 2 also includes an overlay of a horizontal line of
Figure 2. Peripheral color vividness demo designed for two viewing distances when fixating steadily at the
centre. At 12 – the central gray disk width, it spans the periphery from 2.5to 20. At the close-up distance of
3the central gray disk width, it spans from about 10to 50eccentricity, illustrating the vividness of
peripheral color processing. The central gray bar contains elements that are unscaled for eccentricity, to illustrate the perceptual fall off in peripheral color perception.
unscaled disks typical of unscaled studies of peripheral color vision, to allow comparison of its degradation with eccentricity under these conditions.
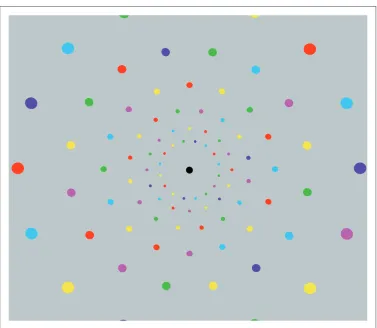
Given that the natural units of cortical processing characterized by the concept of the ‘‘hypercolumn’’ are of the order of 2 mm wide in human visual cortex, the disks in Figures 1 and 2 should each stimulate about 25 such units. To check whether color processing is similarly uniform at a grain of about 1 hypercolumn, the sizes of each disk are reduced by a factor of five for the peripheral version in Figure 3. It can be seen that color is again visible out to the edge of the image without noticeable desaturation under these reduced stimulation conditions, so integration across multiple hypercolumnar units is not required to support peripheral color processing.
[image:5.499.62.439.56.384.2]If anything, inspection of the figures shows the color perception is more vivid in the periphery, as might be expected from the fact that the cone density decreases at a slower rate than linear reciprocity with eccentricity (Curcio et al., 1987). In fact, the cone density scales with approximately the 2/3 power of eccentricity out to 20 (Tyler, 1987b). Thus, the linear scaling of the disk sizes should result in the stimulation of about five times [(10 2/3/ 10 1)2] more cones by 20 than 2 in areal terms, giving scope for cortical processing to account for the extra vividness that is perceptually observed.
Figure 3. Peripheral variegated color disks at 5reduced scale show that peripheral color remains as vivid
even close to the spatial summation limit.
Declaration of Conflicting Interests
The author(s) declared no potential conflicts of interest with respect to the research, authorship, and/or publication of this article.
Funding
The author(s) disclosed receipt of the following financial support for the research, authorship, and/or publication of this article: Supported by CDRMP grant MR130266.
References
Abramov, I., Gordon, J., & Chan, H. (1991). Color appearance in the peripheral retina: Effects of stimulus size.Journal of the Optical Society of America A,8, 404–414.
Abramov, I., Gordon, J., & Chan, H. (1992). Color appearance in the peripheral retina: Effects of a white surround.Journal of the Optical Society of America A,9, 195–202.
Curcio, C. A., Sloan, K. R. Jr., Packer, O., Hendrickson, A. E., & Kalina, R. E. (1987). Distribution of cones in human and monkey retina: Individual variability and radial asymmetry.Science,236, 579–582. Gunther, K. L. (2014). Non-cardinal color perception across the retina: Easy for orange, hard for
burgundy and sky blue.Journal of the Optical Society of America A,31, 274–282.
Jonas, J. B., Schneider, U., & Naumann, G. O. (1992). Count and density of human retinal photoreceptors.Graefes Archive for Clinical and Experimental Ophthalmology,230, 505–510. McKeefry, D. J., Murray, I. J., & Parry, N. R. (2007). Perceived shifts in saturation and hue of chromatic
stimuli in the near peripheral retina.Journal of the Optical Society of America A,24, 3168–3179. Mullen, K. T. (1991). Color vision as a post receptoral specialization of the central visual field.Vision
Research,31, 119–130.
Nagy, A. L., & Wolf, S. (1993). Red-green color discrimination in peripheral vision.Vision Research,
33, 235–242.
Noorlander, C., Koenderink, J. J., den Ouden, R. J., & Edens, B. W. (1983). Sensitivity to spatiotemporal colour contrast in the peripheral visual field.Vision Research,23, 1–11.
Østerberg, G. A. (1935). Topography of the layer of rods and cones in the human retina. Acta Ophthalmolica,13(Suppl. 6): 1–97.
Rovamo, J., & Iivanainen, A. (1991). Detection of chromatic deviations from white across the human visual field.Vision Research,31, 2227–2234.
Schira, M. M., Tyler, C. W., Breakspear, M., & Spehar, B. (2009). The foveal confluence in human visual cortex.Journal of Neuroscience,29, 9050–9058.
Song, H., Chui, T. Y., Zhong, Z., Elsner, A. E., & Burns, S. A. (2011). Variation of cone photoreceptor packing density with retinal eccentricity and age.Investigative Ophthalmology and Vision Science,52, 7376–7384. Tyler, C. W. (1987a). Analysis of visual modulation sensitivity III. Meridional variations in peripheral
flicker sensitivity.Journal of the Optical Society of America A,4, 1612–1619.
Tyler, C. W. (1987b). Analysis of human receptor density. In V. Lakshminarayanan (ed.), Basic and clinical applications of vision science(Vol. 60, pp. 63–71). Documenta Ophthalmologica Proceedings. Heidelberg: Springer.
Volbrecht, V. J., & Nerger, J. L. (2012). Color appearance at10along the vertical and horizontal
meridians.Journal of the Optical Society of America A,29, 44–51.
Williams, R. W. (1991). The human retina has a cone-enriched rim.Visual Neuroscience,6, 403–406.
Author Biography
Dr. Christopher W. Tylerhas over 40 years of experience of research in visual and cognitive neuroscience.