Cell Reports
Report
Excitatory Microcircuits within Superficial
Layers of the Medial Entorhinal Cortex
Jochen Winterer,1,9,10Nikolaus Maier,1,9Christian Wozny,1,2Prateep Beed,1,3Jo¨rg Breustedt,1Roberta Evangelista,4,5
Yangfan Peng,6Tiziano D’Albis,4,5Richard Kempter,4,5and Dietmar Schmitz1,3,4,7,8,11,* 1Neuroscience Research Center, Charite´-Universita¨tsmedizin Berlin, 10117 Berlin, Germany
2Strathclyde Institute of Pharmacy and Biomedical Sciences, University of Strathclyde, Glasgow G4 0RE, UK 3Berlin Institute of Health, 10117 Berlin, Germany
4Bernstein Center for Computational Neuroscience Berlin, 10115 Berlin, Germany
5Department of Biology, Institute for Theoretical Biology, Humboldt-Universita¨t zu Berlin, 10115 Berlin, Germany 6Institute of Neurophysiology, Charite´-Universita¨tsmedizin Berlin, 10117 Berlin, Germany
7Cluster of Excellence NeuroCure, 10117 Berlin, Germany
8Center for Neurodegenerative Diseases Berlin, 10117 Berlin, Germany 9These authors contributed equally
10Present address: Brain Research Institute, University of Z€urich, 8057 Z€urich, Switzerland 11Lead Contact
*Correspondence:[email protected] http://dx.doi.org/10.1016/j.celrep.2017.04.041
SUMMARY
The distinctive firing pattern of grid cells in the medial entorhinal cortex (MEC) supports its role in the repre-sentation of space. It is widely believed that the hex-agonal firing field of grid cells emerges from neural dynamics that depend on the local microcircuitry. However, local networks within the MEC are still not sufficiently characterized. Here, applying up to eight simultaneous whole-cell recordings in acute brain slices, we demonstrate the existence of unitary excitatory connections between principal neurons in the superficial layers of the MEC. In particular, we find prevalent feed-forward excitation from pyrami-dal neurons in layer III and layer II onto stellate cells in layer II, which might contribute to the generation or the inheritance of grid cell patterns.
INTRODUCTION
The hippocampus and parahippocampal regions are critically involved in learning and memory as well as in neurological dis-eases such as temporal lobe epilepsy and Alzheimer’s disease. More specifically, these regions are engaged in neuronal compu-tations representing space. In particular, neurons in the medial entorhinal cortex (MEC) show grid field activity in which firing lo-cations are organized in a regular hexagonal lattice (Fyhn et al., 2004; Hafting et al., 2005; Moser et al., 2014; Rowland et al., 2016). The mechanisms underlying the formation of grid fields are still unclear and an ongoing matter of intense debate (McNaughton et al., 2006; Fuhs and Touretzky, 2006; Burgess et al., 2007; Burak and Fiete, 2009). It has been proposed that pattern formation in grid cell activity could arise via Turing insta-bility (McNaughton et al., 2006; Kropff and Treves, 2008;
Row-land et al., 2016), where competition between short-range acti-vation and long-range suppression generates stable spatial patterns (Turing, 1952). Long-range suppression could be due to recurrent inhibitory projections, as proposed by attractor models (McNaughton et al., 2006; Fuhs and Touretzky, 2006; Burak and Fiete, 2009), or due to firing rate adaptation, as pro-posed by adaptation models (Kropff and Treves, 2008; Bailu et al., 2012). Although based on the same principle, these two model classes rely on very different neuronal implementations and make specific predictions about the synaptic connectivity and single-cell properties within the MEC. However, experi-mental evidence for both scenarios is rare or even contradictory (Beed et al., 2010; Couey et al., 2013; Buetfering et al., 2014). Therefore, a fundamental step to unveiling the origin of grid cell patterns is to characterize the local microcircuits within the su-perficial layers of the MEC.
Here we report on feedforward and recurrent excitatory con-nections among principal cells of the MEC. In an in vitro slice preparation, we performed simultaneous whole-cell patch-clamp recordings of up to eight neurons in layers II and III of the rat MEC. Such octuple recordings offer a combinatorial advantage over dual or quadruple recordings in that up to 56 connections can be tested at once, thereby facilitating connec-tivity studies even when the connecconnec-tivity rate is low. Synaptic coupling was tested by driving presynaptic action potential firing with somatic current injections, leading to excitatory postsyn-aptic potentials (EPSPs) in the case of synpostsyn-aptic coupling. With this technique, we analyzed the connection probability and syn-aptic properties in the superficial layers of the MEC.
RESULTS
Local Excitatory Connections of Layer III Pyramidal Cells
Within the MEC—or cortical subfields in general—synaptic connections between principal neurons can be separated into
1110 Cell Reports19, 1110–1116, May 9, 2017ª2017 The Author(s).
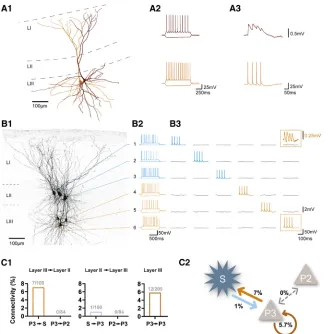
intra- and inter-laminar connections. To date, there are only a few reports published addressing the neuronal connectivity in the MEC (Dhillon and Jones, 2000; Beed et al., 2010; Couey et al., 2013; Fuchs et al., 2016). Motivated by these, we first tested the intra-laminar connectivity among identified principal neurons in layer III of the MEC. Confirming an earlier report that had been performed using sharp microelectrodes in a ‘‘blind’’ approach (Dhillon and Jones, 2000), we found that layer III pyramidal neu-rons contact other pyramidal neuneu-rons in this layer at a connectiv-ity rate of 5.7% (Figures 1A1–1A3, 12 of 209 connections tested;
Figures 1C1 and 1C2). Next, we were interested in the inter-laminar connectivity between superficial layers II and III (Figures 1B1–1B3). We observed excitatory connections from layer III py-ramidal neurons onto layer II principal neurons at a rate of 3.8% (7 of 184 connections tested, ignoring possible differences in cell types of target cells in layer II). In turn, we found only one excit-atory connection projecting from a layer II principal neuron onto a pyramidal cell in layer III (0.5%, 1 of 184 connections tested). These findings suggest a directionality of connections arising from layer III pyramidal neurons onto layer II principal neurons.
Cell Type-Specific Feedforward Connectivity
In contrast to layer III, where the majority of neurons are pyrami-dal cells, principal neurons in layer II comprise two well described classes of cells: stellate cells and pyramidal cells
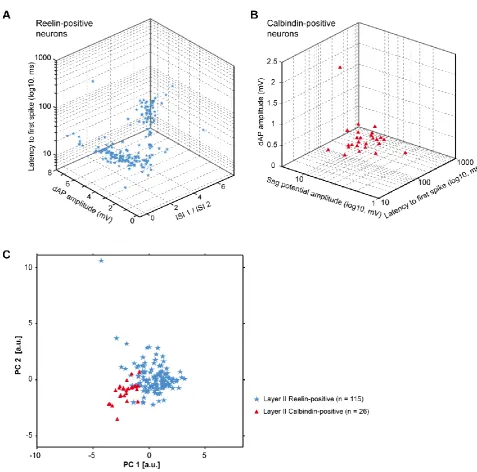
[image:2.603.53.384.98.432.2](Varga et al., 2010). To characterize and discriminate these two cell types of layer II, we combined immunoreactivity against reelin or calbindin with an analysis of intrinsic electrophysiolog-ical properties. Reelin- and calbindin-expressing principal neurons were classified as stellate cells and pyramidal cells, respectively (Figure 2). We confirmed earlier findings (Varga et al., 2010; Fuchs et al., 2016) showing that these two cell types represent electrophysiologically distinct groups (Figure S1). Importantly, we identified one intrinsic parameter as a particu-larly reliable measure to discriminate reelin- and calbindin-ex-pressing neurons: the depolarizing ‘‘sag’’ potential analyzed in response to hyperpolarizing voltage steps was significantly shorter in reelin-positive cells compared with calbindin-express-ing cells (reelin-positive cells (n = 110, 31.3±3.7 ms) versus cal-bindin-positive cells (n = 25, 45.9±7.4 ms);Figure S1). There-fore, we used this cellular property to unequivocally classify principal neurons in layer II for which the immunoreactivity was uncertain (see alsoFigure S1and cell classification in the Sup-plemental Experimental Procedures). We applied these criteria and found that inter-laminar excitatory synaptic contacts are cell type-specific; i.e., all observed contacts were between pyra-midal neurons in layer III and stellate cells in layer II. However, in these recordings, we did not detect any inter-laminar connection among pyramidal neurons of both layers (0 of 84 connections tested for each condition;Figures 1C1 and 1C2). Remarkably,
Figure 1. Inter- and Intra-laminar Excitatory Connectivity in Superficial Layers of the MEC
(A1) Reconstruction of two layer III pyramidal cells. (A2) Firing patterns of the recorded cells. (A3) Presynaptic action potentials and corre-sponding EPSPs.
(B1) Biocytin staining of six simultaneously re-corded cells. All cells are numbered according to the labels shown on the right. Three principal neurons were recorded in layer II of the MEC (blue lines), and three pyramidal cells were recorded in layer III (orange lines).
(B2) Firing patterns of the recorded cells. (B3) One neuron was stimulated with a train of four action potentials while the postsynaptic responses of the other neurons were monitored. Data were recorded in current clamp mode and are displayed in the corresponding columns for pre- and post-synaptic signals. Prepost-synaptic action potentials of pyramidal cell 6 (orange box, bottom) elicited EPSPs in the connected stellate cell 1 (orange box, top; orange trace, magnification).
(C1) Connection probability of contacts from layer III onto layer II (left), from layer II onto layer III (center), and from intra-laminar contacts within layer III, determined by the number of connected pairs divided by the number of tested connections. (C2) Connectivity scheme of layer III pyramidal cells, stellate cells, and layer II pyramidal cells in superficial layers of the MEC.
P2 and P3, pyramidal cell in layer II or III, respec-tively; S, stellate cell; LI, layer I; LII, layer II; LIII, layer III.
we observed layer III pyramidal neurons to contact layer II stel-late cells at a rate of 7.0% (7 of 100 tested connections;Figures 1C1 and 1C2). In contrast, we found only one connection from layer II stellate cells onto layer III pyramidal cells (1.0%, 1 of 100 connections tested;Figures 1C1 and 1C2). Intrinsic electro-physiological parameters—i.e., the ratio of the first two inter-spike intervals (ISIs) upon injection of positive current (ISI 1 / ISI 2, index for burst firing), the latency to the first spike, and the depolarizing afterpotential (dAP)—were recently used to further categorize principal neurons in layer II of the MEC (Fuchs et al., 2016). However, in our hands, the same analysis did not unveil additional clusters of principal neurons in layer II of the MEC (Figures S1andS2).
Together, our multi-cellular recordings demonstrate connec-tions among principal neurons in the superficial layers II and III of the MEC; these connections are cell type-specific and largely unidirectional toward stellate cells of layer II.
Excitatory Synaptic Connectivity within Layer II
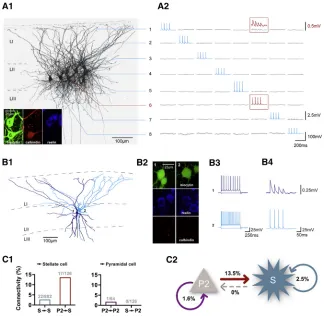
Having established the presence of predominantly unidirectional coupling that connects layers III and II, we were interested in the excitatory connectivity within layer II of the MEC (Figures 2A and 2B). We tested a total of 882 synaptic connections and found 22 excitatory connections among stellate cells (connectivity,
2.5%;Figures 2C1 and 2C2). Again, we observed that connec-tions between the two principal neuron entities exhibit a cell type-specific wiring scheme. Although pyramidal cells form
syn-aptic contacts onto stellate cells at a remarkable rate of13.5% (17 of 126 tested connections;Figure 2C), stellate cells never contact pyramidal neurons (0 of 126 connections tested; Fig-ure 2C). Taken together, these results suggest a specific direc-tionality in the information flow within the superficial layers of the MEC, with a majority of the excitatory projections converging onto stellate cells in layer II.
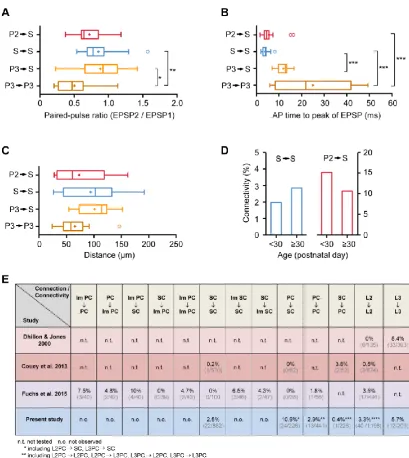
Characteristics of Excitatory Connections in the Superficial Layers of the MEC
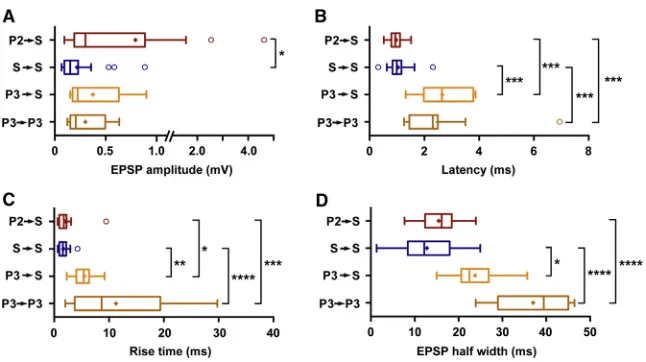
[image:3.603.59.383.100.417.2]Finally, we analyzed various properties of synaptic transmission in the coupled cell pairs and observed specific differences. First, we found significantly higher amplitudes of unitary synaptic re-sponses at contacts of layer II pyramids onto layer II stellate cells (range, from 0.09 to 4.6 mV; median, 0.3 mV; interquartile range [IQR], 0.7 mV;Figure 3A) compared with unitary synaptic con-nections among stellate cells (range, from 0.07 to 0.9 mV; me-dian, 0.15 mV; IQR, 0.13 mV; Figure 3A; p = 0.01). Second, intra-laminar connections onto stellate cells had particularly short synaptic delays compared with inter-laminar projections and layer III-layer III connections (latency, p < 0.001;Figure 3B; for further analyses on action potential (AP) time to peak values, distance distribution, and age dependence of excitatory connec-tivity, see Figures S3B–S3D). Third, we observed that the EPSP kinetics of intra-laminar connections onto stellate cells were particularly fast in comparison with layer III-layer II or layer III-layer III connections (rise time (10%–90%) and half-width of
Figure 2. Stellate Cells, but Not Pyramidal Neurons, Receive Strong Excitatory Input in Layer II of the MEC
(A1) Biocytin staining of eight simultaneously re-corded neurons. All cells are numbered according to the labels shown on the right. The inset shows the immunohistochemistry of cells 1 and 6. The upper cell (1) is immunoreactive to reelin but not to calbindin, whereas cell 6 is immunoreactive to calbindin but not to reelin.
(A2) One neuron was stimulated with a train of four action potentials while the postsynaptic responses of the other neurons were monitored. Data were recorded in current clamp mode and are displayed in the corresponding columns for pre- and post-synaptic signals. The prepost-synaptic action potentials of cell 6 (red box) elicited EPSPs in the connected cell 1 (red trace on top, magnification).
(B1) Reconstruction of two layer II stellate cells. (B2) Immunohistochemistry of biocytin-filled, reelin-positive, calbindin-negative cells in layer II of the MEC.
(B3) Firing patterns of the recorded cells. (B4) Presynaptic action potentials of cell 2 and corresponding postsynaptic EPSPs in cell 1. (C1) Connection probability of contacts onto stel-late cells (left) and layer II pyramidal cells (right), as determined by the number of connected pairs divided by the number of tested connections. (C2) Connectivity scheme of layer II pyramidal cells and stellate cells in layer II of the MEC.
EPSP;Figures 3C and 3D). To characterize the strength of the coupling of different cell types (Figure 4A), we weighted the con-nectivity rates by EPSP amplitudes (Figure 4B), which allowed to compare more directly the relative strengths of the different syn-aptic junctions. Intriguingly, we found that the total weighted feedforward connectivity onto stellate cells was much stronger compared with the recurrent connectivity among these neurons, even in light of the ratio of 60%:40% reported for reelin-positive stellate cells and calbindin-positive (or Wolfram syndrome 1-positive) pyramidal cells (Varga et al., 2010; Sun et al., 2015). This directionality within the superficial layers of the MEC sug-gests organizational principles in a brain area that is regarded to be pivotal for memory formation.
DISCUSSION
The present study provides direct evidence for feedforward and recurrent excitatory connectivity within the superficial layers of the MEC. Remarkably, we demonstrate a high rate of feedfor-ward excitatory connections from pyramids of layers III and II onto stellate cells in layer II (Figure 4A). In addition, we observe a high synaptic coupling strength at the pyramidal cell-stellate cell synapse within layer II. We also consistently find recurrent excitatory synaptic connections among pyramidal cells in layer III and stellate cells in layer II. This latter result challenges the pre-vailing view of excitatory connections among stellate cells in layer II of the MEC being sparse or even absent (Couey et al., 2013; Pastoll et al., 2013; Fuchs et al., 2016; for a comparison of connectivity values in the MEC, seeFigure S3E). Although
[image:4.603.53.376.98.279.2]Fuchs et al. (2016) report on excitatory connections among intermediate stellate and stellate cells, our analysis does not support any additional differentiation. However, the reported connection probability of all stellate cells, irrespective of their sub-classification, resembles the connectivity rate we observe in our present study. In addition, similar to our findings, the highest connectivity rate in layer II was found in connections impinging on stellate cells (Fuchs et al., 2016). Nonetheless, the origin of the differences in the classification of principal neu-rons in layer II remains unclear.
Figure 3. Properties of Excitatory Synaptic Connections in the Superficial Layers of the MEC
(A) EPSP amplitudes. For each spike train, the first EPSP amplitude was analyzed. All recordings were done at 60 mV.
(B) Synaptic delays as determined by the time from the peak of the presynaptic AP to the onset of the EPSPs.
(C) Rise times (10%–90%) of the EPSPs. (D) Half-width of the EPSPs.
The statistical significance of the displayed differ-ences was assessed by Dunn’s test of multiple comparisons. *p%0.05, **p%0.01, ***p%0.001, ****p%0.0001.
The observed excitatory couplings are consistent with cross-correlation analysis of the spiking activity of MEC principal neurons and grid cells in behaving rats (Quilichini et al., 2010; Tocker et al., 2015) and with an increase in excitatory synaptic transmission during grid field crossing (Schmidt-Hieber and Ha¨usser, 2013; Domnisoru et al., 2013; Heys et al., 2014).
From a functional perspective, our data suggest that mono-synaptic recurrent excitatory connections could constrain grid cell activity within a low-dimensional continuous attractor (Yoon et al., 2013). This may explain why grid cells of the same module tend to react in concert to external manipulations of the geometry of the environment (Barry et al., 2007, 2012) or to manipulations of the light conditions (Chen et al., 2016; Pe´rez-Escobar et al., 2016). However, it remains unclear whether such recurrent connections are also responsible for the forma-tion of grid cell patterns (McNaughton et al., 2006; Fuhs and Touretzky, 2006; Burak and Fiete, 2009). We found that the feed-forward connectivity onto layer II stellate cells is much stronger compared with the recurrent connectivity among these neurons (Figure 4B). Therefore, assuming that grid cell patterns do origi-nate in layer II stellate cells, where most of the excitatory inputs converge (Figure 4B), our data support feedforward rather than recurrent dynamics shaping grid cell activity in this region. This view favors feedforward models of grid cell formation (Kropff and Treves, 2008; Bailu et al., 2012). Alternatively, layer II stellate cells could inherit their grid-like tuning from upstream principal cell populations, such as pyramidal cells in layer II (Sun et al., 2015) or layer III, rather than generating spatial patterns exclu-sively. This inheritance process, which requires a specific func-tional connectivity pattern, could be achieved in an unsupervised manner and could result in improved grid-like tuning in the down-stream structure. Indeed, we have modeled such a scenario and found that the activity of grid cells might be inherited and improved by a Hebbian mechanism (Figure S4). Future studies will have to examine this scenario using state-of-the art genetic cell type-specific manipulations in detail. Importantly, recent work has already provided some evidence for grid cells being present in adjacent brain regions, such as the pre- and parasu-biculum (Boccara et al., 2010).
We obtained our data from acute brain slice preparation. This approach has two consequences: First, because of the slicing,
axons are cut, most likely not in a uniform way, and all cell sub-type-specific connections are severed equally; in contrast, because of the geometrical layout of cortical structures, the con-nections between different subsets of neurons might be affected differently (Barth et al., 2016). As a consequence, our data may provide an underestimation of the actual excitatory connectivity matrix in superficial layers of the MEC; however, recent work us-ing two-photon targeted whole-cell recordus-ings in vivo surpris-ingly found very similar connectivity rates as in slice preparations (Jouhanneau et al., 2015). Second, by its nature, our approach precludes the investigation of grid cell firing. However, grid field activity is evident in principal cells of superficial layers of the MEC (Rowland et al., 2016but seeTang et al., 2015), and thus it is highly likely that the architecture of this microcircuit is the substrate that shapes this distinct pattern of activity.
In summary, our data highlight the presence of frequent excit-atory synaptic connections among principal cells in the MEC and support the view that grid-forming neuronal networks can rely on excitatory connections.
EXPERIMENTAL PROCEDURES
Experimental Animals
Animal maintenance and experiments were in accordance with the respective guidelines of local authorities (Berlin state government, T0073/04) and fol-lowed the German Animal Welfare Act and European Council Directive 2010/ 63/EU regarding the protection of animals used for experimental and other sci-entific purposes.
Electrophysiology Slice Preparation
Wistar rats (post-natal day [P]21–P60, both sexes) were decapitated following isoflurane anesthesia. The brains were removed and transferred to ice-cold sucrose-based artificial cerebrospinal fluid (sACSF) containing 87 mM NaCl, 75 mM sucrose, 26 mM NaHCO3, 2.5 mM KCl, 1.25 mM NaH2PO4, 0.5 mM
CaCl2, 7.0 mM MgCl2, and 25 mM glucose, saturated with 95% O2and 5%
CO2(pH 7.4). Slices (400mm, taken from the dorsal third of the MEC) were
cut on a vibratome (VT1200S, Leica Biosystems) in a horizontal plane that was tilted to the perpendicular axis of the pial surface of the entorhinal cortex. Slices were stored in an interface chamber (32C–34C), continuously oxygen-ized with carbogen, and perfused with ACSF containing 119 mM NaCl, 26 mM NaHCO3, 10 mM glucose, 2.5 mM KCl, 2.5 mM CaCl2, 1.3 mM MgCl2, and
1.0 mM NaH2PO4at a rate of1 mL/min. The slices were allowed to recover
for at least 1 hr after preparation before they were transferred into the recording chamber.
Connectivity
As described recently (Bo¨hm et al., 2015; Peng et al., 2017), recordings were performed in ACSF at 32C–34C in a submerged recording chamber. Cells in the MEC were identified using infrared differential contrast video microscopy (BX51WI, Olympus) and selected within a distance of 10–250mm. We performed somatic whole-cell patch-clamp recordings (pipette resistance, 2.5–4 MU) of up to eight cells simultaneously. One cell was stimulated with a train of four action potentials at 50 Hz, elicited by 1- to 2-ms-long current injections of 2–4 nA. For characterization, increasing steps of current were injected (1 s; increment, 50 pA). In a few experiments, a hyperpolarizing or depolarizing holding current was applied to keep the membrane potential at 60 mV. In total, we recorded 136 layer III pyramidal cells, 87 layer II pyramidal cells, and 315 layer II stellate cells. The intracellular solution contained 135 mM potassium-gluconate, 6.0 mM KCl, 2.0 mM MgCl2, 0.2 mM EGTA, 5.0 mM Na2-phosphocreatine,
2.0 mM Na2-ATP, 0.5 mM Na2-GTP, 10 mM
4-(2-hydroxyethyl)-1-piperazinee-thanesulfonic acid (HEPES) buffer, and 0.2% biocytin. The pH level was adjusted to 7.2 with potassium hydroxide (KOH). Recordings were performed using Multiclamp 700A/B amplifiers (Molecular Devices). Signals were filtered at 6 kHz, sampled at 20 kHz, and digitized at 16-bit resolution using Digidata 1550 and pClamp 10 (Molecular Devices).
Data Analysis Connectivity
Synaptic connections were identified when there was a postsynaptic potential corresponding to the presynaptic stimulation in the averaged trace from 40–50 sweeps. A baseline period (2 ms) just prior to the stimulation and the averaged postsynaptic peak during the first action potential was used for the analysis of the EPSP amplitudes, synaptic delays, and EPSP kinetics with AxoGraph X (https://axographx.com). Only pairs in which the first postsynaptic peak was clearly discernible were used for analysis. The statistical significance of differ-ences in EPSP amplitudes, latency, rise time, AP time to peak, half-width, or paired-pulse ratio (PPR) was calculated using Kruskal-Wallis test and post hoc Dunn’s test for multiple comparisons. The example traces inFigures 1
and2were filtered at 1 kHz and represent averages of 25–50 sweeps. The AP trains inFigures 1B3 and2A2 are displayed as single sweeps.
Immunohistochemistry and Neuroanatomy of Principal Cells
[image:5.603.58.383.98.252.2]After recording, slices were transferred into a fixative solution containing 4% paraformaldehyde in 0.1 M phosphate buffer. Primary antibodies were diluted in incubation medium (PBS containing 2.5% normal goat serum and 1% Triton). Immunoreactions for calbindin were carried out with a rabbit antibody (Cb-38, Swant, diluted 1:10,000) and for reelin with a mouse antibody (MAB5354, Millipore, diluted 1:1,000). Secondary antibodies conjugated to Alexa 555 (or Alexa 594) and Alexa 647 (diluted 1:500, Molecular Probes) raised against mouse and rabbit were used to detect the location of the pri-mary antibodies; streptavidin was conjugated to Alexa 488 for biocytin (diluted 1:500). The slices were then mounted in Fluoroshield (Sigma-Aldrich) and analyzed. Image stacks of specimens were imaged on a Leica TCS SP5 confocal microscope (Leica Microsystems). Images were quantified
Figure 4. Comparison of Connectivity Rates Demonstrates Substantial Feedforward Excitatory Signaling onto Layer II Stellate Cells
(A) Contingency table of the excitatory connectivity in superficial layers of the MEC. Displayed are the connectivity rate and the observed and tested connections (in brackets).
(B) Connectivity scheme with weighted excitatory synaptic connections to indicate the relative strengths of the investigated synaptic connec-tions. The strokes of the arrows reflect the connection probabilities multiplied by the medians of the amplitudes of the EPSPs (in a.u.): P2/S, 4.1; P3/S, 1.6; S/S, 0.4; P3/P3, 1.2; P2/P2, 0.3. Together, these values highlight a feedforward signaling onto layer II stellate cells of the MEC.
using ImageJ software (https://rsbweb.nih.gov/ij/). The reconstructions in
Figures 1B1 and2A1 were done after blind deconvolution with AutoQuant X3 (MediaCybernetics).Figures 1A1 and2B1 were done with the aid of the Neurolucida 3D reconstruction system (MicroBrightField).
Cell Classification
For cell classification of layer II principal neurons, we made use of the differen-tial immunoreactivity of these cells to reelin and calbindin and the analysis of intrinsic electrophysiological properties. For further details, seeSupplemental Experimental Procedures.
SUPPLEMENTAL INFORMATION
Supplemental Information includes Supplemental Experimental Procedures and four figures and can be found with this article online athttp://dx.doi.org/ 10.1016/j.celrep.2017.04.041.
AUTHOR CONTRIBUTIONS
The study was conceived and designed by D.S. and R.K. The electrophysio-logical experiments were performed by J.W., N.M., C.W., and P.B. J.W., R.E., N.M., C.W., P.B., and Y.P. analyzed the electrophysiological experi-ments. J.W. and J.B. analyzed the immunohistochemistry and neuroanatomy. T.D. and R.K. performed the modeling. J.W., N.M., D.S., T.D., and R.K. wrote the paper with help from C.W., P.B., and J.B.
ACKNOWLEDGMENTS
This study was supported by grants from the DFG (SFB 958, Exc 257, and KE 788/3-1), the Bernstein Center for Computational Neuroscience Berlin (01GQ1001A), Bernstein Focus Learning (01GQ0972), and BMBF (SMARTAGE) and a BIH Delbr€uck fellowship. The authors thank Susanne Rieckmann, Anke Scho¨nherr, and Lisa Z€uchner for excellent technical assis-tance. We are indebted to Antje Forstroer for advice regarding analysis, to Jo¨rg Geiger for advice regarding the multiple patch-clamp recording setup, and Michael Brecht and Rosanna Sammons for helpful comments on the manuscript.
Received: August 30, 2016 Revised: February 14, 2017 Accepted: April 13, 2017 Published: May 9, 2017
REFERENCES
Bailu, S., Kropff, E., and Treves, A. (2012). Grid alignment in entorhinal cortex. Biological Cybernetics106, 483–506.
Barry, C., Hayman, R., Burgess, N., and Jeffery, K.J. (2007). Experience-dependent rescaling of entorhinal grids. Nat. Neurosci.10, 682–684.
Barry, C., Ginzberg, L.L., O’Keefe, J., and Burgess, N. (2012). Grid cell firing patterns signal environmental novelty by expansion. Proc. Natl. Acad. Sci. USA109, 17687–17692.
Barth, L., Burkhalter, A., Callaway, E.M., Connors, B.W., Cauli, B., DeFelipe, J., Feldmeyer, D., Freund, T., Kawaguchi, Y., Kisvarday, Z., et al. (2016). Comment on ‘‘Principles of connectivity among morphologically defined cell types in adult neocortex’’. Science353, 1108.
Beed, P., Bendels, M.H., Wiegand, H.F., Leibold, C., Johenning, F.W., and Schmitz, D. (2010). Analysis of excitatory microcircuitry in the medial entorhi-nal cortex reveals cell-type-specific differences. Neuron68, 1059–1066.
Boccara, C.N., Sargolini, F., Thoresen, V.H., Solstad, T., Witter, M.P., Moser, E.I., and Moser, M.B. (2010). Grid cells in pre- and parasubiculum. Nat. Neuro-sci.13, 987–994.
Bo¨hm, C., Peng, Y., Maier, N., Winterer, J., Poulet, J.F., Geiger, J.R., and Schmitz, D. (2015). Functional diversity of subicular principal cells during hip-pocampal ripples. J. Neurosci.35, 13608–13618.
Buetfering, C., Allen, K., and Monyer, H. (2014). Parvalbumin interneurons pro-vide grid cell-driven recurrent inhibition in the medial entorhinal cortex. Nat. Neurosci.17, 710–718.
Burak, Y., and Fiete, I.R. (2009). Accurate path integration in continuous attrac-tor network models of grid cells. PLoS Comput. Biol.5, e1000291.
Burgess, N., Barry, C., and O’Keefe, J. (2007). An oscillatory interference model of grid cell firing. Hippocampus17, 801–812.
Chen, G., Manson, D., Cacucci, F., and Wills, T.J. (2016). Absence of Visual Input Results in the Disruption of Grid Cell Firing in the Mouse. Curr. Biol. 26, 2335–2342.
Couey, J.J., Witoelar, A., Zhang, S.J., Zheng, K., Ye, J., Dunn, B., Czajkowski, R., Moser, M.B., Moser, E.I., Roudi, Y., and Witter, M.P. (2013). Recurrent inhibitory circuitry as a mechanism for grid formation. Nat. Neurosci.16, 318–324.
Dhillon, A., and Jones, R.S. (2000). Laminar differences in recurrent excitatory transmission in the rat entorhinal cortex in vitro. Neuroscience99, 413–422.
Domnisoru, C., Kinkhabwala, A.A., and Tank, D.W. (2013). Membrane potential dynamics of grid cells. Nature495, 199–204.
Fuchs, E.C., Neitz, A., Pinna, R., Melzer, S., Caputi, A., and Monyer, H. (2016). Local and Distant Input Controlling Excitation in Layer II of the Medial Entorhi-nal Cortex. Neuron89, 194–208.
Fuhs, M.C., and Touretzky, D.S. (2006). A spin glass model of path integration in rat medial entorhinal cortex. J. Neurosci.26, 4266–4276.
Fyhn, M., Molden, S., Witter, M.P., Moser, E.I., and Moser, M.B. (2004). Spatial representation in the entorhinal cortex. Science305, 1258–1264.
Hafting, T., Fyhn, M., Molden, S., Moser, M.B., and Moser, E.I. (2005). Micro-structure of a spatial map in the entorhinal cortex. Nature436, 801–806.
Heys, J.G., Rangarajan, K.V., and Dombeck, D.A. (2014). The functional micro-organization of grid cells revealed by cellular-resolution imaging. Neuron84, 1079–1090.
Jouhanneau, J.S., Kremkow, J., Dorrn, A.L., and Poulet, J.F. (2015). In Vivo Monosynaptic Excitatory Transmission between Layer 2 Cortical Pyramidal Neurons. Cell Rep.13, 2098–2106.
Kropff, E., and Treves, A. (2008). The emergence of grid cells: Intelligent design or just adaptation? Hippocampus18, 1256–1269.
McNaughton, B.L., Battaglia, F.P., Jensen, O., Moser, E.I., and Moser, M.B. (2006). Path integration and the neural basis of the ‘cognitive map’. Nat. Rev. Neurosci.7, 663–678.
Moser, E.I., Roudi, Y., Witter, M.P., Kentros, C., Bonhoeffer, T., and Moser, M.B. (2014). Grid cells and cortical representation. Nat. Rev. Neurosci.15, 466–481.
Pastoll, H., Solanka, L., van Rossum, M.C., and Nolan, M.F. (2013). Feedback inhibition enablesq-nestedgoscillations and grid firing fields. Neuron77, 141–154.
Peng, Y., Barreda Toma´s, F.J., Klisch, C., Vida, I., and Geiger, J.R.P. (2017). Layer-Specific Organization of Local Excitatory and Inhibitory Synaptic Con-nectivity in the Rat Presubiculum. Cereb. Cortex27, 2435–2452.
Pe´rez-Escobar, J.A., Kornienko, O., Latuske, P., Kohler, L., and Allen, K. (2016). Visual landmarks sharpen grid cell metric and confer context specificity to neurons of the medial entorhinal cortex. eLife5, e16937.
Quilichini, P., Sirota, A., and Buzsa´ki, G. (2010). Intrinsic circuit organization and theta-gamma oscillation dynamics in the entorhinal cortex of the rat. J. Neurosci.30, 11128–11142.
Rowland, D.C., Roudi, Y., Moser, M.B., and Moser, E.I. (2016). Ten Years of Grid Cells. Annu. Rev. Neurosci.39, 19–40.
Schmidt-Hieber, C., and Ha¨usser, M. (2013). Cellular mechanisms of spatial navigation in the medial entorhinal cortex. Nat. Neurosci.16, 325–331.
Sun, C., Kitamura, T., Yamamoto, J., Martin, J., Pignatelli, M., Kitch, L.J., Schnitzer, M.J., and Tonegawa, S. (2015). Distinct speed dependence of ento-rhinal island and ocean cells, including respective grid cells. Proc. Natl. Acad. Sci. USA112, 9466–9471.
Tang, Q., Ebbesen, C.L., Sanguinetti-Scheck, J.I., Preston-Ferrer, P., Gundl-finger, A., Winterer, J., Beed, P., Ray, S., Naumann, R., Schmitz, D., et al. (2015). Anatomical Organization and Spatiotemporal Firing Patterns of Layer 3 Neurons in the Rat Medial Entorhinal Cortex. J. Neurosci.35, 12346– 12354.
Tocker, G., Barak, O., and Derdikman, D. (2015). Grid cells correlation struc-ture suggests organized feedforward projections into superficial layers of the medial entorhinal cortex. Hippocampus25, 1599–1613.
Turing, A.M. (1952). The chemical basis of morphogenesis. Philos. Trans. R. Soc. Lond. B Biol. Sci.237, 37–72.
Varga, C., Lee, S.Y., and Soltesz, I. (2010). Target-selective GABAergic control of entorhinal cortex output. Nat. Neurosci.13, 822–824.
Yoon, K., Buice, M.A., Barry, C., Hayman, R., Burgess, N., and Fiete, I.R. (2013). Specific evidence of low-dimensional continuous attractor dynamics in grid cells. Nat. Neurosci.16, 1077–1084.
Cell Reports, Volume19
Supplemental Information
Excitatory Microcircuits within Super
fi
cial
Layers of the Medial Entorhinal Cortex
1
2
3
4
5
Supplemental Experimental Procedures
Cell classification. To differentiate layer II principal neurons, we made use of the differential
immunoreactivity of these cells, i.e. stellate cells expressing the glycoprotein reelin and pyramidal
neurons expressing the Ca2+ binding protein calbindin (Varga et al., 2010). Immunolabeling revealed
238 reelin-positive and 48 calbindin-positive cells, enabling us to classify them as stellate- and
pyramidal neurons, respectively. We further analyzed nine electrophysiological parameters in all
cells, if possible (Figure S1; see also Alonso and Klink, 1993; Canto and Witter, 2012): Resting
membrane potential values represent initial voltages recorded after arriving in the whole-cell
configuration. The input resistance was calculated from the deviation from baseline of steady-state
voltage responses evoked by intracellular current injections (50 pA). The latency to first spike at
rheobase was determined as the time from the onset of the depolarization step current to the onset of
the action potential (threshold: dV/dt 90 V/s). The spike duration at rheobase was found as the
duration from spike onset to the time point where the decaying slope of the action potential crossed
the onset voltage level again. The adaptation ratio was calculated both as the ratio of the last and the
first interspike intervals (last ISI / ISI 1) or as the ratio of the first two interspike intervals (ISI 1 / ISI
2) at current steps of +500 pA and 1000 ms. The depolarizing afterpotential (dAP) for spikes at
rheobase was determined by calculating the voltage difference between the local minimum of the fast
afterhyperpolarization (fAHP) and the following depolarizing peak (Alonso and Klink, 1993).
Amplitude and half-width (i.e., the duration at 50% of the amplitude) of the sag potential were
measured in response to -750 pA (or -100 pA) current injection. We observed that the half-width of
the sag potential -750 pA current injection predicted best the immunoreactivity to reelin and calbindin
of layer II principal cells (Fig. S1). This enabled us to define a threshold for the classification of cells
with non-sufficient staining. To find the best separation value, we used a linear 1d support vector
machine (SVM, from the Python scikit-learn package, version 0.18.1) taking into account the class
imbalance of reelin-positive and calbindin-positive cell numbers. The weighted SVM for the
half-width of the sag potential was 37.2 ms (accuracy: 0.93; 10-fold cross validation) at -750 pA current
injection (in some of the recorded cells we injected only -100 pA, yielding a weighted SVM of 45.2
ms with a slightly reduced accuracy: 0.85; 10-fold cross validation). Finally, we classified neurons
that were non-sufficiently stained as follows: cells were classified as reelin-positive and therefore as
stellate cells, if the half-width of the sag potential was 36 ms for -750 pA current injection (or 42
ms for -100 pA current injection) and as calbindin-positive and therefore as pyramidal cells if the
half-width of the sag potential was 38 ms (-750 pA) or 48 ms (-100 pA). Layer III pyramidal cells
could be easily distinguished from both layer II pyramidal and stellate cells based on clear differences
6
mV) in layer III pyramidal cells (see Fig. S1 for comparison with layer II stellate and pyramidal
neurons).
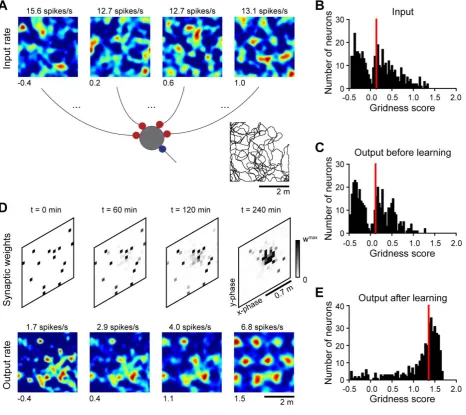
Modeling. Here we show that feed-forward excitatory projections could support the inheritance of
grid-cell activity across distinct neuronal populations, and that grid patterns could become more
regular through this inheritance process. To this end, we model the activity of a population of
weakly-tuned grid cells projecting to a target principal-cell population as a virtual rat explores a square
enclosure. Input firing-rate maps were obtained by distorting with noise hexagonal grids with
common spacing and orientation, but different spatial phases (Fig. S4A, B), similarly to what is
observed within a grid-cell module (Hafting et al., 2005). The feed-forward connectivity was sparse
and initially random, that is, each neuron in the target principal-cell population received input from a
set of noisy grids with random spatial phases. Such a random connectivity slightly decreased the grid
tuning of the output spatial maps (Fig. S4C). Indeed, in a feed-forward network, the output grid tuning
could be improved only by selecting input grids with similar phases. But how to obtain such an input
selection that crucially depends on the behavioral correlates of neural activity?
We suggest that Hebbian plasticity could drive this selection. In Fig. S4D we illustrate this hypothesis
for one example output neuron in the target principal-cell population. Initially, the output neuron was
driven by a random set of inputs, and the corresponding output firing-rate map was spatially irregular
(Fig. S4D, left-most panels). With experience, however, inputs with similar grid phases increased
their synaptic strength, and, as a result, a more regular grid pattern emerged at the output (Fig. S4D,
right-most panels). The spatial phase of the output grid depended on the initial state of the synaptic
weights and on the trajectory of the virtual rat, which were both random. Nevertheless, regardless of
the initial conditions, the firing-rate maps at the output (Fig. S4E) were consistently more regular
than the ones at the input (Fig. S4B).
In summary, we demonstrate with a computational model that grid tuning could be inherited and even
be improved via feed-forward projections across distinct principal-cell populations. We assumed that
the experimentally observed feed-forward connections (Figs. 1-3) were also representative for grid
cells and that cells with weak grid tuning (same period, same orientation, but different phase) in an
input layer projected to a target grid cell in an output layer. Note that inheritance requires only weak
grid tuning at the input layer (see input gridness scores in Fig. S4B).
A connectivity pattern suitable for the inheritance was learned from the activity correlations already
present at the input. We suggest that such learning could happen concurrently with the development
of grid cells in the first ~3 weeks of age (Langston et al., 2010; Wills et al., 2012, 2010), and that
grid-field inheritance could take place in feed-forward projections from pyramidal cells in layer II or
7
show grid spatial tuning (Sun et al., 2015), although it remains unclear which principal-cell population
contains the most-regular grids (Sun et al., 2015; Tang et al., 2014).
Model implementation.
We model a feed-forward network of 𝑁in excitatory inputs with rates { 𝑟𝑗in∶ j=1,2,..., 𝑁in }
projecting to 𝑁out excitatory outputs with rates { 𝑟𝑖out ∶ i=1,2,..., 𝑁out }, where
𝑟𝑖out(𝑥⃗) = [∑𝑁𝑗=1in 𝑤𝑖𝑗 𝑟𝑗in(𝑥⃗)− 𝑟0]
+. (1)
The vector 𝑥⃗ = [𝑥1, 𝑥2 ] is the position of the virtual rat in the environment, 𝑤𝑖𝑗 is the synaptic weight
from input neuron 𝑗 to output neuron 𝑖, 𝑟0 > 0 spikes/s is a spatially-homogeneous inhibitory rate,
and the function [𝑧]+ =z if z>0, =0 if 𝑧 ≤ 0 is a static non-linearity. The input rates are modeled
by distorting with noise hexagonal grids with common spacing and orientation, but different spatial
phases:
𝑟𝑗in(𝑥⃗) = [𝑎𝑔𝑗(𝑥⃗) + (1 − 𝑎)𝜉𝑗(𝑥⃗)]+ , (2)
where 𝑔𝑗(𝑥⃗) is a hexagonal grid with phase 𝜑⃗⃗𝑗, 𝜉𝑗(𝑥⃗) is a realization of a 2-dimensional noise
process, and the parameter 0 < 𝑎 < 1 weights the strength of the grid signal in relation to the noise.
The grid signal 𝑔𝑗(𝑥⃗) is the sum of three planar waves with wave vectors {𝑘⃗⃗𝑛 ∶ 𝑛 = 0, 1, 2 } that are
60 degrees apart:
𝑔𝑗(𝑥⃗) = 𝐵 [ ∑ cos (𝑘⃗⃗𝑛 ⋅ (𝑥⃗ + 𝜑⃗⃗𝑗 )) 𝑛=2
𝑛=0
]
+
with 𝑘⃗⃗𝑛 = 4𝜋 𝑇√3[
cos( 𝑛𝜋 3⁄ + 𝛽 )
sin( 𝑛𝜋 3⁄ + 𝛽 ) ] , (3)
where 𝐵 > 0 controls the grid amplitude, 𝛽 sets the grid orientation, and 𝑇 is the grid spacing. The
spatial phases {𝜑⃗⃗𝑗} are sampled to cover the entire phase space evenly. The input noise is uncorrelated
across neurons but correlated across spatial locations such that it varies smoothly in space.
Specifically, the noise is generated by low-pass filtering 2-dimensional white Gaussian noise with a
circularly-symmetric Gaussian filter: 𝐺(𝑥⃗)= exp(−|𝑥⃗| 2⁄ 𝜎𝑥2), where 𝜎𝑥controls the filter width. The
mean and the variance of the noise are normalized to match the ones of the input signal 𝑔𝑗(𝑥⃗).
8
d𝑤𝑖𝑗
d𝑡 = 𝜂(𝑟𝑗
in− 𝛾)𝑟 𝑖out,
(4)
where 𝜂 is a small learning rate and 𝛾 > 0 spikes/s sets the threshold between long-term potentiation
and long-term depression. Additionally, the synaptic weights {𝑤𝑖𝑗} are bounded between 0 and
𝑤maxat each time point. At the initial condition, a random subset of 𝑁up< 𝑁in synaptic weights are
set at the upper bound 𝑤max > 0 whereas all the other weights are set to 0.
The virtual rat explores a square arena of side-length 𝐿 with a correlated random walk with movement
directions that vary smoothly in time. Precisely, the rat’s trajectory is a sample of the 2-dimensional
stochastic process
d𝑋⃗⃗𝑡
d𝑡 = 𝑣 [ cos(𝜃𝑡), sin(𝜃𝑡) ] with 𝜃𝑡 = 𝜎𝜃𝑊𝑡, (5)
where 𝑋⃗𝑡 is the position of the virtual rat at time 𝑡, the process 𝜃𝑡 sets the direction of motion, and 𝑊𝑡
is a standard Wiener process. The parameters 𝑣 and 𝜎𝜃 control the speed of motion and the tortuosity
of the trajectory. At the boundaries of the environment, only movement directions towards the interior
of the arena are retained.
Parameter values: 𝑁in= 𝑁out = 400, 𝑟0 = 3 spikes/s, 𝑎 = 0.27, 𝐵 = 6, 𝛽 = 0, 𝑇 = 1.4 m, 𝜎𝑥=
0.15 m, 𝜂 = 2 ⋅ 10−51/s, 𝛾 = 3.8 spikes/s, 𝑤max= 0.067, 𝑁up = 15, 𝐿 = 4 m, 𝑣 = 0.2 m/s, 𝜎
𝜃 =
0.7.
Gridness scores of input and output firing-rate maps were computed with the algorithm proposed by
9
Supplemental References
Alonso, A., Klink, R. (1993). Differential electroresponsiveness of stellate and pyramidal-like cells of medial entorhinal cortex layer II. J. Neurophysiol. 70, 128–143.
Canto, C.B., Witter, M.P. (2012). Cellular properties of principal neurons in the rat entorhinal cortex. II. The medial entorhinal cortex. Hippocampus 22, 1277–1299.
Hafting, T., Fyhn, M., Molden, S., Moser, M., Moser, E.I. (2005). Microstructure of a spatial map in the entorhinal cortex. Nature 436, 801–806.
Langston, R.F., Ainge, J.A., Couey, J.J., Canto, C.B., Bjerknes, T.L., Witter, M.P., Moser, E.I., Moser, M.-B. (2010). Development of the Spatial Representation System in the Rat. Science 328, 1576–1581.
Stensola, H., Stensola, T., Solstad, T., Frøland, K., Moser, M.-B., Moser, E.I. (2012). The entorhinal grid map is discretized. Nature 492, 72–8.
Sun, C., Kitamura, T., Yamamoto, J., Martin, J., Pignatelli, M., Kitch, L.J., Schnitzer, M.J., Tonegawa, S. (2015). Distinct speed dependence of entorhinal island and ocean cells, including respective grid cells. Proc. Natl. Acad. Sci. 112, 9466–9471.
Tang, Q., Burgalossi, A., Ebbesen, C.L., Ray, S., Naumann, R., Schmidt, H., Spicher, D., Brecht, M. (2014). Pyramidal and stellate cell specificity of grid and border representations in layer 2 of medial entorhinal cortex. Neuron 84, 1191–1197.
Varga, C., Lee, S.Y., Soltesz, I. (2010). Target-selective GABAergic control of entorhinal cortex output. Nat. Neurosci. 13, 822–4.
Wills, T.J., Barry, C., Cacucci, F. (2012). The abrupt development of adult-like grid cell firing in the medial entorhinal cortex. Front. Neural Circuits 6, 21. doi: 10.3389.