Explaining Differences in Sub-National Patterns of Clean Technology
Transfer to China and India
∗Patrick Bayer†
Washington University in St. Louis
Johannes Urpelainen
Columbia University
Alice Xu
Harvard University
9 May 2014
Abstract
The Kyoto Protocol’s Clean Development Mechanism (CDM) is capable of incentivizing the international transfer of environmentally sound technologies. Given that both countries are expected to have similar incentives when managing the distribution of technology transfer within the country, why does the sub-national patterns in allocation of projects with tech-nology transfer differ across the two countries? Using comparable political-economic data compiled for China and India, we offer an explanation for these differences. In China, where the government regards the CDM as a tool for achieving sustainable development, technol-ogy transfer is concentrated in provinces that need it the most and are most conducive to receiving transfers (i.e., economically less developed, yet heavily industrialized provinces). In India, where the government takes on a “laissez faire” approach to the CDM, neither level of economic development nor that of industrialization affects clean technology transfer. In this regard, although the incentives are similar, the capacity to pursue them are not comparable. We test these hypotheses using data on CDM technology transfer across Chinese provinces and Indian states during a six-year period from 2004 to 2010.
∗This article was written during a research stay funded by an ERP fellowship of theStudienstiftung des deutschen
Volkes. Patrick Bayer gratefully acknowledges this generous funding and is thankful for the hospitality of Columbia University. He is also thankful for a postdoctoral fellowship at Washington University in St. Louis from theGerman Academic Exchange Service (DAAD). We thank Valerie Pinkerton and Sung Eun Kim for comments on a previous draft.
†Corresponding author. Department of Political Science. Washington University in St. Louis, One Brookings Drive,
1 Introduction
China and India are two of the most attractive hosts of climate mitigation projects implemented
under the Kyoto Protocol’s Clean Development Mechanism (CDM). The CDM allows
indus-trialized countries to procure carbon emissions credits at lower cost by working with project
developers in developing, host countries. Moreover, the CDM provides more opportunities for
the transfer of foreign clean technology to developing countries (Dechezleprêtre, Glachant, and
Ménière, 2008; Popp, 2011). For example, a Chinese project developer could acquire advanced
biomass combustion technologies from Sweden to increase the profitability of carbon abatement.
Although both China and India have tremendous potential for climate mitigation and have
incentives for promoting similar trends in CDM technology transfer distribution, regional
pat-terns of foreign technology transfer differ between the two countries. Across Indian states, the
numbers of projects implemented in a given year with and without technology transfer are highly
correlated(r = +0.64). However, this correlation is low across Chinese provinces(r = +0.20).1
Disregarding broad differences in the political and economic systems of China and India (e.g.,
In-dia’s federal democracy and China’s one-party authoritarianism), there is not a readily available
explanation for why the patterns in CDM technology transfer should differ in these two similar
CDM host countries.
Understanding technology transfer to China and India is important because of their status
as two major emerging economies. China, with about 130-195 million people living in poverty,
lacks sufficient financial resources to successfully undergo the transition to a low carbon
econ-omy without external technological assistance (Chen and Ravallion, 2008). Thus, the role of
international mechanisms, such as the CDM, that transfer advanced technologies is critical for
this transition (Wang, 2010). Similarly, India’s economy has dramatically expanded during the
last decade, and the country’s carbon dioxide emissions are concomitantly increasing. Without
improved access to clean technology, it would be implausible for India to curtail the rise in its
carbon dioxide emissions.
To explain why the distribution of projects with foreign technology transfer differs between
the two countries of interest, we consider differences in national policy. The Chinese government
has an active agenda for using the CDM to promote economic development in less developed
provinces (Benecke, 2009), while the Indian government lacks a coherent national strategy for the
CDM (Ganapati and Liu, 2009). China’s commitment to this agenda allows it to direct technology
transfers to less developed provinces with a lot of mitigation potential in the industrial sector.
In contrast, India lacks a national policy for guiding technology transfers to areas that need
them the most. More generally, the Chinese government’s greater capacity to direct sub-national
governance allows it to use the CDM for achieving development-related goals to a greater extent
than the Indian government.
Empirically, we explore the sub-national distribution of CDM projects with clean
technol-ogy transfer in China and India during the 2004–2010 period. Our main empirical innovation is
the compilation of strictly comparable sub-national data for key variables, including economic
wealth and industrial capacity, in both China and India. Since our explanation has unambiguous
implications for the sub-national determinants of CDM technology transfer in the two countries,
it can be tested through an empirical investigation of how these determinants differ between
China and India. If the explanation is valid, technology transfers to China should be
concen-trated in provinces where they contribute the most to economic development, while technology
transfers to India should not depend on their expected contribution to the national economy.
We show that while economic wealth is negatively associated with CDM technology transfer
in China, the association between Chinese industrial capacity and CDM technology is positive.
In stark contrast, we find no association between these variables for India. This suggests that
Chinese national institutions are strategically pushing projects with technology transfer to less
wealthy and more industrialized provinces, while India is not pursuing such a strategy. Indeed,
the China-India difference cannot be attributed to variation in the need for technology transfer
without considering policy differences. If the need for technology transfer were the sole driver
of sub-national variation, then India and China should exhibit similar patterns. Instead, poor but
industrialized Indian states fail to secure more technology transfer projects than their wealthy
The implications of our study for the research agenda on clean technology transfer are
no-table. Existing quantitative studies (Dechezleprêtre, Glachant, and Ménière, 2008; UNFCCC,
2010; Bayer and Urpelainen, 2013) emphasize variation across countries, but we find that
sub-national variation is equally essential for explaining the CDM’s potential for clean technology
transfer. There is a world of difference between transferring clean technology to already
sophis-ticated sub-national jurisdictions, such as Shanghai, and introducing clean technology to less
developed jurisdictions, such as the majority of northern Indian states and much of inland China
(Lewis, 2007; Brewer, 2008; Ockwell et al., 2008; Doranova, Costa, and Duysters, 2010)
2 Clean Development Mechanism and Technology Transfer
The CDM allows industrialized countries to achieve their emissions reductions under the Kyoto
Protocol at a lower cost (de Jong and Walet, 2004), while improving sustainable development
and encouraging technological innovation in the developing countries that host them (Streck and
Lin, 2008; Lecocq and Ambrosi, 2007). The abatement credits from projects generate Certified
Emissions Reductions (CERs) that can be sold to foreign buyers, such as industrialized countries
with Kyoto commitments. Although technology transfer is not an official goal of the CDM,
the mechanism could fulfill its criterion of sustainable development through clean technology
transfers to non-Annex I countries.2
In fact, the CDM is the largest market-based mechanism that encourages technology transfers
to developing countries (Schneider, Holzer, and Hoffman, 2008). Between the years 2005 and 2006
alone, the number of CDM projects inclusive of technology transfers is valued at an investment
flow of around nine billion Euro (Capoor and Ambrosi, 2007). Access to innovative technologies
can increase the efficiency of emission abatement in developing countries (de Coninck, Haake,
and van der Linden, 2007). Thus, CDM project developers in host countries regularly seek foreign
technologies to maximize profits from project implementation.
Studies of the CDM have focused on the prevalence and quality of technology transfers under
CDM projects, as well as on the specific project characteristics that promote technology transfer.
2Article 10(c) of the Kyoto Protocol does specify the need for all Parties involved to cooperate in the development,
Seres, Haites, and Murphy (2009) find that technology transfer depends on both project type and
project size. More specifically, transfer is more common for larger CDM projects, and technology
and technical skill transfers are highly uneven across different project types. While almost all
industrial gas projects on the destruction of, e.g., HFC or N2O emissions, are inclusive of
tech-nology transfers, the complete opposite trend prevails for afforestation projects (Chatterjee, 2012;
Seres, Haites, and Murphy, 2009). Additionally, technology transfer is, for obvious reasons, less
common in projects that are implemented unilaterally, without a foreign partner (Haites, Duan,
and Seres, 2006; Seres, Haites, and Murphy, 2009).
Some studies examine how a host country’s political and economic institutions at the national
level affect CDM technology transfer. Haites, Duan, and Seres (2006) claim that transfer is not
closely associated with either GDP per capita or country size. Dechezleprêtre, Glachant, and
Ménière (2008) find a relationship between a country’s existing technological capabilities and
technology transfer. Specifically, countries with high technology capability attract more transfers
in the energy sector and the chemicals industry, while receiving few transfers in agricultural
CDM projects. Bayer and Urpelainen (2013) present a formal model of North-South technology
transfer, demonstrating that technology transfer is likely to occur when (i) the technology in
focus has limited commercial potential and (ii) the host country lacks the capacity to absorb the
new technology for commercial use.
Despite the growing literature on CDM technology transfer, there is a shortage of studies that
examine sub-national variation in technology transfer in different national contexts. This article
analyzes the regional factors that encourage technology transfer and how these local
character-istics interact with the national context. More specially, we investigate how technology transfer
varies across regions (i.e., Chinese provinces and Indian states) in the two major CDM host
coun-tries, China and India, with distinctively different policy approaches toward the CDM.
3 Hypotheses on Technology Transfer to China and India
Our theory examines sub-national variation in CDM technology transfer under different national
conditions. We argue that in China, where the national government actively promotes the CDM
activity attract technology transfer. In India, where the national government has adopted a
“lais-sez faire” approach to the CDM (Benecke, 2009), and hence does not actively use it to further
economic goals, such associations should be much weaker. Both countries would reap economic
benefits by directing CDM projects with technology transfer to the least developed regions, but
only China’s national institutions promote this strategy. In other words, China has more
in-stitutional and structural capacity to government the CDM in a way that promotes economic
development where it is needed the most.
The differences in the institutional structure between these two countries account for this
discrepancy in national policy orientation towards the CDM. The Chinese government is
char-acterized as a centralized system, whereas the Indian government is a democratic, federal state.
While the Chinese government wields considerable power in setting policy goals at the national
level, the Indian government has merely taken on a “market facilitation” role in directing the
CDM, placing the coordination of the CDM largely in the hands of the private sector (Benecke,
2009; Ganapati and Liu, 2008, 2009; Bayer, Urpelainen, and Xu, 2014).
China’s ability to coordinate CDM projects stems from institutional factors. As Ganapati and
Liu (2008) argue, in China the agency responsible for the CDM, the National Development and
Reform Commission, is a powerful part of the central government. They further point out that
in the case of the CDM, “[i]n China’s unitary state, provincial governments are the arms of the
central government ... Provincial agencies have little [autonomous] voice in the CDM process”
(Ganapati and Liu, 2008: 355). This centralized system, which is in turn enabled by China’s
centralized policy process, allows China to adopt an effective, coordinated national strategy for
utilizing the CDM.
This is not to deny that the Chinese system is one of “fragmented authoritarianism” with
multiple centers of power (Lieberthal and Oksenberg, 1990). Given the shared incentives of
different organizations in the central government to maximize economic development, however,
these multiple centers of power appear to not have engaged in conflict over the CDM’s goals. As
long as they agree on the need to promote the development of the poorer and less industrialized
priorities to guide decisions regarding technology transfer under the CDM.
In India, the realization of national policy goals is a more gradual process as the institutional
structure is decentralized. Compared to Chinese provinces, each Indian state has more autonomy
in setting its own criteria and policies for directing the CDM. According to Benecke (2009: 362),
“[d]ue to the federal system, Indian states have quite substantial political say in some political
areas, such as environment and energy.” In this regard, a coordinated strategy is difficult to carry
out across different Indian states, which explains why the Indian government seems to embrace
a rather hands-off national approach towards the CDM. Given how much power states have
over CDM policy, it is difficult for the central government in New Delhi to explicitly coordinate
CDM project implementation across states. A full reform of the environmental administration
for improved effectiveness, in turn, would be a major effort that the central government has, as
of today, not managed to implement.
Moreover, India’s administrative structure contributes to the weakness of the CDM
adminis-tration. Ganapati and Liu (2008: 356) note that India’s Ministry of Environment and Forests is
a weak agency, and this institutional weakness contributes to the lackluster performance of the
CDM. Given that India does not have a strong administrative apparatus for the management of
environmental affairs, it faces practical difficulties in coordinating CDM projects.
In summary, while China and India face similar problems, their governments could not be
more different in their responses to sustainable development from the CDM. The Chinese
gov-ernment adopts centralized policies and uses the CDM as a strategic tool for promoting
eco-nomic development (Schroeder, 2009b), while India’s approach is less coordinated and more in
the hands of market forces (Benecke, 2009). Given this remarkable difference, we propose that
the sub-national determinants of clean technology transfer differ in China and India. We now
develop our expectations for each country, and these expectations are tested against data in the
empirical section.
3.1 Expectations for China
The Chinese government has taken a proactive role in attracting investment through the CDM
acquire advanced technologies from abroad. This role of the CDM is often deemed more crucial
than promoting sustainable development (Gao, 2008). Consistent with Chinese governance
ideol-ogy and the style of policymaking, the pursued policies towards the CDM are highly centralized.
This is reflected in the government’s insistence that at least 51% of CDM project ownership must
be in Chinese hands (Newell, 2009).
The government also targets specific priority areas for CDM projects, such as energy efficiency
improvement, the development of renewable energy, and methane recovery and utilization, while
the Indian government has not set out national priority areas (Takahashi and Zhang, 2011). The
Chinese government is able to strategically use tax policy as a tool for channeling CDM
invest-ment to areas that would otherwise be less attractive for international investors (Newell, 2009).
For example, the designated priority sectors only incur a 2% tax rate on issued certified emissions
reduction (CER) revenue, while the “royalty charges” on industrial gas projects can be as high
as a rate of 65% (Schroeder, 2009a; Takahashi and Zhang, 2011). In this regard, tax policy helps
align investment with national development priorities (Schroeder, 2009a). In a similar vein, the
Chinese government established CDM Service Centers in its provinces to promote CDM project
allocation and to entice technology transfer, one of benefits that swayed the Chinese government
to take a favorable position vis-á-vis the CDM (Schroeder, 2009a). Although these examples do
not directly shed light on the geography of project distribution in China, they show that the
country has a purposeful and coordinated strategy for the CDM at the national level.
Notwith-standing that governmental influence can only be indirect in a market-based scheme like the
CDM, for our argument to hold it suffices that the Chinese government takes a more principled
approach than India’s “laissez-faire” policy (Bayer, Urpelainen, and Xu, 2014).
Given this governmental strategy to promote foreign investment through the CDM, we
ex-pect the Chinese government to actively channel CDM projects with technology transfers to the
provinces that need them the most. Since the most underdeveloped provinces demonstrate both
greater need and greater benefits from technology transfer, we expect a negative correlation
be-tween development status and the amount of CDM projects with technology transfer. In other
that already have a threshold level of wealth and technology.
Hypothesis 1(economic wealth and CDM technology transfer in China). In China, provinces with
lower GDP per capita receive fewer incidences of CDM technology transfer than wealthier provinces.
If our theory is wrong, then we would expect the opposite effect of economic wealth on
technology transfer. CDM projects may not be feasible in the less developed provinces without
new technology. Although the Chinese government may strive to exploit the higher returns to
each initial unit of technology transfer to poorer provinces, these provinces may lack the basic
technical knowledge and skillsets to absorb these technologies. In this regard, wealthier provinces
with at least a threshold level of technology, and hence absorptive capacity, may prove to be better
candidates for channeling technology transfers through the CDM. Given these considerations, the
relationship between economic wealth and the amount of CDM technology transfer could run in
the opposite direction.
Next, we expect industrial production to be positively associated with technology transfer.
Since promoting energy efficiency in industrial production is often made possible by the adoption
of modern equipment, foreign technology transfers are particularly essential for reducing carbon
emissions from industrial activities. Compared to sectors with less technological potential, such
as agriculture or reforestation, industrial CDM projects simply require more advanced
technolo-gies. Thus, we expect CDM projects in provinces with large industrial capacity to demonstrate a
greater need for technology transfers.
This trend is further supported by the Chinese government’s inclination to govern CDM
al-location. The government has openly expressed a priority in energy sector projects because such
projects “shall bring about GHG emission reductions, shall bring additional financial resources [,
and] shall bring technology transfer” (Lu, 2004: 56). Foreign technology transfer under the CDM
is crucial for achieving these efficiency gains. Hence, we expect a positive relationship between
industrial capacity and technology transfer through the CDM.
Hypothesis 2 (industrial capacity and CDM technology transfer in China). In China, provinces
with high industrial capacity experience more technology transfer from CDM projects than provinces with
Again, if our theory is not valid, a different hypothesis can be proposed. It could be the
case that industrial capacity discourages technology transfer, since regions with higher industrial
capacity may have a smaller technology differential, resulting in lower valuation of transfers in
these provinces than in less industrialized ones. Although industrial activities create substantial
opportunities for reducing carbon emissions, a greater capacity for industrial production could
also signal a higher threshold of existing technologies. In this regard, the relationship could work
in the opposite direction if investors hold the impression that the marginal returns to each unit
of technology transfer is lower in a industrialized region.
3.2 Expectations for India
In contrast to China’s centralized politics, the Indian government has developed a “laissez faire”
CDM policy. Essentially, the allocation of CDM projects and the diffusion of technology is
en-tirely left to the market dynamics (Benecke, 2009; Fuhr and Lederer, 2009; Newell, 2009). The
Indian government neither restricts nor promotes the development of the CDM carbon market
in different regions. Although the regulatory bodies that direct the CDM have adequate human,
technical, and financial resources to strengthen control over the CDM, India’s federal government
lacks the political will to employ the CDM as a tool for developing economically less developed
states (Benecke, 2009) and there is a clear need for better policy (Nautiyal and Varun, 2012).
Unlike China’s active approach to the CDM, India’s “laissez faire” approach implies that the
association between economic wealth and technology transfer should be weak and possibly even
slightly positive. Because each state’s absorptive capacity depends largely on the technological
stock of its private firms (Ockwell et al., 2007), less developed states with technologically
un-sophisticated firms have a lower capacity to adopt new innovations.3 Without the support of
the government, poor regions are likely to have a higher incidence of unsophiscated firms with
minimal absorptive capacity. As mentioned in the discussion of the GDP per capita and CDM
technology transfer relationship in China, regions that lack at least a threshold level of technical
3At the firm level, technology transfer often results from cooperation between multinational companies, such as
knowledge and skillsets may not have the absorptive capacity to effectuate technology transfers
through the CDM.
Insufficient absorptive capacity would prove to be an even greater hindrance to technology
transfer in a country that does not actively work to promote technology upgrades in these regions
that demonstrate need. Without state support the private sector retains control over the CDM.
While the demonstrated need for new technologies may attract private sector investment in these
particular states, the lack of absorptive capacity discourages it.
In other words, the need for new technologies and the dearth of absorptive capacity have
contradictory effects in attracting private sector CDM investment in less developed states. The
two effects could essentially cancel out, and hence the association between economic wealth
and CDM technology transfer in India should be weak and could run in either direction. We
hypothesize that insufficient absorptive capacity in the absence of supporting state policy is the
more important factor in India, making the association slightly positive.
Hypothesis 3(economic wealth and CDM technology transfer in India). In India, wealthier states
experience more technology transfer from CDM projects than poorer provinces. However, this positive
effect is expected to be weak.
As to industrial capacity, we expect a positive, albeit weak, association. As in China, industrial
capacity creates demand for CDM technology transfer. But, unlike China, the Indian government
is not actively promoting the use of the CDM to promote industrial growth. While high industrial
capacity creates demand for more foreign technology transfer, this demand may not always be
matched in India given the government’s lack of strategic policy. Therefore, we expect a positive,
but modest, relationship between industrial capacity and technology transfer.
Hypothesis 4(industrial capacity and CDM technology transfer in India). In India, provinces with
high industrial capacity experience more technology transfer from CDM projects than provinces with less
industrial capacity. However, this positive effect is expected to be weak.
Here, we do not consider competing hypotheses. Since our hypotheses for India are null
or negative associations between these factors and projects with technology transfers would raise
the question of what factors are driving these associations.
4 Research Design
Empirically, we examine CDM technology transfer in 30 Chinese provinces4and 27 Indian states.5
The dataset includes 4,460 CDM projects (2,674 in China and 1,786 in India) that were registered,
waiting for registration, or at the validation stage during years 2004 to 2010. 518 of these projects
feature technology transfer, as coded by UNFCCC (2010).6 Since our dataset is comprehensive,
sample selection bias is not of concern.
The unit of analysis is province-year. We have a total of 298 panel observations, yielding a
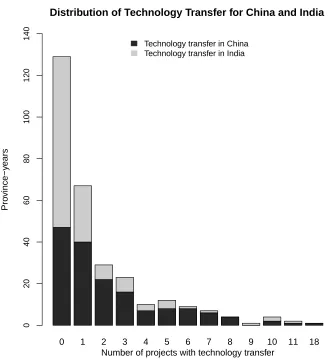
fairly balanced panel dataset. Our dependent variable records the number of CDM projectswith
technology transfer for each province-year. Figure 1 shows that the dependent variable is zero
for 40% of the observations, while there is just one province-year (in China) in which 18 CDM
projects transfer technology. We account for this non-normal count distribution by estimating
zero-inflated negative binomial models.
[Figure 1 about here.]
To further test our hypotheses, we also implement a placebo test. We re-estimate our main
models using the number of CDM projectswithouttechnology transfer as our dependent variable.
In this specification, we expect the observed effects from the main models to be weaker and to lose
statistical significance because our theory is predicated on the centrality of technology transfer
for sustainable development.
Before elaborating on the dependent variable, we must comment on the relevance of other
differences between China and India to our empirical analysis. Although China is wealthier and
4Officially, China administers 33 sub-national divisions, but CDM project data is not available for Tibet and the
two special administrative regions, Hong Kong and Macau. This leaves us with 30 “provinces.”
5In India, there are 35 sub-national administrative units: 28 states and 7 Union Territories. However, with the
exception of Delhi, we data the Union Territories (i.e., Andaman and Nicobar Islands, Chandigarh, Dadra and Nagar Haveli, Daman and Diu, Lakshadweep, and Pondicherry) and for the states of Mizoram and Nagaland is not available. For further information on Indian states, see http://india.gov.in/knowindia/state_uts.php. Accessed June 16, 2012.
6CDM data is available fromhttp://cdmpipeline.org. Accessed July 11, 2012. Of all the 6,977 CDM projects
more industrialized than India, there is considerable variation within each country. Thus,
differ-ences in sub-national variation cannot be ascribed to overall levels of industrialization. Politically,
China’s authoritarian institutions differ from India’s federal democracy, where elections play an
important factor in determining state policy for the CDM (Bayer, Urpelainen, and Xu, 2014).
Al-though an authoritarian ruler’s incentives and ability to support CDM technology transfer may
differ from a democratic ruler’s incentives and ability, these effects should manifest themselves
through policy. China’s coordinated national approach to the CDM may stem from the country’s
authoritarian political institutions, but without a strategic policy to support clean technology
transfer to less developed provinces, authoritarian institutionsper seshould not allow less
devel-oped provinces to reap the benefits of technology transfer (Bayer, Urpelainen, and Wallace, 2013).
Finally, China’s provincial system has historically been more stable. While the number of Indian
states has grown over time, with Uttarakhand and Jharkhand being formed in the year 2000, the
state structure has not changed during the period of analysis.
4.1 Dependent Variable
Our dependent variable is the number of CDM projects by province-year that are coded to have
technology transfer. From the project dataset provided by the CDM/JI Pipeline Database, we
construct our dependent variable by summing the incidences of technology transfer for each
province and each year.7
An alternative to counting projects with technology transfer is to compute the proportion of
projects that feature technology transfer. Upon closer inspection, however, this approach appears
flawed. All else constant, a province that draws dozens of projects with technology transfer is
clearly doing better than a province that draws one project with technology transfer, even if the
former also draws projects without technology transfer.
Similarly, we also check that the number of CDM projects is indicative of the amount of
reduced CO2 emissions. One might be concerned that few large-scale projects may have a larger
effect for sustainable development and emissions reductions than many smaller ones do. If this
is the case, measuring counts of technology transfer would be a pathological dependent variable.
We find that both the total and technology transfer number of CDM projects are highly correlated
with expected CO2emission reductions.8
The IPCC defines technology transfer as “a broad set of processes covering the flows of
know-how, experience and equipment for mitigating and adapting to climate change amongst
different stakeholders such as governments, private sector entities, financial institutions,
non-governmental organizations (NGOs) and research/education institutions” (UNFCCC, 2010: 13).
Adopting this definition, the UNFCCC in its 2010 report coded all registered CDM projects
for presence of foreign technology transfer based on an assessment of existing CDM project
documents.9
To understand how foreign technology transfers can result under a CDM project, consider
CDM0472, the largest CDM project in China that was implemented in 2006 in the eastern
province of Jiangsu. This project expects to reduce annual CO2 emissions by 10 million tons by
destroying HFC23 emissions. The Project Design Document clearly states that this “project will
adopt a thermal decomposition technology to destruct HFC23 from a French company VICHEM”
and emphasizes that “[t]hrough the transfer of VICHEM’s technology to the proposed project,
... the relevant technical know-how can be transferred to China” (CDM0472, 2006: 6f.). Hence,
this project is coded as a CDM project with technology transfer. On the other hand, the large
hydroelectricity project CDM4412 hosted by the Indian state of Himachal Pradesh is coded as
a non-tech project. The project document specifically mentions that “[t]he project activity
uti-lizes conventional state-of-art environmentally safe and sound hydropower technology and hence
there is no technology transfer involved” (CDM4412, 2008: 9).
Figure 2 below illustrates the geographical distribution of CDM projects with technology
transfers in China and India. In addition, the figure also visualizes the geographical distribution
of our two main independent variables: average economic wealth and industrial capacity, both
measured on per capita basis. Overall, the figure offers preliminary support for our
hypothe-8As shown in the supplementary appendix, correlation coefficients vary fromr = +0.497 for total Chinese CDM
projects and 2012 CERs tor= +0.839 for total Indian CDM projects and 2012 CERs. All correlation coefficients are strongly positive and highly statistically significant.
9In fact, the UNFCCC (2010) report also distinguishes between the presence of equipment transfers, knowledge
ses, but also calls for a systematic multivariate analysis. In China, CDM technology transfers
seem to be more common in less developed – yet relatively heavily industrialized –
northeast-ern provinces. In contrast, CDM technology transfers in India are concentrated in the wealthier
southwestern states along the coast of the Indian Ocean.
[Figure 2 about here.]
4.2 Independent Variables
In the previous section, we formulated four hypotheses about the impact of economic wealth and
industrial capacity on the number of CDM projects with technology transfer across both China
and India. Since we pool Chinese and Indian CDM projects to systematically examine country
differences, a major challenge is to construct comparable data for our empirical analysis.
To address the first set of hypotheses (i.e., Hypotheses 1 and 3) on the effect of wealth on
tech-nology transfer, we use data on real GDP per capita in US$ in 2005 constant prices. For China,
per capita GDP data is provided by the University of Michigan’s China Data Online database10,
while Indian data comes from the Directorate of Economics Statistics of the Indian state
govern-ments.11 Since the China Data Online database is built on official government sources, both the
Chinese and Indian data are official. To construct the variable, we converted the values of per
capita GDP of Chinese provinces, measured in yuan and current prices, and those of per capita
GDP of Indian states, measured in rupees and constant prices at different years, into 2005 US$.12
In making these adjustments, we can compare variation in per capita income at the sub-national
level across the two countries.
The second set of hypotheses link industrial capacity in China and India to technology
trans-fers in the CDM scheme. We operationalize this variable as the per capita industrial production
in US$, with constant 2005 prices. Data is retrieved from China Data Online and from the
In-10Seehttp://chinadataonline.org. Accessed March 20, 2012.
11Seehttp://planningcommission.nic.in/data/datatable/. Accessed April 25, 2012.
12For the data on Chinese provinces, we use real GDP growth data provided by China Data Online to account for
dian Annual Survey Industries.13 We first converted figures of industrial production, originally
measured in current prices, into 2005 constant prices and then into US$.14 Following these steps,
we get at a comparable measure for industrial capacity for Chinese provinces and Indian states.
We logarithmize both per capita GDP and industrial capacity to account for the skewness of the
statistical distributions of the two variables. The Chinese and Indian variables are both reported
in gross terms and, therefore, intended to capture the same quantity. Both countries conduct
an entire census of all large enterprises, while collecting data from smaller enterprises through a
representative sample. Technical differences notwithstanding, the main concern with data quality
is the lack of transparency of the Chinese data at the provincial level.
Since we are primarily interested in the ways in which the effects of these variables differ
for China and India, we interact both economic wealth and industrial capacity with a dummy
variable for Indian observations. The binary indicator, which is also included into our statistical
model (Brambor, Clark, and Golder, 2006), scores “1” for all Indian province-years, and zero
otherwise.
4.3 Control Variables
We also include several control variables. Although data limitations prevent us from including a
large number of controls, we were able to account for a set of important political and economic
variables.
For one, we include electricity consumption per capita and a dummy variable for political
change as main controls. Both variables are interacted with the India dummy to allow for country
heterogeneity. Electricity consumption per capita is included to control for the potential for
emissions reductions in the energy sector.15 To account for the skewness of the distribution, we
again logarithmize our electricity consumption variable.
We also control for political change. The measure intends to capture political uncertainty
13The variables used are “Total Output” (India) and “Gross Industrial Output” (China). For India, see http:
//mospi.nic.in/mospi_new/upload/asi/ASI_main.htm?status=1&menu_id=88. Accessed July 7, 2012.
14The deflators were provided by the IMF. Seehttp://elibrary-data.imf.org/public/FrameReport.aspx?v=3&
c=20840382. Accessed July 7, 2012.
15For China, the data are from China Data Online. For India, the data is from the Ministry of Power. Seehttp://
resulting from changes in sub-national leadership. For China, we use a binary indicator that
scores “1” for when either the incumbent party secretary or the governor of a province leaves
office and zero for all other observations. This measure is based on Bayer, Urpelainen, and
Wallace (2013) and reflects the idea that individual leader characteristics play a critical role in
Chinese politics, as shown in Shih, Adolph, and Liu (2012). For India, we simply code all election
years as “1” and zero otherwise. In a robustness check, we also consider the possibility of
governmental, instead of political change and thus only code election years as “1” in which the
incumbent party at the subnational level changes.16 In the full sample, we record 59 incidences
of political change out of 162 observations in China (36%) and 26 out of 136 in India (19%). We
include this control variable because change in political leadership can pose risks for projects with
large-scale technology transfer.17 Given that these projects involve capital-intensive investments,
project developers look for stable investment conditions. The political uncertainty that surrounds
leadership changes makes technology inventors and project developers hesitant. What is more,
CDM renewable energy projects require subsidies.18 This discourages investment until political
uncertainty is reduced.
Next, we add a logarithmized population variable into our statistical model, using it as the
inflator in our zero-inflated negative binomial model.19 The data for China come from China
Data Online; for India, we use census data from the Office of the Registrar General and Census
Commissioner, India.20 Since the official Indian data is only available for 2001 and 2011, we
interpolate population data with a linear trend for 2004 to 2010. This seems unproblematic as
population figures develop in a monotonic and stable fashion.
To ensure that variation in technology transfer is not only driven by variation in the total
number of CDM projects, we also estimate models that include a count of CDM projectswithout
technology transfer. This control variable allows us to avoid unduly conflating our theoretical
16Election data come from the Election Commission of India and are available from http://eci.nic.in/eci_
main1/ElectionStatistics.aspx. Accessed on April 13, 2014.
17In our dataset, 70 out of 298 province-years have large-scale projects. This accounts for about one quarter of the
dataset.
18Overall, only 38 out of 298 province-years (13%) do not have a single renewable energy project. 19See the supplementary appendix for a histogram.
expectations with scale effects.
Finally, we account for temporal trends in the data by adding a linear time trend to our model.
Since the need for technology transfers may decrease over time because of growing technological
prowess, or rising concerns about reverse-engineering (Bayer and Urpelainen, 2013), controlling
for time patterns is essential.
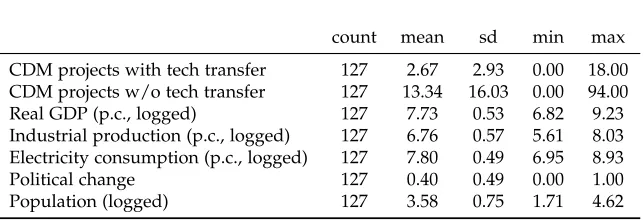
In Tables 1 and 2, we present summary statistics and correlation matrices.21 While the two
countries are similar regarding projects without technology transfer, China hosts more than twice
as many CDM projects with technology transfer as does India. This aligns with our argument.
Note also that there is no statistically significant correlation between economic wealth and
tech-nology transfer, while a positive association between industrial production capacity and
technol-ogy transfer exists. This calls for a more systematic statistical analysis.
[Table 1 about here.]
[Table 2 about here.]
4.4 Statistical Model
As mentioned above, we estimate a zero-inflated negative binomial model. Under the assumption
that larger provinces should see more technology transfer than smaller ones, population is a good
variable to use in the inflation stage. To further evaluate our model choice, we apply the Vuong
(1989) test for model selection. We find that for all our models, a zero-inflated negative binomial
specification is preferred to a standard negative binomial model that does not specifically account
for oversampling of observations with zero counts as dependent variable.22 Standard errors are
clustered by province or state.
5 Results
The results corroborate our hypotheses. For China, we find that a negative relationship between
per capita GDP and the incidence of technology transfer exists, while the association between
21For summary statistics and a correlation matrix for the entire sample, see the supplementary appendix.
22For models (1) to (3) in Table 3 below, the normally distributed test statistics arez=2.24,z=2.20, andz=1.44,
industrial capacity and technology transfer is strong and positive. This set of findings can be
contrasted with our results from the analysis of Indian states. In India, the relationships under
analysis are not statistically significant. In this section, we first present the main findings from
econometric model estimations before discussing the robustness of our results.
5.1 Main Findings
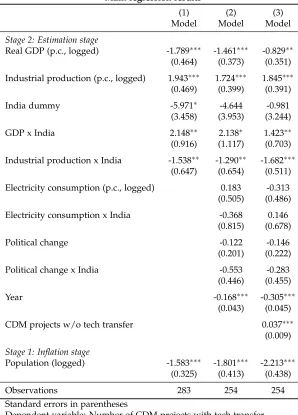
Table 3 shows the main regression results for three zero-inflated negative binomial models.
Model (1) only includes our main independent variables, per capita GDP, industrial capacity,
the interactions of the preceding variables with the India dummy, the India dummy itself, and
the temporal trend. Model (2) adds electricity consumption and political change as controls,
while model (3) also accounts for the number of CDM projects without technology transfer.
[Table 3 about here.]
Notwithstanding complications with the interpretation of statistical significance in non-linear
models with interaction effects (Ai and Norton, 2003; Greene, 2010), the coefficients for China
are directly interpretable from the regression table as the India dummy is zero (Brambor, Clark,
and Golder, 2006). The coefficient of economic wealth is always negative and highly statistically
significant; for industrial capacity, all coefficients are positive and statistically significant.
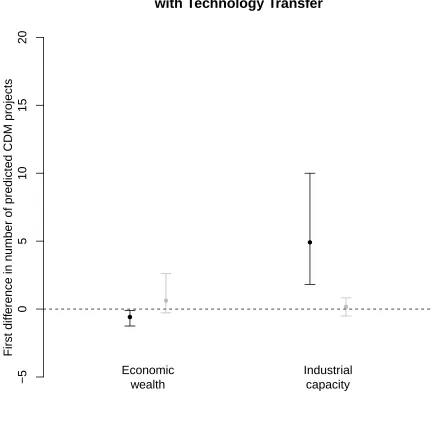
To interpret the coefficients for India, we simulate substantive effects for our two key
explana-tory variables, economic wealth and industrial capacity (King, Tomz, and Wittenberg, 2000).
Fig-ure 3 illustrates these effects separately for China (black lines) and India (gray lines). All our
simulations are based on 1,000 draws from a multivariate normal distribution with model (3) as
the statistical specification; continuous variables are set at their means and the median year 2008
is used for time effects.
[Figure 3 about here.]
In China, provinces with a higher level of per capita GDP host, on average, 0.59 fewer CDM
projects with technology transfer than do the poorer provinces. Confidence intervals range from
finding that illustrates the Chinese government’s policy to promote CDM projects and technology
transfer in less developed provinces in inland China. A change in industrial capacity from the
mean to one standard deviation above the mean increases the number of technology intensive
CDM projects by 4.91, with 1.82 and 9.99 as the lower and upper bounds, respectively. Provinces
with high industrial capacity receive considerably more technology transfer, a finding that once
again suggests the efficient use of the CDM by the Chinese administration. Given the carbon
content of manufacturing, clean technology transfer can help reduce carbon emissions. This
conforms with the Chinese government’s “controlled” CDM allocation policy, which seeks to
promote sustainable development in remote places across the country (Popp, 2011).
On the contrary, the Indian government has never actively pursued policies to promote
tech-nological advancement through the CDM. In the Indian case, changes for both economic wealth
and industrial capacity from means to one standard deviation above the mean do not statistically
significantly affect the number of CDM projects with technology transfer. While the effect size
for changes in GDP, despite different signs, is comparable between China and India, changes in
industrial capacity produce an increase in the number of CDM projects with technology transfer
that is about 30 times higher in China than in India. According to our theory, this dramatic
difference in effect size reflects strategic policy in China. In addition to China’s securing more
CDM technology transfer than India, the Chinese technology transfers are also better targeted
than the Indian ones.
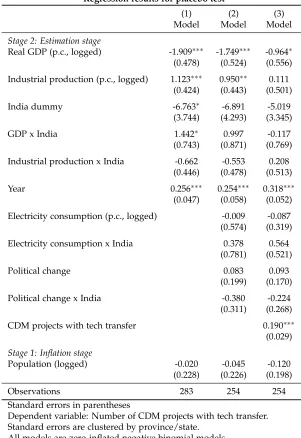
5.2 Robustness Checks
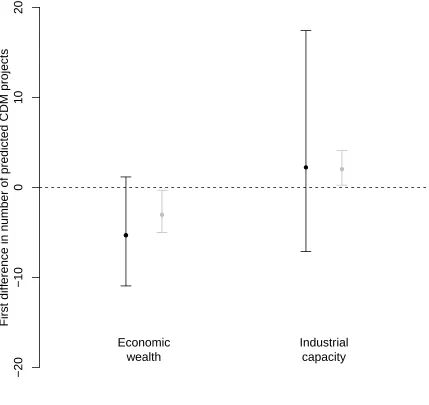
All our robustness checks can be found in the supplementary appendix. To check that our
analysis captures the effects of our main explanatory variables on technology transfer, we first
re-estimate our models using the number of projectswithouttechnology transfer as the dependent
variable. This placebo test is presented in Table 4, with the substantive effects plotted in Figure 4.
[Table 4 about here.]
The simulations of the substantive effects are again based on model (3), while keeping
previous simulations, Figure 4 indicates that neither economic wealth nor industrial capacity
statistically significantly predict the number of non-tech CDM projects in China. The results
for India paint a different picture. While GDP reduces the number of non-tech CDM projects
on average by 3.03, with -0.31 and -5.02 as lower and upper confidence bounds, an increase of
industrial capacity from the mean to one standard deviation above the mean increases CDM
projects without technology transfer by 2.02, with 0.25 and 5.09 as lower and upper bounds. This
finding highlights the difference between Chinese and Indian politics in attracting CDM projects
without technology transfers. In India, poorer states and those states with a large industrial
base host more CDM projects than richer and less industrialized ones, but these projects are less
valuable for sustainable development because they lack technology transfer. The Indian
govern-ment’s laissez-faire approach toward the CDM fails to attract those projects that would be the
most useful for the country’s technological development.
[Figure 4 about here.]
Returning again to the model for projects with technology transfer, we conducted further
tests. Since the highly significant and strongly negative coefficient of the time trend suggests
temporal dependence, we consolidate our analysis by separately excluding all projects
imple-mented in 2004 and 2010.23 This shows that our results are not driven by undue effects of the
early or late years of the CDM scheme.
Moreover, CDM project implementation, especially for renewable projects, depends on
geo-graphical, physical, and political conditions. To account for differences in renewable energy
po-tential, we present additional models in the supplementary appendix that include binary control
variables for wind, solar, and hydroelectricity potential.24 Most importantly, our key results
con-tinue to hold. As to the renewable potential controls, only wind potential seems to be positively
associated with technology transfer in CDM projects. Given that in particular solar technology
was mostly not yet commercially viable during the years of observation in our study, 2004–2010,
23While dropping the first year reduces the number of CDM projects by only eleven, seven of which feature
tech-nology transfer, excluding projects from 2010 reduces the sample size by about 11%. Out of 4,460 CDM projects, 939 are implemented in 2010 with 56 or about 6% carrying technology transfers.
it makes intuitive sense that technologically advanced wind projects carry comparatively high
levels of technology transfer.
Additionally, both Chinese provinces (e.g., Hunan and Hubei), and Indian states (e.g.,
Mad-hya Pradesh and Gujarat), established CDM Service Centers and CDM Cells, respectively, to
foster the implementation of CDM projects in their sub-national jurisdictions.25 The main
re-sponsibilities of these units are to provide information and professional guidance during the
registration process with the CDM scheme. While the existence of these services should facilitate
overall project implementation, our CDM promotion policy dummy is positive, but not
statisti-cally significant for technology transfer to China and India. Even though CDM service centers in
China, for instance, were found to have a positive effect on overallproject implementation, this
need not be the case fortechnology transfersin CDM projects.
Another concern with the CDM scheme in general is the large share of carbon credits that
result from HFC and N2O destruction (Wara, 2007). Even though our analysis is less sensitive
to this problem as it is framed in terms of project counts, not carbon credits, we re-estimate all
our main models with the number of HFC and N2O projects as a control variable. While our
dataset only comprises 60 projects that are aimed at destroying HFC and N2O, 50 of these feature
technology transfer. To ensure that our results are not dependent on these projects, we not only
use their counts as a control variable, but also exclude them from our analysis entirely.26 These
robustness checks leave our estimation results unchanged; in fact, our results become somewhat
stronger when dropping HFC and N2O destruction projects.
Similarly, we separately re-estimate our main models without projects that fall into one of the
following three categories: renewable energy projects, supply side energy efficiency projects, and
projects focusing on emissions reductions from methane, coal, and cement use.27 This robustness
check is useful as many of the excluded projects, especially on energy conservation and emissions
reductions from methane, coal, and cement sources, are particularly large projects. Correlations
25A full list of Chinese provinces with CDM service centers and Indian states with CDM cells as well as the
regression results can again be found in the appendix.
26The full results tables for these additional robustness checks can be found in the supplementary appendix. 27We exclude these project types mainly because they are the largest categories in our dataset. Renewable projects
as low as r = +0.142 and r = +0.224, respectively, between project type and projects being
small safeguard our analysis against bias from oversampling large projects. Similarly, renewable
energy projects are often very small (r = +0.787). All our main results hold even after excluding
these project types, suggesting that our statistical analysis is not sensitive to differences in project
size.
6 Conclusion
In summary, after examining differences in the sub-national distribution of CDM projects with
technology transfer in China and India, we find that in India, clean technology transfer is not
systematically allocated to provinces that would benefit the most from it, echoing findings from
the previous literature (Babu and Michaelowa, 2003; Benecke, 2009; Ganapati and Liu, 2008,
2009; Bayer, Urpelainen, and Wallace, 2013; Bayer, Urpelainen, and Xu, 2014). In China, on the
other hand, the central government’s systematic strategy of using the CDM as an instrument of
economic development allows new technologies to reach less developed provinces with a lot of
industrial capacity, as hypothesized in previous works (Ganapati and Liu, 2009; Schroeder, 2009b;
Bayer, Urpelainen, and Wallace, 2013). Much of this discrepancy between China and India could,
therefore, be attributed to variation in government capacity and institutional structure. Given its
greater capacity to govern, China is in a better position to exploit the CDM for developmental
purposes.
The findings have notable implications for the scholarship on clean technology transfer.
Stud-ies in the literature have mostly focused on explaining variation in technology transfers across
countries (Dechezleprêtre, Glachant, and Ménière, 2008; UNFCCC, 2010; Hascic and Johnstone,
2011). We have shown that in the two most important host countries of the CDM, sub-national
variation should not be neglected. Indeed, rapidly industrializing countries like China and India
exhibit considerable sub-national economic inequality that impacts their economic development
as national level. Promoting the transfer of clean technology to less developed regions allows for
more substantial development benefits than encouraging clean technology transfer in exclusively
wealthy jurisdictions.
and the agenda is especially keen on directing projects with technology transfer to the country’s
more impoverished provinces. This relationship is not observed for CDM projects without
tech-nology transfer. Conversely, increased economic wealth in India has a positive effect on clean
technology transfer. If Indian policymakers developed a more systematic strategy for promoting
foreign technology transfer under the CDM, they could use this unique international institution
References
Ai, Chunrong, and Edward C. Norton. 2003. “Interaction Terms in Logit and Probit Models.” Economics Letters80 (1): 123–129.
Babu, N. Yuvarah Dinesh, and Axel Michaelowa. 2003. “Removing Barriers for Renewable Energy CDM Projects in India and Building Capacity at the State Level.” HWWA Report 237, Hamburg Institute of International Economics.
Bayer, Patrick, and Johannes Urpelainen. 2013. “External Sources of Clean Technology: Evidence from the Clean Development Mechanism.” Review of International Organizations8 (1): 81–109.
Bayer, Patrick, Johannes Urpelainen, and Alice Xu. 2014. “Laissez Faire and the Clean Devel-opment Mechanism: Determinants of Project Implementation in Indian States, 2003-2011.” Forthcoming in Clean Technologies and Environmental Policy.
Bayer, Patrick, Johannes Urpelainen, and Jeremy Wallace. 2013. “Who Uses the Clean Develop-ment Mechanism? An Empirical Analysis of Projects in Chinese Provinces.” Global Environ-mental Change23 (2): 512–521.
Benecke, Gudrun. 2009. “Varieties of Carbon Governance: Taking Stock of the Local Carbon Market in India.” Journal of Environment and Development18 (4): 346–370.
Brambor, Thomas, William Roberts Clark, and Matt Golder. 2006. “Understanding Interaction Models: Improving Empirical Analyses.” Political Analysis14 (1): 63–82.
Brewer, Thomas L. 2008. “Climate Change Technology Transfer: A New Paradigm and Policy Agenda.”Climate Policy8 (5): 516–526.
Capoor, Karaan, and Philippe Ambrosi. 2007. “State and Trends of the Carbon Market 2007.” World Bank Annual Review.
CDM0472. 2006. “Project Design Document for Project CDM0472.” Accessed June 21, 2012.
URL:http://cdm.unfccc.int/UserManagement/FileStorage/9M7MLW12TKXFW9GRJRYR3MAH0NE181
CDM4412. 2008. “Project Design Document for Project CDM4412.” Accessed June 21, 2012.
URL:http://cdm.unfccc.int/UserManagement/FileStorage/TIJ1RMX9WC5H2UGDPFZQ0EYVSANK3O
Chatterjee, Elizabeth. 2012. “Dissipated Energy: Indian Electric Power and the Politics of Blame.” Contemporary South Asia20 (1): 91–103.
Chen, Shaohua, and Martin Ravallion. 2008. “China is Poorer than We Thought, but No Less Succeessful in the Fight Against Poverty.” World Bank Policy Research Working Paper 4621.
de Coninck, Heleen, Frauke Haake, and Nico van der Linden. 2007. “Technology Transfer in the Clean Development Mechanism.”Climate Policy7 (5): 444–456.
Dechezleprêtre, Antoine, Matthieu Glachant, and Yann Ménière. 2008. “The Clean Development Mechanism and the International Diffusion of Technologies: An Empirical Study.”Energy Policy 36 (4): 1273–1283.
Doranova, Asel, Ionara Costa, and Geert Duysters. 2010. “Knowledge Base Determinants of Technology Sourcing in Clean Development Mechanism Projects.”Energy Policy38 (10): 5550– 5559.
Fuhr, Harald, and Markus Lederer. 2009. “Varieties of Carbon Governance in Newly Industrial-izing Countries.”Journal of Environment and Development18 (4): 327–345.
Ganapati, Sukumar, and Liguang Liu. 2008. “The Clean Development Mechanism in China and India: A Comparative Institutional Analysis.” Public Administration and Development 28: 351– 362.
Ganapati, Sukumar, and Liguang Liu. 2009. “Sustainable Development in the Clean Development Mechanism: The Role of Designated National Authority in China and India.”Climate Policy52 (1): 43–60.
Gao, Guangsheng. 2008. “Speech at China 2008 CDM Experience Exchange Conference in Bei-jing.” Inspector of Department of Climate Change of NDRC.
Greene, William H. 2010. “Testing Hypotheses about Interaction Terms in Nonlinear Models.” Economics Letters107 (2): 291–296.
Haites, E., M.S. Duan, and S. Seres. 2006. “Technology Transfer by CDM Projects.”Climate Policy 6 (3): 327–344.
Hascic, Ivan, and Nick Johnstone. 2011. “CDM and International Technology Transfer: Empirical Evidence on Wind Power.”Climate Policy11 (6): 1303–1314.
Heller, Thomas, and P.R. Shukla. 2003. Beyond Kyoto: Advancing the International Effort Against Climate Change. Arlington, VA, U.S.: Pew Center on Global Climate Change.
Ivarsson, I., and C.G. Alvstam. 2005. “Technology Transfer from TNCs to Local Suppliers in Developing Countries: A Study of AB Volvo’s Truck and Bus Plants in Brazil, China, India, and Mexico.” World Development33: 1325–1344.
King, Gary, Michael Tomz, and Jason Wittenberg. 2000. “Making the Most of Statistical Analyses: Improving Interpretation and Presentation.”American Journal of Political Science44 (2): 341–355.
Lecocq, F., and P. Ambrosi. 2007. “The Clean Development Mechanism: History, Status, and Prospects.”Review of Environmental Economics and Policy1: 134–151.
Lewis, Joanna I. 2007. “Technology Acquisition and Innovation in the Developing World: Wind Turbine Development in China and India.” Studies in Comparative International Development 42 (3-4): 208–232.
Lu, Guoqiang. 2004. “Incineration of HFC-23 Waste Streams CDM Projects in China. Opportuni-ties in the Project Development and Cooperation.”.
Nautiyal, Himanshu, and Varun. 2012. “Progress in Renewable Energy under Clean Development Mechanism in India.”Renewable and Sustainable Energy Reviews16 (5): 2913–2919.
Newell, Peter. 2009. “Varieties of CDM Governance: Some Reflections.” Journal of Environment and Development 18 (4): 425–435.
Ockwell, David G., Jim Watson, Gordon MacKerron, Prosanto Pal, and Farhana Yamin. 2008. “Key Policy Considerations for Facilitating Low Carbon Technology Transfer to Developing Countries.”Energy Policy36 (11): 4104–4115.
Ockwell, David, Jim Watson, Gordon MacKerron, Prosanto Pal, Farhana Yamin, N. Vasudevan, and Parimita Mohanty. 2007. “UK-India Collaboration to Identify the Barriers to the Transfer of Low Carbon Energy Technology.” Sussex Energy Group, TERI, and Institute of Development Studies at University of Sussex.
Popp, David. 2011. “International Technology Transfer, Climate Change, and the Clean Develop-ment Mechanism.”Review of Environmental Economics and Policy5 (1): 131–152.
Schneider, Malte, Andreas Holzer, and Volker H. Hoffman. 2008. “Understanding the CDM’s Contribution to Technology Transfer.”Energy Policy36 (8): 2930–2938.
Schroeder, Miriam. 2009a. “Utilizing the Clean Development Mechanism for the Deployment of Renewable Energies in China.”Applied Energy86 (2): 237–242.
Schroeder, Miriam. 2009b. “Varieties of Carbon Governance: Utilizing the Clean Development Mechanism for Chinese Priorities.”Journal of Environment and Development18 (4): 371–394.
Seres, Stephen, Erik Haites, and Kevin Murphy. 2009. “Analysis of Technology Transfer in CDM Projects: An Update.”Energy Policy37 (11): 4919–4926.
Shih, Victor, Christopher Adolph, and Mingxing Liu. 2012. “Getting Ahead in the Communist Party: Explaining the Advancement of Central Committee Members in China.”American Polit-ical Science Review106 (1): 166–187.
Streck, Charlotte, and Jolene Lin. 2008. “Making Markets Work: A Review of CDM Performance and the Need for Reform.”European Journal of International Law19 (2): 409–442.
Takahashi, Kentaro, and Miaomiao Zhang. 2011. “Market Mechanisms Country Fact Sheet: Peo-ple’s Republic of China.” Institute for Global Environmental Strategies, Market Mechanism Group.
UNFCCC. 2010. “The Contribution of the Clean Development Mechanism under the Kyoto Protocol.” United Nations Framework Convention on Climate Change.
Wang, Bo. 2010. “Can CDM Bring Technology Transfer to China? An Empirical Study of Tech-nology Transfer in China’s CDM Projects.”Energy Policy38 (5): 2572–2585.
0 1 2 3 4 5 6 7 8 9 10 11 18 Distribution of Technology Transfer for China and India
Pro
vince−y
ears
0
20
40
60
80
100
120
140
Number of projects with technology transfer
[image:29.612.118.451.81.444.2]Technology transfer in China Technology transfer in India
40 − 45 30 − 40 20 − 30 15 − 20 10 − 15 5 − 10 0 − 5 No data
CDM Tech Transfer in China
25 − 30 20 − 25 15 − 20 10 − 15 5 − 10 0 − 5 No data CDM Tech Transfer in India
4th Quartile 3rd Quartile 2nd Quartile 1st Quartile No data
GDP per capita in China
4th Quartile 3rd Quartile 2nd Quartile 1st Quartile No data GDP per capita in India
4th Quartile 3rd Quartile 2nd Quartile 1st Quartile No data
Industrial capacity per capita in China
4th Quartile 3rd Quartile 2nd Quartile 1st Quartile No data
[image:30.612.138.475.67.610.2]Industrial capacity per capita in India
First Differences in Predicted Number of CDM Projects
with Technology Transfer
−5
0
5
10
15
20
First diff
erence in n
umber of predicted CDM projects
Economic
wealth
[image:31.612.86.522.106.530.2]Industrial
capacity
First Differences in Predicted Number of CDM Projects
without Technology Transfer
−20
−10
0
10
20
First diff
erence in n
umber of predicted CDM projects
Economic
wealth
[image:32.612.90.519.136.541.2]Industrial
capacity
Summary statistics for China
count mean sd min max
CDM projects with tech transfer 127 2.67 2.93 0.00 18.00 CDM projects w/o tech transfer 127 13.34 16.03 0.00 94.00 Real GDP (p.c., logged) 127 7.73 0.53 6.82 9.23 Industrial production (p.c., logged) 127 6.76 0.57 5.61 8.03 Electricity consumption (p.c., logged) 127 7.80 0.49 6.95 8.93
Political change 127 0.40 0.49 0.00 1.00
Population (logged) 127 3.58 0.75 1.71 4.62
Summary statistics for India
count mean sd min max
CDM projects with tech transfer 127 1.15 2.15 0.00 11.00 CDM projects w/o tech transfer 127 12.38 13.20 1.00 53.00 Real GDP (p.c., logged) 127 6.55 0.49 5.18 7.81 Industrial production (p.c., logged) 127 5.62 1.31 0.85 8.08 Electricity consumption (p.c., logged) 127 6.53 0.66 4.36 7.60
Political change 127 0.20 0.40 0.00 1.00
[image:33.612.144.466.83.193.2]Population (logged) 127 3.50 1.13 0.33 5.28
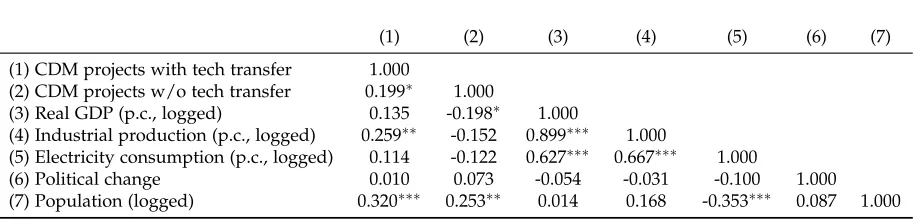
Correlation matrix for China
(1) (2) (3) (4) (5) (6) (7)
(1) CDM projects with tech transfer 1.000
(2) CDM projects w/o tech transfer 0.199∗ 1.000
(3) Real GDP (p.c., logged) 0.135 -0.198∗ 1.000
(4) Industrial production (p.c., logged) 0.259∗∗ -0.152 0.899∗∗∗ 1.000
(5) Electricity consumption (p.c., logged) 0.114 -0.122 0.627∗∗∗ 0.667∗∗∗ 1.000
(6) Political change 0.010 0.073 -0.054 -0.031 -0.100 1.000 (7) Population (logged) 0.320∗∗∗ 0.253∗∗ 0.014 0.168 -0.353∗∗∗ 0.087 1.000
Correlation matrix for India
(1) (2) (3) (4) (5) (6) (7)
(1) CDM projects with tech transfer 1.000
(2) CDM projects w/o tech transfer 0.640∗∗∗ 1.000
(3) Real GDP (p.c., logged) 0.154 0.241∗∗ 1.000
(4) Industrial production (p.c., logged) 0.233∗∗ 0.347∗∗∗ 0.597∗∗∗ 1.000
[image:34.612.76.534.81.191.2](5) Electricity consumption (p.c., logged) 0.163 0.289∗∗∗ 0.777∗∗∗ 0.668∗∗∗ 1.000 (6) Political change -0.099 -0.145 -0.068 -0.012 -0.063 1.000 (7) Population (logged) 0.298∗∗∗ 0.431∗∗∗ -0.349∗∗∗ 0.172 -0.137 0.009 1.000
Main regression results
(1) (2) (3)
Model Model Model
Stage 2: Estimation stage
Real GDP (p.c., logged) -1.789∗∗∗ -1.461∗∗∗ -0.829∗∗ (0.464) (0.373) (0.351)
Industrial production (p.c., logged) 1.943∗∗∗ 1.724∗∗∗ 1.845∗∗∗ (0.469) (0.399) (0.391)
India dummy -5.971∗ -4.644 -0.981
(3.458) (3.953) (3.244)
GDP x India 2.148∗∗ 2.138∗ 1.423∗∗
(0.916) (1.117) (0.703)
Industrial production x India -1.538∗∗ -1.290∗∗ -1.682∗∗∗ (0.647) (0.654) (0.511)
Electricity consumption (p.c., logged) 0.183 -0.313 (0.505) (0.486)
Electricity consumption x India -0.368 0.146 (0.815) (0.678)
Political change -0.122 -0.146
(0.201) (0.222)
Political change x India -0.553 -0.283
(0.446) (0.455)
Year -0.168∗∗∗ -0.305∗∗∗
(0.043) (0.045)
CDM projects w/o tech transfer 0.037∗∗∗
(0.009)
Stage 1: Inflation stage
Population (logged) -1.583∗∗∗ -1.801∗∗∗ -2.213∗∗∗ (0.325) (0.413) (0.438)
Observations 283 254 254
Standard errors in parentheses
Dependent variable: Number of CDM projects with tech transfer. Standard errors are clustered by province/state.
[image:35.612.153.451.78.493.2]All models are zero-inflated negative binomial models ∗ p<0.10,∗∗ p<0.05,∗∗∗ p<0.01
Regression results for placebo test
(1) (2) (3)
Model Model Model
Stage 2: Estimation stage
Real GDP (p.c., logged) -1.909∗∗∗ -1.749∗∗∗ -0.964∗ (0.478) (0.524) (0.556)
Industrial production (p.c., logged) 1.123∗∗∗ 0.950∗∗ 0.111 (0.424) (0.443) (0.501)
India dummy -6.763∗ -6.891 -5.019
(3.744) (4.293) (3.345)
GDP x India 1.442∗ 0.997 -0.117
(0.743) (0.871) (0.769)
Industrial production x India -0.662 -0.553 0.208 (0.446) (0.478) (0.513)
Year 0.256∗∗∗ 0.254∗∗∗ 0.318∗∗∗
(0.047) (0.058) (0.052)
Electricity consumption (p.c., logged) -0.009 -0.087 (0.574) (0.319)
Electricity consumption x India 0.378 0.564 (0.781) (0.521)
Political change 0.083 0.093
(0.199) (0.170)
Political change x India -0.380 -0.224
(0.311) (0.268)
CDM projects with tech transfer 0.190∗∗∗ (0.029)
Stage 1: Inflation stage
Population (logged) -0.020 -0.045 -0.120
(0.228) (0.226) (0.198)
Observations 283 254 254
Standard errors in parentheses
Dependent variable: Number of CDM projects with tech transfer. Standard errors are clustered by province/state.
[image:36.612.152.453.77.515.2]All models are zero-inflated negative binomial models ∗ p<0.10,∗∗ p<0.05,∗∗∗p<0.01