collection and analysis for condition monitoring of ship structures and
machinery systems. In: Smart Ship Technology, 2016-01-26 - 2016-01-27,
The Royal Institution of Naval Architects. ,
This version is available at
https://strathprints.strath.ac.uk/57271/
Strathprints is designed to allow users to access the research output of the University of Strathclyde. Unless otherwise explicitly stated on the manuscript, Copyright © and Moral Rights for the papers on this site are retained by the individual authors and/or other copyright owners. Please check the manuscript for details of any other licences that may have been applied. You may not engage in further distribution of the material for any profitmaking activities or any commercial gain. You may freely distribute both the url (https://strathprints.strath.ac.uk/) and the content of this paper for research or private study, educational, or not-for-profit purposes without prior permission or charge.
Any correspondence concerning this service should be sent to the Strathprints administrator:
strathprints@strath.ac.uk
The Strathprints institutional repository (https://strathprints.strath.ac.uk) is a digital archive of University of Strathclyde research outputs. It has been developed to disseminate open access research outputs, expose data about those outputs, and enable the
SHIP SENSORS DATA COLLECTION & ANALYSIS FOR CONDITION MONITORING
OF SHIP STRUCTURES & MACHINERY SYSTEMS
Y Raptodimos, I Lazakis, G Theotokatos, University of Strathclyde, UK, T Varelas, Danaos Shipping Company Ltd., Greece and L Drikos, Glafcos Marine Ltd., Greece
SUMMARY
With the advancements in technology, sensors and predictive maintenance, the concept of smart ships aims in using data to enhance ship performance. The INCASS project aims in integrating robotic platforms, structural and machinery reliability tools in order to enhance ship inspection, maintenance, safety and performance. In order to achieve this, sensors are installed onboard three case studies, for monitoring hull structural characteristics and machinery parameter measurements are also monitored and data are collected in order to inspect and examine machinery systems and parameters behaviour through condition monitoring. Moreover, INCASS also addresses and identifies the methods for transforming the real time monitoring data (raw data), collected from the onboard measurement campaign using permanent sensors or portable equipment or a combination of both, into meaningful, useful data and information that will be utilised in developed structural and machinery reliability analysis and assessment tools. Furthermore, the developed tools using the information from the onboard data collection activity will be capable of calculating and assessing the performance and reliability of the ship, which will provide input into a decision support system capable of addressing emergency decision making and assisting in the overall decision making process for repair, maintenance and optimised ship operations.
NOMENCLATURE
C.W Cooling Water
CBM Condition Based Maintenance CM Condition Monitoring DSS Decision Support System F.O Fuel Oil
IMU Inertial Measurement Unit
INCASS Inspection Capabilities for Enhanced Ship Safety
ISM International Safety Management L.O Lube Oil
M/E Main Engine
MRA Machinery Reliability Assessment O & M Operation & Maintenance PMS Planned Maintenance System RBI Risk Based Inspection
RCM Reliability-Centred Maintenance SRA Structural Reliability Assessment UTM Ultrasonic Thickness Measurement
1. INTRODUCTION
Marine automation, electrical and propulsion systems, sensors, robotics, advanced materials, big data analytics, are a few of the categories that can describe the concept behind smart ships. The question of how much data, which data, and how often this should be collected and how has also risen; as although companies adopt condition based maintenance schemes, there seems to be an issue in processing, analysing and utilising the recorded operational data. Intelligent ships will enable owners to make more rapid operating decisions, by analysing real time data, providing real-time information regarding the condition of onboard equipment. Thus, this will lead to the evolution of maintenance from fixed intervals, towards tailored predictive maintenance
applications, which will optimise maintenance and operation planning and will also boost performance and safety. Therefore, it is clear that such developments have the potential of transforming the design, construction and operation of commercial ships.
Maintenance is an important contributor to reach the intended life-time of technical capital assets (trains, ships, airplanes). According to British Standards Institute, maintenance is defined as a combination of all the technical and associated administrative activities required to keep equipment, installations and other physical assets in the desired operating condition or to restore them to this condition [1]. Maintenance also includes the engineering decisions and associated actions that are necessary for the optimisation of specified equipment capability, meaning the ability to perform a specified function within a range of performance levels that may relate to capacity, rate, quality, safety and responsiveness. Furthermore, maintenance costs are a significant portion of the operational cost and breakdowns and downtime have an impact on plant capacity, product quality and cost of production as well as on health, safety and the environment. Thus, nowadays, the shift of maintenance as a strategic perspective within a company organization can be attributed to the utilisation of more advanced technologies, increased emphasis on safety, new environmental legislations, optimised operations with increased fuel efficiency and reduction of emissions [2].
it [4]. Also, due to the impact of shipping on the environment and the importance of the safe operation of ships; ship owners and operators pursue to adopt a maintenance plan and procedures that will reduce costs, promote the lifecycle integrity and enhance the energy efficiency of the ship.
In this respect, this paper presents the onboard measurement methodology as suggested by the INCASS (Inspection Capabilities for Enhanced Ship Safety) FP7 EU funded project. The INCASS project aims to bring an innovative solution to the ship inspection regime through the introduction of enhanced inspection of ship structures, by integrating robotic-automated platforms for on-line or on-demand ship inspection activities and selecting the software and hardware tools that can implement or facilitate specific inspection tasks, to provide input to the decision support system. Enhanced inspection of ships will also include providing ship structures and machinery monitoring with real time information using sensors and incorporating structural and machinery risk analysis, using in-house structural/hydrodynamics and machinery computational tools. Moreover, by introducing condition based inspection tools and methodologies, reliability and criticality based maintenance, INCASS provides an enhanced central database, including ship structures and machinery, available to maritime authorities, Classification Societies and ship operators and eventually will develop a decision support system for ship structures and machinery for continuous monitoring and risk analysis and management of ship operations.
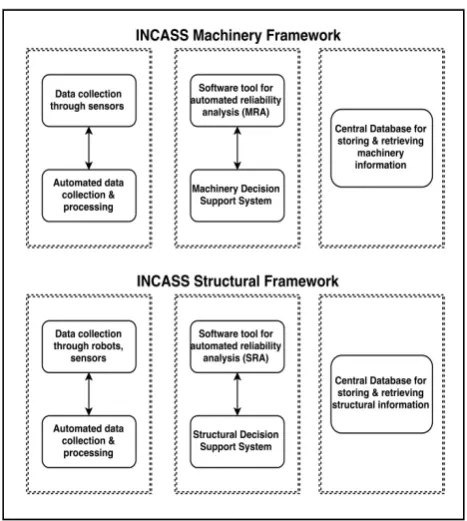
[image:3.595.304.538.68.329.2]The deployment of the overall developed onboard INCASS system will be based on three case studies taking into account structural and machinery data for each ship type. These include the cases of a tanker, a bulk carrier and a container ship respectively. In this way the validation and testing of the INCASS framework can be achieved under realistic operational conditions. These data and information will provide the INCASS platform with the identification of which parameters will be measured for each case study. Moreover, the measured parameters are censored through Condition Monitoring (CM) so that their relative measurements can then be utilised in the Structural Reliability Assessment (SRA) and Machinery Reliability Assessment (MRA) tools and their corresponding decision support systems; assisting in the overall decision making process for repair and maintenance of ship machinery and equipment within the INCASS project framework and optimised ship operations. Figure 1 illustrates the framework of the INCASS project.
Figure 1: INCASS project inspection framework
This paper is organized as follows. First, Section 2 summarises the existing literature related to this work, followed by the formulation of the onboard measurement data collection in Section 3. Section 3 is separated into two sub-sections. The first one is related to structural information and data, while the second one is relative to machinery information and data. Section 4 demonstrates the onboard measurement strategy and methodology for both structures and machinery. Finally, Section 5 establishes the conclusions of this paper providing remarks on the work achieved and directions for future research actions.
2. BACKGROUND
2.1 MAINTENANCE
Maintenance was initially treated as a course of action that could be accomplished in a random day by day operation. The main aim was not to lose operational time and to minimise unexpected failures. At first maintenance was nothing more than an inevitable part of production, thus it was considered as a necessary evil. Repairs and replacement were tackled only when necessary with no optimisation taking place. However in the last years this attitude has changed as maintenance started to be regarded as a strategic issue in the organisation [5].
maintenance is an evolution of preventive maintenance and essentially has the same principles as preventive. Predictive maintenance can be categorized into three categories of maintenance methods. These are Condition Monitoring (CM), Reliability-Centred Maintenance (RCM) and Risk-Based Inspection (RBI).Nowadays, maintenance is encountered as an operational method, which is employed as a profit generating process and a cost reduction budget centre through an enhanced Operation and Maintenance (O&M) strategy.
2.2 CONDITION BASED MAINTENANCE (CBM)
The concept of Condition Based Maintenance (CBM) was first introduced by the Rio Grande Railway Company in late 1940s and was initially called predictive maintenance [7]. There are various definitions on the concept of CBM. Bengtsson [8] shortly described it as preventive maintenance based on performance and/or parameter monitoring and the subsequent actions. According to British Standard [9], CBM is defined as the maintenance policy carried out in response to a significant deterioration in a machine as indicated by a change in a monitored parameter of the machine condition. Butcher [10] defined CBM as a set of maintenance actions based on real time or near real-time assessment of equipment condition, which is obtained from embedded sensors and/or external tests & measurements taken by portable equipment. Hence, unlike breakdown maintenance and preventive maintenance, CBM focuses on not only fault detection and diagnostics of components but also degradation monitoring and failure prediction. Generally, CBM can be treated as a method used to reduce the uncertainty of maintenance activities and is carried out according to the requirements indicated by the equipment condition. Until now it has been difficult to achieve effectiveness of maintenance operations because there is no information visibility during product usage period. However, recently, with emerging technologies such as Radio Frequency IDentification (RFID), various sensors, Micro-Electro-Mechanical System (MEMS), wireless tele-communication, Supervisory Control and Data Acquisition (SCADA) and Product Embedded Information Devices (PEID) are expected to be rapidly used for gathering and monitoring the status of components, sub-systems and systems during their usage period [11].
In order to develop a CBM strategy, it is essential to understand equipment failure behaviour [12].Condition monitoring technologies are applied through various tools by recording and evaluating different measureable parameters. These technologies include vibration monitoring, noise monitoring, thermography, oil analysis and tribology, combustion performance monitoring and electrical signature analysis [13]. Sullivan et al. [14] also discuss various condition monitoring technologies and techniques such as lubricant/fuel, wear particle, bearing
temperature, infrared thermography and motor current signature analysis.
Related to the particular instrumentation used for CBM applications, two methods may be employed: the off-line and on-line methods. The off-line method consists of periodic measurements (e.g. daily, weekly, monthly) and allows trend analysis to be performed for the sampled parameters, after a period of data collection activity. This data will assist in measuring the rate of degradation of certain equipment and machinery systems. The equipment needed to acquire this data consists of analysers or data collectors (permanent or portable equipment), used together with the necessary sensors, a computer and specific software employed. The on-line method is used for continuous monitoring, by installing permanent sensors and wiring to a data acquisition and processing system. This maintenance measure is aimed at critical equipment in the production and operation of the installation of machinery systems and can also be applied to systems where access is difficult or severe ambient conditions may affect the personnel operations [13]. Therefore by taking into account the above remarks, the appropriate methods for the onboard measurement campaign can be selected.
2.3 MAINTENANCE OPTIMISATION
3. DATA COLLECTION SOURCES FOR SHIP STRUCTURES & MACHINERY SYSTEMS
[image:5.595.49.283.338.417.2]Data sources for ship structures and machinery systems were extensively examined in order to obtain adequate and useful information, which assists in identifying the most important and critical parameters and systems to be monitored. The identified parameters and systems [18], as illustrated in Section 4, are also critical in analyzing and determining ship reliability and performance, compared to gathering a vast amount of data which may or may not be useful for such kind of analysis. More than sixty different documents (reports, drawings) were collected and examined in order to visualize all data and information available. Regarding ship structures, the information and data types include reports provided during dry-docks, Classification Societies reports, ship structural drawings and real time monitoring data. Real time measurements are achieved by positioning sensors on the ship hull structure, which then will be fed in the SRA tools. The structural data sources are illustrated in Figure 2.
Figure 2: Structural Data Sources
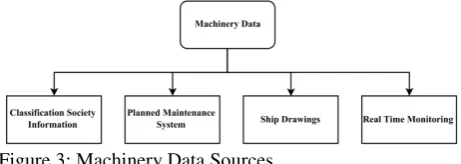
[image:5.595.49.280.607.689.2]On the other hand, machinery data includes information such as Classification Societies statutory surveys, ship machinery drawings, Planned Maintenance System (PMS) and real time monitoring data. These sources are used for selecting ship machinery systems and equipment to be monitored and evaluated for the three case studies. Data is collected for all three ship types for both the structural and machinery aspect of the vessels (tanker, bulk carrier, container ship). However, all three ship types have similar information categories. In the case of the tanker vessel some machinery parameters (e.g. cargo pumps) differ from those of the other ships due to the characteristics of its operational profile. Figure 3, shows the data sources used for the machinery part of the ship.
Figure 3: Machinery Data Sources
3.1 SHIP STRUCTURAL DATA SOURCES
Information and data types for the ship structural measurements include dry-dock reports, Classification
Societies reports, ship structural drawings and real time monitoring data as illustrated in Figure 2.
Structural drawings include amongst others General Arrangement (GA) drawings, midship section, capacity plan and shell expansion drawings. One of the most important structural drawings available is the capacity plan one. This type of drawing shows all the cargo and storage areas inside the ship and also demonstrates the boundary conditions of ship structures primary structural members. Another essential drawing that is used is the GA plan of the ship. This drawing includes the sectional drawings of the deck plan, emergency room floor deck plan, navigation bridge deck, ship profile plan, upper deck plan and ship midship section. Similar to the capacity plan, the GA plan also presents the different sections of the ship and it can also demonstrate the ship longitudinal and transverse boundaries. One other useful drawing is the ship shell expansion plan. This drawing is used for checking dimensions, topology, and structural integrity of shell plates and it verifies the welding seams and internal hull structure related to the shell plating. This type of drawing can show beneficial information on thickness and dimensions of the steel plates, and thickness and dimensions for both primary and secondary structural members.
Dry-dock reports contain information such as surface condition report and schematics, paint specification reports, consumable specification tables, daily inspection reports, repair and maintenance action images and Ultrasonic Thickness Measurement (UTM) reports. The ship surface condition report contains all aspects of the hull surface such as fouling, rusting, peeling-off and blisters. Another type of report is the daily inspection report. This report contains all the scheduled inspection and maintenance activities in addition to environmental conditions. The ship surface treatment report includes hull surface images, at the initial viewing, after surface preparation and after repainting and surface treatment has been done. The UTM report provides insight into previous structural surveys and repair works on structural elements. The original thicknesses of the plates, their measured thickness and maximum allowable tolerance are included in a UTM report.
useful information on the maintenance activities carried out so the inspection and maintenance effort and priorities can be focused on other areas. Other type of information provided by Classification Societies is the close up special surveys carried out on older ships. Classification Societies also provide valuable information on strength analysis of structural members such as information about corrugated bulkhead strength between two different cargo holds in a bulk carrier. It also illustrates thicknesses measured for flange and web sections on different homogeneous and non-homogeneous load conditions. The structural strength of such a section can also be determined, from other additional information and equations.
Finally, real time monitoring data shows information on the importance of sensors and the types used, sensor locations and analysis types. The INCASS structural platform requires calibration of its models to predict fatigue damage and extreme response of ship structures. Thus, Inertial Measurement Unit (IMU) and accelerometers are used for hull condition monitoring. Moreover, sensors measure the performance of both structural and hydrodynamic computational models implemented within the structural mechanics platform. Hence, the condition of the ships in operation can be monitored before performing a regular ship inspection. This will allow the prevention of any unexpected catastrophic failure of ship structures which can cause significant financial loss; environmental damage in addition to threat to human lives onboard the ship. Moreover, collection of real-time data will help designers to obtain an invaluable insight of the actual ship response in operation at different locations in the world and subjected to different environmental conditions. Therefore, a much more realistic screening of information and data will be collected as opposed to laboratory tests done on small ship models. As mentioned earlier, improvements in design will result in more efficient, smart designs which will reduce both the operational and maintenance costs for ship owners and allow for energy savings to be achieved.
3.2 SHIP MACHINERY DATA SOURCES
Machinery information contains Classification Societies statutory surveys, Class reliability data, ship machinery drawings, critical jobs list and maintenance information from operators, and real time monitoring data. The ship machinery data/information collected is divided into four major subsections. These include Classification Society machinery information, machinery drawings, PMS and real time monitoring data which displays the machinery components and parameter types analysed for condition monitoring.
The machinery statutory survey report is one of the most common Classification survey reports that states the condition of the major machinery systems. This report contains the faults identified, actions taken and
recommendations for future action and work. This can be helpful on creating historical information on ship machinery and it can be used to determine the reliability of various systems and components. Classification Societies also provide expert incident data for different machinery components. This also helps in determining the reliability of different components. This reliability information in turn, can be combined with conditions of the component failing in order to investigate the risk and criticality values for each component.
Another major drawing is the GA plan which includes different sectional views of the ship that describe the position of ship machinery, such as the engine room and the steering room. Tank top plan view can be also useful as it can give a more detailed map location of the machinery onboard the ship. Within the engine room space, second and third deck plans also describe the particular system components and their interactions with each other more clearly.
Furthermore, one of the major types of operators’ report is the voyage noon report, which demonstrates the operational conditions of the vessel at the time of data recording and voyage. A typical voyage report contains information on date, sailing time, location, barometer reading, wind force & direction, speed, voyage distance, wave height, revolutions per minute, fuel consumption and additional remarks. There are various other internal reports generated by ship operators for their own use. One of them is the components jobs report. This report contains the list of all available ship machinery components. This type of report can help to have an idea of the available components on the ship and the typical frequency of maintenance for each of them. This typical frequency can be used as the basis for improving reliability of the components. One other beneficial report generated by ship operators, is the critical jobs report which includes all previous inspection, maintenance and repair jobs performed on ship machinery systems. Finally, it can also provide extra information on running hours of components, which would be vital on determining their associated reliability values. Real time monitoring data is carried out using PMSs and different types of sensors. The machinery systems and parameters selected for the onboard measurement campaign are described in Section 4.2.
4. SHIP ONBOARD MEASUREMENT DEFINITIONS
Figure 4: Raw data input to DSS framework
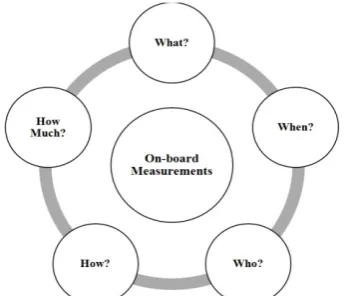
The onboard measurement methodology can be seen clearly in Figure 5 which aims in answering which systems/parameters will be monitored (what), when will the selected systems/parameters be scheduled to be monitored (when) from the crew or technicians (who) and if permanent sensors or portable equipment will be used (how). Finally, the cost of implementing different monitoring scenarios, sensors or portable equipment is also taken into account (how much).
Figure 5: INCASS onboard measurement methodology
4.1 SHIP STRUCTURAL MEASUREMENTS
The obtained structural data measurements will be used in conjunction with the SRA tool and the respective structural DSS for improving ship response modelling, providing better estimates of fatigue damage, providing data on extremes safely encountered conditions; which will help to calibrate the structural loading and strength models and finally enabling more targeted and time efficient inspection processes [19].
IMU (Inertial Measurement Units) and accelerometers will feed real time data in the INCASS software for further evaluation and reliability examination in order to enhance ship repair, inspection and maintenance. Hull condition monitoring cost includes costs such as the purchase of the strain gauges, accelerometers and installation costs such as cabling, housing and piping cost. This will allow determination of the wave height which can be used to obtain the direction of the ship relative to waves. Moreover, continuous recording of heading, speed and weather conditions can also be very beneficial. Utilization of sensors will have multiple benefits to ship-owners. For new ships, it will guide designers to come up with a more efficient design which can be less expensive but more reliable. Increasing
reliability will reduce future problems which will eventually increase energy efficiency and also reduce maintenance costs. Moreover, the selected portable system for hull monitoring aims at recording twist angle of girder beam, hogging and sagging actions and global hull motions. The system comprises of 3 independent autonomous units, two tilt meters and one Inertial Measurement Unit (IMU). The location of the units can be seen in Figure 6 for the upper deck plan of the case study of the container ship.
All units were welded at locations close to the centre-line. Unit 1 was installed in the bosun store, in a midship with the door facing forward and it is placed exactly on the main welding seam. Unit 3 was installed forward of the accommodation, on the centre-line, with the door facing forward. Unit 2 was installed exactly opposite of
Unit 3, on the vessel’s port side, with the door facing
forward.
Figure 6: Locations of units on ship upper deck plan (container ship)
[image:7.595.76.250.288.436.2] [image:7.595.306.533.303.403.2]4.2 SHIP MACHINERY MEASUREMENTS
4.2 (a) Selected Machinery Systems
The major machinery systems selected are described and their selection is based on the data/information gathered as part of this onboard measurement campaign. Four systems are selected and their corresponding subsystems and components have been examined in order to identify and select which specific equipment and parameters will be monitored. The identification of main systems, sub-systems and components, also reflects the criticality of onboard machinery based on their consequences and impact on ship safety, unavailability and equipment cost. At this point it is important to mention that the initial classification of the criticality level of the machinery systems and equipment was based on industry best practices and standards, as well as on the operating/running hours of such systems onboard ships. Thus, based on the systems selected and the parameters to be monitored, the number of sensors for each system can be designated. The four main systems selected, are namely the ship main engine, turbocharger, steering gear and pumps. These systems are extremely vital regarding ship operation, safety and energy efficiency.
The main engine comprises of systems such as the main shaft, lube oil and fuel oil systems, cylinders, pistons, scavenging air receivers and air coolers, all important both if examined as an individual system but also as an interconnectivity of systems with interdependencies that when operated correctly and maintained efficiently contribute to the safe and efficient operation of the main engine as a whole [18]. The turbocharger may vary in numbers depending on the engine type. Turbine and compressor blades and inlet piping are monitored. Moreover, the steering gear system includes components such as rams, hydraulic valves, hydraulic pumps, actuators and bearings. Finally, there is a vast number of pumps used onboard a ship for purposes such as heating, cooling, lubricating and transferring fuel to the main engine amongst others. Pumps selected for the onboard measurement campaign include pumps such as fuel, lube, ballast, cooling and fire pumps. Additionally, for the case of the tanker ship, cargo pumps are also monitored.
4.2 (b) Monitoring Scenarios
Three main scenarios are considered for monitoring the condition and performance of the machinery subsystems/components onboard. The first scenario considers the use of only sensors (e.g. thermal, vibration) for the level of monitoring. The data from the sensors will be collected at regular intervals. These intervals can range per hour, per 4 hours, per 12 hours or per day, depending on the requirements and level of analysis to be conducted. The second scenario, considers the combination of attached sensors plus periodic measurements by inspection companies or technicians at various intervals (every 2-4 months). Periodic
[image:8.595.316.550.131.253.2]measurements can be obtained using handheld/portable equipment. Finally, the third scenario considers using only periodic measurements by inspection companies or technicians every 2-4 months intervals.
Figure 6: Scenarios for machinery monitoring
These proposed monitored scenarios provide an indication of the various strategies that can be followed in order to measure parameters for machinery equipment based on the requirements and demands of a ship operator or shipping company. The three scenarios provide different configurations for obtaining measurements and time intervals. Moreover, the scenarios will be selected based on further discussions and agreement with ship owners and operators. Thus, is can be seen that the modelling and strategy behind these different scenarios can provide a flexible condition monitoring scheme for ship operators/owners.
4.2 (c) Machinery Sensors
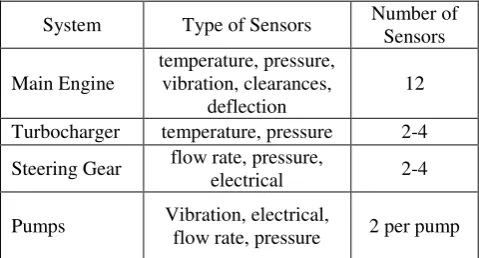
The type of sensors selected will depend among a number of factors such as the type of machinery, which parameter detects best a specific fault or failure and the frequency range of interest. Additionally the factors were further scrutinised in order to assist with the data collection activity, introducing the variables to be controlled such as temperature, pressure, vibration, deflections and clearances as demonstrated in Table 2. In brief, all the possible systems to be monitored and the number of sensors required per each of them can be seen in Table 1.
Table 1: Number of Sensors per System
System Type of Sensors Number of Sensors
Main Engine
temperature, pressure, vibration, clearances,
deflection
12
Turbocharger temperature, pressure 2-4
Steering Gear flow rate, pressure,
electrical 2-4
Pumps Vibration, electrical,
[image:8.595.313.553.585.714.2]4.2 (d) Machinery Monitored Parameters
Each machinery system consists of several components and these components themselves require various types of parameters to be monitored or calculated. Using the data collected for the selected machinery systems, a list of parameters is generated in order to gather real time data that will be in the MRA tool [21] and decision making.
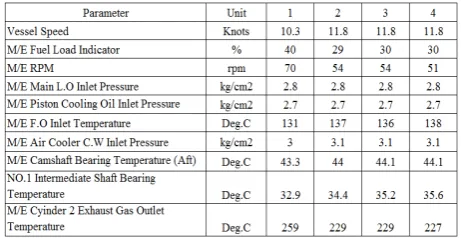
Table 2 presents a sample of the list of parameters monitored during an onboard measurement campaign for the main engine. Through the data collected and research, it is highlighted that parameters such as temperature and pressure are critical records of ship performance. Furthermore, the engine parameters are the best source for finding out any faults or variations regarding the performance of the engine. For example, variations in temperature, pressure and power produced by each cylinder can be frequently monitored and adjustments can be done accordingly in order to achieve enhanced and efficient engine combustion.
[image:9.595.51.282.463.582.2]The measurements include parameters such as temperatures and pressures for various machinery equipment and systems located in the engine room of the vessel. Measurements were collected per hour interval during the journey of a container ship vessel from Tarragona (Spain) to Livorno (Italy). All related measurements were collected from the monitors in the engine room control room and also from pressure gauges (suction and discharge) on various pumps located in the engine room of the vessel.
Table 2: Main Engine Parameters (Sample Table)
Table 2 illustrates a sample list of parameters recorded for the main engine system, alongside the units used for monitoring these parameters. The sample table provided information for four continuous hourly intervals Excel spreadsheets have been constructed that contain all data recorded during this onboard measurement campaign for all mentioned systems. For the main engine, most parameters include temperature and pressure readings for fuel oil, lube oil and also temperatures related to cylinders and bearings. The same types of parameters are measured for all other systems. For pumps, suction and discharge pressure are monitored and flow rates. Additionally, parameters such as engine rpm, fuel load indicator and vessel speed were also recorded. The
objective of collecting this data is to provide a first initial step in utilizing these parameter data for validating and testing the Machinery Risk Assessment (MRA) tool in the near future, once sufficient data has been collected from other planned onboard measurement campaigns on the three case studies of the INCASS project.
5. CONCLUSIONS
This paper presented the onboard measurement campaign for the case of a container ship. First of all, the paper reviewed some general aspects of maintenance types, maintenance optimisation and CBM tools which are suitable for the onboard measurement campaign. The data collection sources for both required ship structural and machinery data was presented and identified. Furthermore, the process for the structural and machinery measurements onboard the ships was demonstrated. In the case of structures, accelerometers will feed real time data to be fed in the INCASS software for further evaluation and reliability examination in order to enhance ship repair, inspection and maintenance. The hull monitoring system aims at recording twist angle of girder beam, hogging and sagging actions and global hull motions. On the other hand, machinery measurements present the definition of the selected machinery systems under examination, the different possible scenarios available for monitoring these systems, the monitored parameters and the number of suggested sensors for these systems and their components. Additionally the parameters were further scrutinised in order to assist with the data collection activity, introducing the variables to be controlled such as temperature, pressure, vibration, deflections and clearances. Moreover for each mentioned sub-system, the specific components and the level of survey involving off-line, on-line, periodic monitoring is also identified. The onboard measurement outcome will be further utilised for input in tools capable of calculating and assessing the performance and reliability of the ship, aiming at optimised operations by applying smarter decisions and maintenance action strategies.
boilers, generators depending on the level of investment. Monitoring of additional systems under real operational conditions, would ensure safer, increased operational efficiency of the ship with optimised operations such as increased fuel efficiency and emissions reductions. Finally, based on the implementation costs and budgets, more sensors can be installed on a specific system of interest or periodic measurements can be conducted, to allow for improved measurements and data collection for analysis and assessment in order to enhance safety, maintenance and ship performance and efficiency.
6. ACKNOWLEDGEMENTS
INCASS project has received research funding from the
European Union’s Seventh Framework Programme under
grant agreement No. 605200. This publication reflects
only the author’s views and European Union is not liable for any use that may be made of the information contained herein.
7. REFERENCES
1. BS, ‘Glossary of terms used in terotechnology’, BS 3811, 1993
2. PARIDA, A., KUMAR, U., GALAR, D. &
STENSTRÖM, C., ‘Performance measurement and
management for maintenance: a literature review’, Journal of Quality in Maintenance Engineering, Vol 21, pp2-33., 2015
3. LAZAKIS, I. & OLCER, A. I., ‘Selection of the best maintenance approach in the maritime industry under fuzzy multiple attribute group
decision-making environment’, Proceedings of IMechE part M: Journal of Engineering for Maritime
Environment, Vol 1–13, 2015
4. IMO, ‘International Safety Management (ISM)
code’, Resolution A.741, 1993
5. PINTELON, L. & PARODI-HERZ, A.,
‘Maintenance: An Evolutionary Perspective.
Complex System Maintenance Handbook’, 2008
6. LAZAKIS I., TURAN O. and AKSU S., ‘Increasing Ship Operational Reliability through the
Implementation of a Holistic Maintenance
Management Strategy’, Ships & Offshore Structures, Vol. 5, pp337-357, 2014
7. PRAJAPATI, A., BECHTEL, J. & GANESAN, S.,
‘Condition based maintenance: a survey’, Journal of Quality in Maintenance Engineering, Vol 18, pp384-400., 2012
8. BENGTSSON M., ‘Condition Based Maintenance Systems an Investigation of Technical Constituents
and Organizational Aspects’. Mlardalen University Licentiate Thesis; 2004
9. BS/ISO 13379-1, ‘Condition monitoring and diagnostics of machines - Data interpretation and
diagnostics techniques Part 1: General guidelines’,
BSI Standards Publication, 2012
10. BUTCHER, SW., ‘Assessment of Condition-Based
Maintenance in the Department of Defense’, 2000
11. SHIN, J.-H. & JUN, H.-B., ‘On condition based
maintenance policy’, Journal of Computational Design and Engineering, Vol 2, pp119-127., 2015 12. PRAJAPATI, A., BECHTEL, J. & GANESAN, S.,
‘Condition based maintenance: a survey’, Journal of Quality in Maintenance Engineering, 18, 384-400., 2012
13. INCASS, ‘Deliverable D4.1 Specification of
requirements for machinery and equipment’,
INCASS-Inspection Capabilities for Enhanced Ship Safety EC FP7 Project, 2014
14. SULLIVAN, G. P., PUGH, R., MELENDEZ, A. P.
& HUNT, W. D., ‘Operations & Maintenance Best
Practices. Office of Energy Efficiency & Renewable
Energy’’ , A guide to achieving operational efficiency, 2010
15. SHARMA A.,, G.S. YADAVA, S.G. DESHMUKH,
‘A literature review and future perspectives on
maintenance optimization’, Journal of Quality in Maintenance Engineering, Vol. 17 Iss: 1, pp.5 – 25, 2011
16. DEKKER R., ‘Applications of maintenance optimization models: a review and analysis’, Reliability Engineering & System Safety, Volume 51, Issue 3, 1996
17. GARG, A. and DESHMUKH, S.G., ‘Maintenance management: literature review and
directions’,Journal of Quality in Maintenance Engineering, Vol. 12 No. 3, pp. 205-38., 2006 18. INCASS, ‘Deliverable D7.1 Specifications of
individual case studies for each ship type’, INCASS-Inspection Capabilities for Enhanced Ship Safety EC FP7 Project, 2014
19. INCASS, ‘Deliverable D6.1 Overall System Testing
& Validation’, INCASS-Inspection Capabilities for Enhanced Ship Safety EC FP7 Project, 2015 20. INCASS, ‘Deliverable D3.3 Hydrodynamic and
structural analysis’, INCASS-Inspection Capabilities for Enhanced Ship Safety EC FP7 Project, 2015 21. DIKIS, K., LAZAKIS, I. & THEOTOKATOS, G., ‘
Dynamic Reliability Analysis Tool for Ship
Machinery Maintenance’, International Maritime Association of the Mediterranean, 21-24 September 2015 Pula, 2015
8. AUTHORS BIOGRAPHY
Dr Iraklis Lazakis is a senior lecturer in the Dpt of NAOME at the University of Strathclyde. He has 10 years of industrial experience with regards to ship operations involving maintenance and repair and surveys. He has developed his expertise of criticality based maintenance in order to improve shipping safety and reliability. He has also participated and contributed in industry, UK and EU funded research related projects in the fields of maintenance, reliability and risk analysis.
Dr Gerasimos Theotokatos is a lecturer in the Dpt of NAOME at the University of Strathclyde. He graduated from the Dpt of Mechanical Engineering of the National Technical University of Athens (NTUA) in 1994 and obtained a PhD from NTUA in 2001 in Marine Engineering. His research interests include ship propulsion plant modelling, performance prediction of marine Diesel engines, the investigation of waste heat recovery and emission reduction systems. Dr Theotokatos participated in various R&D EU projects in the area of marine engines.
Prof Takis Varelas has been working in Danaos group since 2004 acting as R&D director. He spent over 30 years in managerial positions in shipping and information industry. He was elected as Full Professor of Management Information ad DSS of University of Crete in 1985. He holds a BSc in chemistry of UOA and a MSc and PhD in information science from UNISA.