City, University of London Institutional Repository
Citation
:
Henry, L., Messer, D. J. and Nash, G. (2012). Executive functioning in children with specific language impairment. Journal Of Child Psychology And Psychiatry, 53(1), pp. 37-45. doi: 10.1111/j.1469-7610.2011.02430.xThis is the unspecified version of the paper.
This version of the publication may differ from the final published
version.
Permanent repository link: http://openaccess.city.ac.uk/3326/
Link to published version
:
http://dx.doi.org/10.1111/j.1469-7610.2011.02430.xCopyright and reuse:
City Research Online aims to make research
outputs of City, University of London available to a wider audience.
Copyright and Moral Rights remain with the author(s) and/or copyright
holders. URLs from City Research Online may be freely distributed and
linked to.
City Research Online: http://openaccess.city.ac.uk/ publications@city.ac.uk
1 18.04.11
Executive functioning in children with specific language impairment
Lucy A. Henry1, David J. Messer2 & Gilly Nash1
1
London South Bank University
2
Open University
Running head: Executive functioning and SLI
2 Abstract
Background. A limited range of evidence suggests that children with SLI have difficulties with higher
order thinking and reasoning skills (executive functioning, EF). This study involved a comprehensive
investigation of EF in this population taking into account the contributions of age, non-verbal IQ and
verbal ability.
Methods. 10 separate measures of EF were assessed in 160 children: 41 had SLI; 31 had low
language/cognitive functioning but did not fulfil the criteria for SLI (LLF); and 88 were
typically-developing with no language difficulties. Group differences in performance were assessed after
controlling for age, non-verbal IQ and verbal ability in a series of regression analyses.
Results. Children with SLI and LLF had significantly lower performance than typical children on six
out of the 10 EF tasks once age and non-verbal IQ had been controlled (verbal and non-verbal
executive-loaded working memory; verbal and non-verbal fluency; non-verbal inhibition; non-verbal
planning). Performance on these EF tasks remained lower for those in the SLI group even when
verbal IQ was entered in the regressions.
Conclusions. Children with language impairments showed marked difficulties on a range of EF tasks.
These difficulties were present even when adjustments were made for their verbal abilities.
Keywords: specific language impairment, executive functioning, children, verbal IQ, non-verbal IQ
Abbreviations: specific language impairment (SLI), executive functioning (EF), Low language
3
There is increasing evidence that distinct profiles of executive functioning (EF) impairment are
characteristic of different developmental disorders (e.g. autism/ADHD: Geurts, Verte, Oosterlaan,
Roeyers & Sergeant, 2004; Hill, 2004; Ozonoff & Jensen, 1999). Such research provided the context
for the current study of children with specific language impairment (SLI).
EF involves high-level goal-directed behaviour, encompassing strategic planning, flexibility of
thought and action (switching), inhibition of inappropriate responses, generation of new responses
(fluency), and concurrent remembering and processing (working memory). In other words,
“processes that control and regulate thought and action” (Friedman, Miyake, Corley, Young, DeFries
et al., 2006, p. 172). There is good evidence for the “fractionation” of EF in adults and children, into
working memory, switching and inhibition, although some uncertainties remain (Fisk & Sharp, 2004;
Huizinga, Dolan & van der Molen, 2006; Lehto, Juujärvi, Kooistra & Pulkkinen, 2003; Miyake,
Friedman, Emerson, Witzki, Howerter et al., 2000). Executive skills have different developmental
trajectories: inhibition matures relatively early (10-12 years); whereas switching and working
memory continue to develop into adolescence/adulthood (Huitzinga et al., 2006; Levin, Culhane,
Hartmann, Evankovich, Mattson et al., 1991; Welsh, Pennington, & Groisser 1991).
SLI is a developmental disorder involving delayed language in the absence of any obvious
cause. Individuals with SLI have non-verbal IQs in the average range, but there is increasing evidence
that they have difficulties with non-linguistic tasks including mental rotation, number skills and
motor skills (Bishop, 2002; Cowan, Donlon, Newton & Lloyd, 2005; Johnston & Ellis Weismer, 1983).
The fact that SLI may not be entirely limited to language difficulties is reflected in current theorising,
with two broad approaches in the literature. One is that there is a delay/deficit specific to the
language domain, particularly grammar, in which case EF may be unaffected in SLI or difficulties
restricted to EF tasks in the verbal domain (Gopnick & Crago, 1991; Rice & Wexler, 1996; van der
Lely, 2005). The other approach is that SLI involves more general processing deficits (in working
4
procedural memory, Ullman & Pierpont, 2005), in which case SLI groups might show poor EF on a
range of tasks, regardless of domain of processing.
The current study provided a comprehensive evaluation of EF in children with SLI, as
evidence on this topic is limited and sometimes contradictory. For example, inhibition appears to be
impaired (Bishop & Norbury, 2005b; Im-Bolter, Johnson & Pascual-Leone, 2006; Weyandt & Willis,
1994) and difficulties with planning using Tower tasks have been reported (Marton, 2008; Weyandt
& Willis, 1994); yet several studies have found no difficulties with switching (Dibbets, Bakker &
Jolles, 2006; Kiernan, Snow, Swisher & Vance, 1997; Weyandt & Willis, 1994, but see Marton, 2008)
or fluency (Bishop & Norbury, 2005a; Weyandt & Willis, 1994). Nevertheless, weaknesses in verbal
fluency have been reported in children with a related disorder, word finding difficulties (Messer,
Dockrell & Murphy, 2004). Possibly the clearest finding in this area concerns impairments on verbal
measures of executive-loaded working memory (ELWM) in children with SLI. Sentence and listening
span tasks, which draw on concurrent processing and storage skills in the verbal domain, present
particular difficulties (Ellis Weismer, Evans & Hesketh, 1999; Marton & Schwartz, 2003;
Montgomery, 2002). Evidence concerning ELWM in the non-verbal domain is mixed. Archibald and
Gathercole (2006) found no differences between children with SLI and age-matched comparisons,
but Marton (2008) and Im-Bolter et al. (2006), using larger samples, reported weaker visuospatial
ELWM performance in children with SLI.
The current research assessed EF in five areas using large samples to increase the sensitivity
of detecting differences. A broad view of EF was taken by including measures of ELWM, inhibition
and switching, key areas identified in previous studies of children/adults (Lehto et al., 2003; Miyake
et al., 2000); plus measures of fluency and planning commonly used in the literature on
developmental disorders (Pennington & Ozonoff, 1996). To minimise difficulties of interpretation
when using complex assessments of EF, which may involve multiple executive processes (Im-Bolter
5
possible, and controlled for component skills if necessary to ensure each assessment focused on
executive and not other skills.
Each EF dimension was assessed using a verbal and a related non-verbal task. This allowed
investigation of whether difficulties in the SLI group were limited to verbal EF tasks (as might be
expected with a language-specific disability, van der Lely, 2005); or extended to the non-verbal
domain either because of general cognitive processing problems (Ullman & Pierpont, 2005) or
because of verbal mediation. In relation to the latter possibility, Russell, Jarrold and Hood (1999)
have suggested that ‘verbal self-reminding’, i.e. using language for self-regulation, underpins EF
performance. Similarly, Marcovitch and Zelazo (2009) have argued that language (labelling salient
objects or cues) allows ‘reflective consciousness’ which assists goal-directed problem-solving.
An SLI and a typical sample were identified on the basis of commonly used criteria (see
Methods). The typical group included children with chronological and language ages of a similar
range to those in the SLI sample, in the spirit of a ‘developmental trajectories’ approach (Thomas,
Annaz, Ansari, Scerif, Jarrold et al., 2009) whereby comparison samples reflect the range of abilities
of the target sample rather than being individually matched. In the literature, most studies compare
groups with and without SLI, matching individual participants for age and non-verbal IQ. Our
method increased the power to detect group differences and reduced the likelihood of
unrepresentative samples (we included virtually every participant tested). During data collection
some participants did not fit criteria for the SLI or typical groups, because they had limited language
difficulties and in some cases below average scores on non-verbal reasoning. These participants
with ‘low language functioning’ (LLF) were included as a separate group to maximise the
representativeness of our sample. This allowed the investigation of children who did not fit
established clinical criteria, but showed non-typical levels of language performance.
To examine group differences in EF, regression analyses were conducted. Age and
6
dummy variables (SLI, LLF, typical). In a second series of regression analyses, age, non-verbal and
verbal IQ were controlled before examining group differences. Because selection criteria meant
there were differences in verbal abilities between groups, it might be expected that controlling for
verbal IQ would remove group differences in EF performance. However, if group differences
remained this would indicate that poor EF performance in, for example the SLI group, was unlikely to
result from weaknesses in verbal ability and could be considered an important feature of their
cognitive profile.
To summarise, based on previous research and theory we investigated whether children
with SLI had poor EF abilities compared to a typical sample. If these were present, our design
allowed us to investigate whether difficulties were confined to language-based EF tasks (Rice &
Wexler, 1996) or extended to non-verbal EF tasks (Ullman & Pierpont, 2005). In this way we hoped
to contribute to discussions about difficulties with information processing in children with SLI. We
also investigated whether low EF in the SLI group might be independent of their language difficulties
by controlling for both non-verbal and verbal IQ. Finally, we assessed whether EF difficulties were
present in the LLF group; it might be expected that these individuals would have less severe
impairments.
Methods
Participants. 161 participants were recruited from 22 schools and specialist language units/classes
within Greater London and, very occasionally, via direct contact with parents/guardians. Every child
tested was included in the sample (n = 160), except one with intellectual disabilities (BAS-II T-scores
of 20). There were three groups: typical; SLI; and Low Language Functioning (LLF).
All participants in the SLI (n = 41) and typical (n = 88) groups had non-verbal abilities in the
Scales-7
II, Elliott, Smith & McCullough, 1996). All children with SLI had formal diagnoses from appropriate
health professionals according to standard clinical criteria (DSM-IV, American Psychiatric
Association, 1994). No participants with SLI had diagnoses of hearing impairments, intellectual
disability, or other developmental disorders (e.g. ADHD, ASD). Inclusion in the SLI group was
dependent on the participant having at least three out of four scaled scores of 7 or below (mean=10;
SD=3) on subscales from the CELF-4-UK (Clinical Evaluation of Language Fundamentals-4-UK, Semel,
Wiig & Secord, 2006) that we administered (Recalling Sentences; Formulated Sentences; Word
Classes-Receptive; Word Classes-Expressive). By contrast, all participants in the typical group had
scaled scores of 8 or higher on the four CELF-4-UK subscales.
Participants who did not fit criteria for inclusion in either the typical or SLI groups
constituted the LLF group (n=31); they had scaled scores of 7 or below on 1 or 2 CELF-4-UK
subscales, and 9, additionally, had BAS Matrices T-scores in the atypical range (‘borderline’, 30-39).
Table 1 gives details of sample characteristics. Scores on each EF measure are also given,
although it should be noted the groups were not matched for age and IQ. Scores on verbal switching
were highly variable, so findings related to this assessment should be treated with caution.
This project was granted ethical approval from the Research Ethics Committee, London
South Bank University, and was discussed in detail with appropriate school staff before recruitment.
Informed consent for participation was obtained in writing (telephone permission occasionally) from
parents/guardians; children/students also gave their written consent and were told they could opt
out at any time. Testing took place across 3-8 sessions, making up 3½ hours for the complete
battery, usually at school but occasionally at the child’s home.
8
EF Tests
Executive-loaded working memory (ELWM). These tasks required concurrent processing and
storage. The verbal task was Listening Recall (Working Memory Test Battery for Children, WMTB-C,
Pickering & Gathercole, 2001). The Experimenter read a series of short sentences and the child
judged whether each was true/false (processing). The child then recalled the final word from each
sentence in correct serial order (storage). Trials commenced with list lengths of one item, and
proceeded to longer lists, with six trials per list length, until 4/6 trials were incorrect. Total trials
correct were scored, as this is more reliable than ‘span’ (Ferguson, Bowey & Tilley, 2002).
Test-retest reliabilities of .38-.83 are reported for relevant ages (Pickering & Gathercole, 2001).
The non-verbal ELWM task was the odd-one-out test (Henry, 2001). The Experimenter
displayed 3 cards depicting simple nonsense diagrams (horizontally orientated on 20x4cm cards).
The child pointed to the ’odd-one-out’ (processing). The spatial location of each odd-one-out card
was then recalled via a set of response sheets (20x30cm) depicting the relevant number of ‘empty’
cards (storage). Trials commenced with lists of one item, and proceeded to longer lists, with three
trials per list length, until 2/3 trials were incorrect. Total trials correct were scored. The span
version of this task has a reliability of .80 (Henry, 2001).
Fluency. Verbal Fluency (Delis-Kaplan Executive Functioning System, Delis, Kaplan & Kramer, 2001,
D-KEFS) involved two tasks, in which the child/young person was asked to generate as many words
as possible in one minute according to a criterion. ‘Letter fluency’ used the letters F, A and S;
‘category fluency’ used the semantic categories of ‘animals’ and ‘boy’s names’. Verbal fluency was
the average raw score from all five tasks.
Non-verbal fluency (Design Fluency, D-KEFS) required the use of a response booklet
9
possible in one minute, each in a different box, by connecting dots using four straight lines (with no
line drawn in isolation). Condition 1 contained only filled dots; Condition 2 contained arrays of filled
and empty dots and the child connected only empty dots. Design fluency was the average raw score
from these two conditions.
Test-retest reliabilities are reported as: letter (.67); category (.70); filled dots (.66); empty
dots (.43) (Delis et al., 2001).
Inhibition. A new test was developed, “Verbal Inhibition, Motor Inhibition” (VIMI) that had two
types of response: to copy the Experimenter; or to inhibit copying and produce an alternative
response. For Part A of the verbal task, the Experimenter said either ‘doll’ or ‘car’ and the
participant was asked to copy by repeating the same word (block 1). Next, in block 2, the child was
expected to inhibit this copying response: ‘if I say doll, you say car; and if I say car, you say doll’. This
was followed by a second ‘copy’ block and a second ‘inhibit’ block. Each of the 4 blocks consisted of
20 trials. This entire sequence of copy/inhibit blocks was repeated in Part B, with new stimuli (‘bus’
and ‘drum’).
The non-verbal motor task followed the same format, but words were replaced with hand
actions. For Part A, the stimuli were a pointed finger versus a fist; for Part B the stimuli were a flat
horizontal hand versus a flat vertical hand.
The combined number of errors made across Parts A and B on each task was used as the
measure of inhibition. Cronbach’s alpha, based on total error scores from Parts A and B was .915 for
10
Planning. The Sorting Test (D-KEFS) assessed verbal and non-verbal planning. Participants sorted
sets of 6 cards into two groups of three, in as many ways as they could. There were three possible
“verbal” sorts (e.g. transport/animals; things that fly/things that move along the ground); and five
possible “perceptual” sorts (e.g. small/large; straight/curved edges). Total numbers of correct
verbal/perceptual sorts were used as the measures of verbal/non-verbal planning respectively
(test-retest reliability reported as .49, Delis et al., 2001).
Switching. The Trail Making Test (D-KEFS) was the verbal measure.
Children joined small circles
containing letters and numbers alternately, in sequence (1-A-2-B-3-C through 16-P), involving
cognitive flexibility on a sequencing task based on easily named verbal items. Four control
conditions assessed component skills. Most relevant here were: Number Sequencing (connecting the
numbers 1-16); and Letter Sequencing, (connecting the letters A-P). “Switching cost” was the total
time taken for combined letter/number switching, minus the sum of the time taken for the number
and letter sequencing component skills. Test-retest reliabilities for measures contributing to
“switching cost” are reported as: number sequencing (.77), letter sequencing (.57); letter/number
switching (.20, Delis et al., 2001). Reliability for switching measures can be low, given they are
difference scores; consequently, somewhat lower reliabilities may be inevitable in this area (Miyake
et al., 2000).
The non-verbal switching test was Intra/Extra Dimensional Shift (Cambridge
Neuropsychological Test Automated Battery, Cambridge Cognition, 2006). This test of rule
acquisition and reversal involves simple stimuli made of coloured shapes and/or white lines: complex
stimuli involve both features. Initially, two coloured stimuli were presented on a computer screen,
and by touching one, the child learned from feedback which was ‘correct’, and followed a rule. Later,
the second dimension, an irrelevant white line (initially adjacent to the coloured shape, but then
11
yet the child still responded to the shape stimuli. The complex stimuli were later changed and the
child had to switch attention to the previously irrelevant dimension to obtain ‘correct’ responses
(‘extradimensional’ shift). Total error scores were used (test-retest reliability reported as .40,
Cambridge Cognition, 2006).
Results
Hierarchical multiple regression analyses were carried out with each of the 10 EF measures
as dependent variables (see online Appendix for full correlation matrix of EF measures) to assess
group differences in performance. Age and non-verbal IQ (BAS-II Matrices T-score) were entered at
Step 1 to control for differences in EF performance associated with age and non-verbal intellectual
ability. The dummy-coded group variables (LLF, typical) were entered at Step 2 (children with SLI
were the reference group) to assess whether, after controlling for age and non-verbal IQ, group
differences in performance remained. Table 2 summarises information for Step 2 of each
regression. Significant group differences (indicated by a significant change in R2 at Step 2) were
found for six of the 10 EF measures: verbal and non-verbal ELWM; verbal and non-verbal fluency;
non-verbal inhibition; and non-verbal planning.
The SLI group obtained significantly poorer scores on these six measures than typical
children, even when the effects of age and non-verbal IQ had been taken into account. For three
further EF variables (verbal inhibition, verbal planning, non-verbal switching), the beta-values at Step
2 showed that when all predictor variables were adjusted in relation to one another, group was
significant. Nevertheless, these three effects must be regarded as less robust than the others,
because the overall significance of the change in variance (R2) accounted for by group at Step 2 of
the model was not significant.
Most analyses failed to identify significant differences between the LLF and SLI groups,
12
exception was verbal fluency; here children with LLF obtained significantly higher scores than
children with SLI.
Table 2 about here
Further regression analyses were carried out in which verbal IQ was entered at Step 2 in
addition to non-verbal IQ and age. This stringent control assessed whether EF difficulties were
independent of both non-verbal and verbal abilities. Table 3 summarises these regressions,
including information relating to Step 2 in each case.
Significant group differences (indicated by a significant change in R2 at Step 2) were found
for five of the 10 EF measures: ELWM (verbal and non-verbal); verbal fluency; non-verbal inhibition;
and non-verbal planning. The SLI group obtained significantly poorer scores than typical children on
these measures even when the effects of age, non-verbal andverbal IQ had been taken into
account. For non-verbal fluency, the beta-values at Step 2 indicated that when all predictor
variables were adjusted in relation to one another, group was significant. Again, this finding should
be regarded as less robust than the others, because the significance of the change in variance
accounted for at Step 2 of the model by group (R2) was not significant. Children with LLF never
differed significantly from children with SLI, suggesting their difficulties with EF were as great as
those who had more severe levels of language impairment.
13
In all the regression analyses, key statistical checks (e.g. Durbin-Watson, tolerance/VIF
statistics, Cook’s/Mahalanobis distances, standardised DFbetas, plots of standardised
residuals/predicted standardised values, standardised residuals, partial plots) suggested the
absence of both multicollinearity and cases with undue influence, and revealed no evidence for
outliers (Field, 2005).
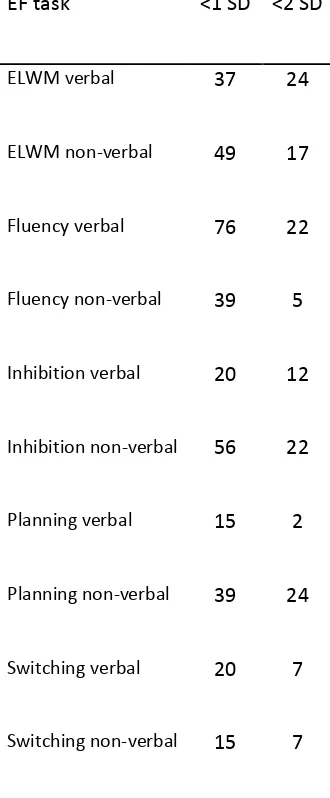
Table 4 shows, for each EF measure, the percentage of children with SLI who had scores that
were 1 or 2 SDs below the means for typical children of the same chronological age range (n=63,
8-14 years). Between 15 and 76% of the EF scores for children with SLI were 1 SD below the mean of
the typical children; and up to a quarter were below 2 SD of the mean. The numbers of children
with SLI who had impaired performance on EF tasks, using the 1 SD cut-off, were as follows: 12
children had impairments on 1/2 tasks (29%); 12 children on 3/4 tasks (29%); 10 children on 5/6
tasks (24%), and 5 children on 7/8 tasks (12%). Only 2 children with SLI (5%) obtained typical scores
on all EF tasks and none showed deficits on 9/10 tasks.
Table 4 about here
Discussion
Children with SLI showed significant difficulties with EF skills compared to typical children. Initial
regression analyses of group differences in performance, when controlling for age and non-verbal
IQ, revealed that individuals with SLI obtained lower scores than typical children on six of the 10
executive tasks including: verbal and non-verbal ELWM; verbal and non-verbal fluency; non-verbal
14
In a second set of regression analyses, a more stringent approach was adopted by
controlling for verbal IQ in addition to age and non-verbal IQ, before examining group differences in
EF. Controlling for verbal IQ is likely to reduce the chance of finding group differences between
individuals with and without SLI, as verbal IQ should play an influential role in group membership.
Group differences remained on five of the EF measures, which constituted persuasive evidence that
executive skills were weak in individuals with SLI, over and above both their non-verbal and verbal
intellectual abilities. The EF difficulties related to ELWM (verbal/non-verbal measures); verbal
fluency; non-verbal inhibition; and non-verbal planning. Group differences for non-verbal fluency
were less marked, but in other respects the results of the two sets of regressions were compatible.
An important feature of the findings was that executive difficulties in children with SLI were
not confined to verbal EF tasks but extended to non-verbal measures. This could reflect a general
cognitive difficulty as suggested by Ullman and Pierpont (2005). Alternatively, verbal mediation may
be involved in EF through the use of verbal self-reminding (Russell et al., 1999) or reflective
consciousness (Marcovitch & Zelazo, 2009). If verbal mediation were occurring on most EF tasks,
one might expect verbal IQ to be significantly related to EF (as indicated by the beta-values). This
occurred in only two instances (verbal ELWM, verbal fluency, see Table 3); and for both of these
tasks performance may have been aided by better vocabulary abilities, not necessarily by verbal
mediation. Therefore, in general, the findings were consistent with EF performance not being the
result of verbal mediation, but involving a domain general impairment in SLI (Ullman & Pierpont,
2005). However, further research is required before firm conclusions can be drawn, with an
interesting possibility being the use of articulatory suppression to investigate whether eliminating
verbal mediation affects performance (Wallace, Silvers, Martin & Kenworthy, 2009).
The EF difficulties were clinically meaningful, as two-thirds of the children with SLI showed at
least 3 EF impairments; and, in each of the six areas of EF that were significant in the regressions,
15
that between 35 and 50% show EF impairments (Nigg, Willcutt, Doyle & Sonuga-Barke, 2004).
Given these findings a limitation of the current study should be noted: although no children with SLI
had diagnoses of ADHD, we did not assess sub-clinical levels of attention deficit, which could have
depressed EF performance. In addition, many regression models were not a good fit to the data
with the percentage of variance accounted for ranging from 7 to 60% (highest for ELWM and
fluency), so other factors are clearly important for EF.
The findings also suggested that children with less severe language difficulties (low language
functioning, LLF) had significant problems with EF. For virtually every executive measure, the
regression analyses did not distinguish between individuals with SLI and LLF. This implied that even
a moderate degree of language impairment was associated with weak EF.
The finding of low EF in the SLI group in both verbal and non-verbal domains, and even after
verbal ability had been controlled, raises important questions about the cognitive abilities of the SLI
group. Previous investigations have pointed to these young people having difficulties with some
non-verbal tasks (Bishop, 2002; Cowan et al., 2005; Johnston & Ellis Weismer, 1983). Our findings
extend this line of research and indicate a general difficulty with more complex forms of cognition
that involve EF, regardless of modality. Such findings call into question the ‘specific’ nature of SLI as
a disorder and are consistent with multiple deficit models (e.g. Bishop, 2006) where impairments
with different aetiologies, such as phonological short-term memory, syntax, etc., can have additive
effects that contribute to the likelihood of clinically significant language difficulties. In this way, EF
may contribute to the profile of causal risk and protective factors in SLI. Future research is needed
to assess whether co-morbidity of SLI with other developmental disorders might also vary with level
16
Another important issue concerns whether children with SLI can be helped by
interventions/strategies that target EF abilities. Dealing with novelty is the hallmark of executive skill
and non-optimal executive abilities may jeopardise educational performance (St Clair-Thompson &
Gathercole, 2006). With broad and varied executive difficulties, remediation strategies beyond those
confined to language and verbal short-term memory may be helpful (e.g. reducing task-related
ELWM loads, “hints” for generating/planning solutions to problems, reminders to inhibit prepotent,
but unhelpful/immature responses/strategies).
Conclusion
Children with SLI showed difficulties on a range of verbal and verbal EF tasks after age,
non-verbal and non-verbal IQ had been taken into account. Specific areas of EF difficulty were: non-
verbal/non-verbal ELWM; verbal/non-verbal fluency; non-verbal/non-verbal inhibition; and non-verbal/non-verbal planning. Children with milder
forms of language impairment showed the same EF impairments as those with SLI, indicating that
individuals with SLI and low language functioning have a broader set of cognitive difficulties than has
17 Key Points
(1) Children with specific language impairment (SLI) have difficulties with language, but it is unclear whether they have additional broader cognitive problems.
(2) This research assessed higher level thinking and reasoning skills, "executive functioning" (EF), in children with SLI.
(3) Marked difficulties on a range of EF skills were found, and these were present even after stringent controls for age, verbal and non-verbal IQ.
(4) EF difficulties were also found for children with ‘low language functioning’, who did not meet the criteria for SLI.
18
Acknowledgements: This research was funded by the Economic and Social Research Council grant
number RES-062-23-0535. We would like to thank the children, teachers, parents and Speech and
Language Therapists who kindly helped with this project.
Correspondence:
Lucy Henry
Department of Psychology
London South Bank University
103, Borough Road
London, UK, SE1 0AA
0044 7771 626936
19 References
American Psychiatric Association. (1994). Diagnostic and statistical manual of mental disorders. (4th
Ed.). Washington, DC: American Psychiatric Association.
Archibald, L.M.D., & Gathercole, S.E. (2006). Visuospatial Immediate Memory in Specific Language
Impairment. Journal of Speech, Language & Hearing Research, 49(2), 265-277.
Bishop, D.V.M. (2002). Motor immaturity and specific speech and language impairment: Evidence
for a common genetic basis. American Journal of Medical Genetics, 114, 56-63.
Bishop, D.V.M. (2006). Developmental cognitive genetics: How psychology can inform genetics and
vice versa. Quarterly Journal of Experimental Psychology, 59(7), 1153-1168.
Bishop, D.V.M., & Norbury, C.F. (2005a). Executive functions in children with communication
impairments, in relation to autistic symptomatology: I: Generativity. Autism, 9(1), 7-27.
Bishop, D.V.M., & Norbury, C.F. (2005b). Executive functions in children with communication
impairments, in relation to autistic symptomatology: 2: Response inhibition. Autism, 9(1),
29-43.
Cambridge Cognition. (2006). The Cambridge Neuropsychological Test Automated Battery
(CANTAB®): Test-Retest Reliability Characteristics. Cambridge: Cambridge Cognition Ltd.
Cowan, R., Donlon, C., Newton, E.J. & Lloyd, D. (2005). Number skills and knowledge in children with
specific language impairment. Journal of Educational Psychology, 97, 732-744.
Delis, D.C., Kaplan, E., & Kramer, J.H. (2001). Delis–Kaplan Executive Function System (D-KEFS).
London: The Psychological Corporation Ltd.
Dibbets, P. Bakker, K., & Jolles, J. (2006). Functional MRI of Task Switching in Children with Specific
Language Impairment (SLI). Neurocase, 12(1), 71-79.
Elliot, C.D., Smith, P., & McCullough, K. (1996). British Ability Scales (Second Edition). Texas:
20
Ellis Weismer, S., Evans, J., & Hesketh, L. J. (1999). An Examination of Verbal Working Memory
Capacity in Children With Specific Language Impairment. Journal of Speech, Language &
Hearing Research, 42(5), 1249-1260.
Ferguson, A.N., Bowey, J.A. & Tilley, A. (2002). The association between auditory memory span and
speech rate in children from kindergarten to sixth grade. Journal of Experimental Child
Psychology, 81, 141-156.
Field, A. (2005). Discovering statistics using SPSS, Second Edition. SAGE: London.
Friedman, N.P., Miyake, A., Corley, R.P., Young, S.E., DeFries, J.C. & Hewitt, J.K. (2006). Not all
executive functions are related to intelligence. Psychological Science, 17(2), 172-179.
Geurts, H.M., Verte, S., Oosterlaan, J., Roeyers, H. & Sergeant, J.A. (2004). How specific are executive
functioning deficits in attention deficit hyperactivity disorder and autism? Journal of Child
Psychology and Psychiatry, 45(4), 836-854.
Gopnik, M., & Crago, M.B. (1991). Familial aggregation of a developmental language disorder.
Cognition, 39, 1-50.
Henry, L. A. (2001). How does the severity of a learning disability affect working memory
performance? Memory, 9, 233-247.
Hill, E.L. (2004). Evaluating the theory of executive dysfunction in autism. Developmental Review, 24,
189-233.
Huizinga, M., Dolan, C., & van der Molen, M. (2006). Age related change in executive function:
Developmental trends and a latent variable analysis. Neuropsychologia, 44, 2017-2036.
Im-Bolter, N., Johnson, J., & Pascual-Leone, J. (2006). Processing Limitations in Children With Specific
Language Impairment: The Role of Executive Function. Child Development, 77(6), 1822-1841.
Johnston, J. & Ellis Weismer, S. (1983). Mental rotation abilities in language disordered children.
21
Kiernan, B., Snow, D., Swisher, L., & Vance, R. (1997). Another look at nonverbal rule induction in
children with SLI: Testing a flexible reconceptualization hypothesis. Journal of Speech,
Language & Hearing Research, 40(1), 75.
Lehto, J.E., Juujärvi, P., Kooistra, L. & Pulkkinen, L. (2003). Dimensions of executive functioning:
Evidence from children. British Journal of Developmental Psychology, 21, 59-80.
Leonard, L.B., Ellis Weismer, S., Miller, C.A., Francis, D.J., Tomblin, J.B. & Kail, R.V. (2007). Speed of
processing, working memory, and language impairment in children. Journal of Speech,
Language, and Hearing Research, 50, 408-428.
Levin, H.S., Culhane, K.A., Hartmann, J., Evankovich, K., Mattson, A.J., Harward, H., Ringholz, G.,
Ewing-Cobbs L. & Fletcher, J.M.. (1991). Developmental changes in performance on tests of
purported frontal lobe functioning. Developmental Neuropsychology, 7, 377-395.
Marton, K. (2008). Visuo-spatial processing and executive functions in children with specific language
impairment. International Journal of Language & Communication Disorders, 43(2), 181-200.
Marton, K. & Schwartz, R.G. (2003). Working Memory Capacity and Language Processes in Children
With Specific Language Impairment. Journal of Speech, Language & Hearing Research, 46(5),
1138-1153.
Messer, D., Dockrell, J. & Murphy, N. (2004). The relation between naming and literacy in children
with word finding difficulties. Journal of Educational Psychology, 96, 462-470,.
Miyake, A., Friedman, N.P., Emerson, M.J., Witzki, A.H., Howerter, A. & Wager, T.D. (2000). The Unity
and Diversity of Executive Functions and Their Contributions to Complex "Frontal Lobe"
Tasks: A Latent Variable Analysis. Cognitive Psychology, 41(1), 49-100.
Montgomery, J.W. (2002). Understanding the Language Difficulties of Children With Specific
Language Impairments: Does Verbal Working Memory Matter? American Journal of
22
Nigg, J.T., Willcutt, E.G., Doyle, A.E. & Sonuga-Barke, E.J.S. (2004). Causal heterogeneity in
attention-deficit/hyperactivity disorder: Do we need neuropsychologically impaired subtypes?
Biological Psychiatry, 57, 1224-1230.
Ozonoff, S. & Jensen, J. (1999). Specific executive function profiles in three neurodevelopmental
disorders. Journal of Autism and Developmental Disorders, 29(2), 171-177.
Pennington, B.F., & Ozonoff, S. (1996). Executive Functions and Developmental Psychopathology.
Journal of Child Psychology & Psychiatry, 37(1), 51-87.
Pickering, S. & Gathercole, S.E. (2001). Working Memory Test Battery for Children (WMTB-C).
London: Psychological Corporation Ltd.
Rice, M.L. & Wexler, K. (1996). A phenotype of specific language impairment: Extended optional
infinitives. In M.L. Rice (Ed.), Toward a genetics of language (pp. 215-237). Mahwah, NJ:
Lawrence Erlbaum Associates.
Russell, J., Jarrold, C. & Hood, B. (1999). Two intact executive capacities in children with autism:
Implications for the core executive dysfunctions in the disorder. Journal of Autism and
Developmental Disorders, 29:2, 103-112.
Semel, E., Wiig, E.H., & Secord, W.A. (2006). Clinical Evaluation of Language Fundamentals CELF-4 UK
(4th Ed.). London: The Psychological Corporation Ltd.
St Clair-Thompson, H.L. & Gathercole, S.E. (2006). Executive functions and achievements in school:
Shifting, updating, inhibition, and working memory. Quarterly Journal of Experimental
Psychology,59, 745-759.
Thomas, M.S.C., Annaz, D., Ansari, D., Scerif, G., Jarrold, C. & Karmiloff-Smith, A. (2009). Using
developmental trajectories to understand developmental disorders. Journal of Speech,
23
Ullman, M.T., & Pierpont, E I. (2005). Specific language impairment is not specific to language: The
procedural deficit hypothesis. Cortex, 41(3), 399-433.
van der Lely, H.K.J. (2005). Domain-specific cognitive systems: Insight from grammatical-SLI. Trends
in Cognitive Sciences, 9(2), 53-59.
Wallace, G.L., Silvers, J.A., Martin, A. & Kenworthy, L.E. (2009). Further evidence for inner speech
deficits in autism spectrum disorders. Journal of Autism and Developmental Disorders, 39,
1735-1739.
Welsh, M.C., Pennington, B.F., & Groisser, D.B. (1991). A normative-developmental study of
executive function: A window of prefrontal function in children. Developmental
Neuropsychology, 7(2), 131-149.
Weyandt, L.L., & Willis, W.G. (1994). Executive functions in school-aged children: Potential efficacy
of tasks in discriminating clinical groups. Developmental Neuropsychology, 10(1), 27-38.
Marcovitch, S. & Zelazo, P.D. (2009). A heirarchical competing systems model of the emergence and
24
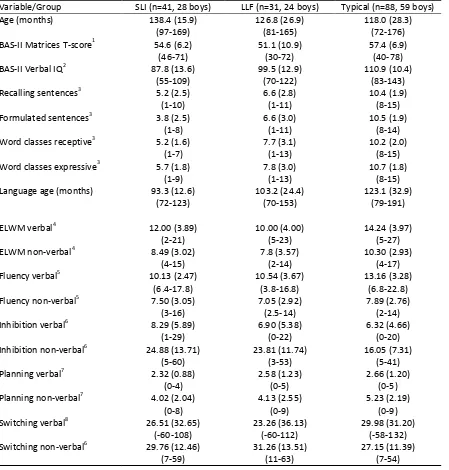
Table 1. Summary of means/SDs/ranges for descriptive/EF variables: children with specific language
impairment (SLI); low language functioning (LLF); and typical development.
Variable/Group SLI (n=41, 28 boys) LLF (n=31, 24 boys) Typical (n=88, 59 boys) Age (months) 138.4 (15.9)
(97-169)
126.8 (26.9) (81-165)
118.0 (28.3) (72-176) BAS-II Matrices T-score1 54.6 (6.2)
(46-71)
51.1 (10.9) (30-72)
57.4 (6.9) (40-78) BAS-II Verbal IQ2 87.8 (13.6)
(55-109)
99.5 (12.9) (70-122)
110.9 (10.4) (83-143) Recalling sentences3 5.2 (2.5)
(1-10)
6.6 (2.8) (1-11)
10.4 (1.9) (8-15) Formulated sentences3 3.8 (2.5)
(1-8)
6.6 (3.0) (1-11)
10.5 (1.9) (8-14) Word classes receptive3 5.2 (1.6)
(1-7)
7.7 (3.1) (1-13)
10.2 (2.0) (8-15) Word classes expressive3 5.7 (1.8)
(1-9)
7.8 (3.0) (1-13)
10.7 (1.8) (8-15) Language age (months) 93.3 (12.6)
(72-123)
103.2 (24.4) (70-153)
123.1 (32.9) (79-191)
ELWM verbal4 12.00 (3.89) (2-21)
10.00 (4.00) (5-23)
14.24 (3.97) (5-27) ELWM non-verbal4 8.49 (3.02)
(4-15)
7.8 (3.57) (2-14)
10.30 (2.93) (4-17) Fluency verbal5 10.13 (2.47)
(6.4-17.8)
10.54 (3.67) (3.8-16.8)
13.16 (3.28) (6.8-22.8) Fluency non-verbal5 7.50 (3.05)
(3-16)
7.05 (2.92) (2.5-14)
7.89 (2.76) (2-14) Inhibition verbal6 8.29 (5.89)
(1-29)
6.90 (5.38) (0-22)
6.32 (4.66) (0-20) Inhibition non-verbal6 24.88 (13.71)
(5-60)
23.81 (11.74) (3-53)
16.05 (7.31) (5-41) Planning verbal7 2.32 (0.88)
(0-4)
2.58 (1.23) (0-5)
2.66 (1.20) (0-5) Planning non-verbal7 4.02 (2.04)
(0-8)
4.13 (2.55) (0-9)
5.23 (2.19) (0-9) Switching verbal8 26.51 (32.65)
(-60-108)
23.26 (36.13) (-60-112)
29.98 (31.20) (-58-132) Switching non-verbal6 29.76 (12.46)
(7-59) 31.26 (13.51) (11-63) 27.15 (11.39) (7-54) 1
Standard score mean=50, SD=10; 2Standard score mean=100, SD=15; 3Standard score mean=10,
SD=3. 4Trials correct; 5items generated per minute; 6number of errors; 7correct sorts; 8switch cost
25
Table 2. Summary details of regressions predicting performance on each EF measure. For each
regression, two predictor variables were entered in a block at Step 1 (age, non-verbal IQ; note Step 1
of each model is not shown). Two further dummy-coded group variables were entered in a block at
Step 2 (SLI-versus-LLF group, SLI-versus-typical group). The information provided about Step 2 of
each model involves total variance accounted for (total R2), standardised beta-values for each
predictor variable, and change in R2. Significance values indicated where relevant.
Executive
Functioning
Measure
Total R2
accounted for
by the model
Details of Step 2 for each regression
Age β NVIQ β SLI-v-LLF β
SLI-v-Typical
∆R2 Step 2
ELWM verbal .48 .54*** .31*** .05 .42*** .13***
ELWM non-verbal .40 .44*** .32*** .05 .39*** .11***
Fluency verbal .56 .54*** .33*** .20** .58*** .22***
Fluency non-verbal .41 .59*** .26*** .08 .25** .04**
Inhibition verbal .07 -.18* -.12 -.16 -.24* .041
Inhibition
non-verbal
.20 -.13 -.19* -.09 -.42*** .12***
Planning verbal .12 .24** .23** .17 .20* .03
Planning
non-verbal
.29 .46*** .18* .13 .41*** .11***
Switching verbal .10 -.29*** -.10* -.11 -.04 .01
Switching
non-verbal
27
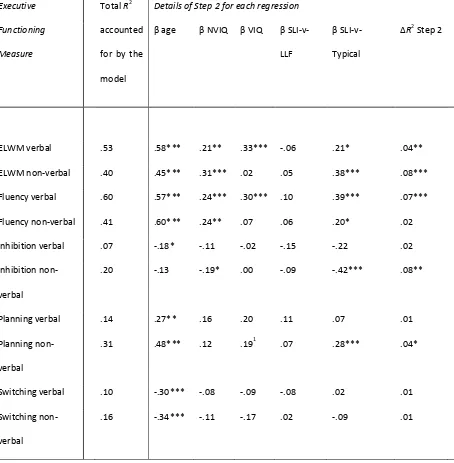
Table 3. Summary details of regressions predicting performance on each EF measure. For each
regression, three predictor variables were entered in a block at Step 1 (age, non-verbal IQ, verbal IQ;
note Step 1 of each model is not shown). Two further dummy-coded group variables were entered in
a block at Step 2 (SLI-versus-LLF group, SLI-versus-typical group). The information provided about
Step 2 of each model involves total variance accounted for (total R2), standardised beta-values for
each predictor variable, and change in R2. Significance values indicated where relevant.
Executive
Functioning
Measure
Total R2 Details of Step 2 for each regression
accounted
for by the
model
β age β NVIQ β VIQ β
SLI-v-LLF
β
SLI-v-Typical
∆R2 Step 2
ELWM verbal .53 .58*** .21** .33*** -.06 .21* .04**
ELWM non-verbal .40 .45*** .31*** .02 .05 .38*** .08***
Fluency verbal .60 .57*** .24*** .30*** .10 .39*** .07***
Fluency non-verbal .41 .60*** .24** .07 .06 .20* .02
Inhibition verbal .07 -.18* -.11 -.02 -.15 -.22 .02
Inhibition
non-verbal
.20 -.13 -.19* .00 -.09 -.42*** .08**
Planning verbal .14 .27** .16 .20 .11 .07 .01
Planning
non-verbal
.31 .48*** .12 .191 .07 .28*** .04*
Switching verbal .10 -.30*** -.08 -.09 -.08 .02 .01
Switching
non-verbal
29
Table 4. Percentage of children with SLI showing impairments on each EF measure (performance at
or below 1/2 SD of the mean for typical children of the same age range).
EF task <1 SD <2 SD
ELWM verbal 37 24
ELWM non-verbal 49 17
Fluency verbal 76 22
Fluency non-verbal 39 5
Inhibition verbal 20 12
Inhibition non-verbal 56 22
Planning verbal 15 2
Planning non-verbal 39 24
Switching verbal 20 7