City, University of London Institutional Repository
Citation
:
Raoufi, N., Surre, F., Sun, T., Rajarajan, M. and Grattan, K. T. V. (2012). Wavelength dependent pH optical sensor using the layer-by-layer technique. Sensors and Actuators B Chemical, 169, pp. 374-381. doi: 10.1016/j.snb.2012.05.024This is the unspecified version of the paper.
This version of the publication may differ from the final published
version.
Permanent repository link:
http://openaccess.city.ac.uk/3621/Link to published version
:
http://dx.doi.org/10.1016/j.snb.2012.05.024Copyright and reuse:
City Research Online aims to make research
outputs of City, University of London available to a wider audience.
Copyright and Moral Rights remain with the author(s) and/or copyright
holders. URLs from City Research Online may be freely distributed and
linked to.
City Research Online: http://openaccess.city.ac.uk/ [email protected]
Wavelength Dependent pH Optical Sensor Using
the Layer-by-Layer Technique
Nahid Raoufi
a,b, Frederic Surre
b, Tong Sun
b, Muttukrishnan Rajarajan
b, Kenneth
T.V.Grattan
ba Islamic Azad University – South Tehran Branch, Tehran, Iran
b School of Engineering and Mathematical Science, City University London, Northampton Square, London, EC1V 0HB, UK
E-mail: [email protected]
Abstract
In this work, the design and characteristics of a wavelength-dependent pH optical sensor have been studied. To create the sensor itself, brilliant yellow (BY) as a pH indicator and poly (allylamine hydrochloride) [PAH] as a cross-linker have been deposited on the end of a bare silica core of an optical fibre by use of a ‘layer-by-layer’ technique. In the experiments carried out to characterize the sensor, it was observed that the value of pKa (the dissociation constant) of the thin film is dependent both on the outer layer and the number of bilayers. A heat treatment process was applied to the sensor to reduce the effect on the deposited layers during the testing of the probe. As a result of these series of experiments, it could be concluded that the probe design on which were deposited structured layers comprising six double layers of (PAH/BY) showed the best sensitivity for a pH range from 6.80 to 9.00 (with an accuracy of ±0.20) and showing an average wavelength shift of 4.65 nm per 0.2 pH units, while the concentration of the BY and the PAH solutions was maintained as 0.25mM and 2.5mM respectively.
Key words: Brilliant yellow, pH sensor, optical sensor, Layer-by-Layer (LbL)
1. Introduction
The ‘Layer-by-Layer’ (LbL) deposition technique is one of the most frequently utilized methods for preparing multilayered thin films on different substrates e.g. glass, ceramics, metals, wood, plastics and so on [1-4] of any size and topology [5, 6]. In essence, the process is based on the electrostatic attraction of opposite charges and can be used with various reagents such as polymers [7], nanoparticles [8, 9], metals [10], dyes[11, 12], quantum dots [13], nanotubes [14], biomolecules like enzymes [15], proteins [16], etc. The technique is based simply on the alternate dipping of a charged substrate into cationic and anionic solutions. The electrostatic attraction that exists between the opposite charged molecules in every monolayer is the driving force in forming the layers and hence in creating an increasing coating thickness. However, in order to use these coated substrates for optical sensing, it is important to maintain an optically homogeneous surface. Furthermore, several important optical properties can be controlled through the layer thickness, the numbers of layers and their composition. Additionally, the layer thickness depends on the temperature, the pH and the concentration of the polyion solutions, as well as the dipping time.
refractiv S119, si measure more wi research producti and Prus the prese change c prepared sensitivi (and in perform
2. Mat
2.1 Dye In this w pH indic chemica is negati groups a colour c 497nm iFig. 1 The (BY)
2.2 Poly It is gen requisite simply s layer [3 moreove
ve index is th ilica nanopa ement or gas idely than ot h and industr ion processes ssian blue ha ent study, br compared to d in this wo ity. In additi particular th ance reviewe
terial and M
e and Reage work, in orde cator. BY wa al structure is ively charge are able to b changes from in UV-visible
e chemical stru and (below) Po
ymer nerally accep e layers in E
spread out a 0]. It is com er, using the
he basis for a articles, alum s recognizing ther types of rial applicatio
s. To date, a ave been dep rilliant yellow the use of o ork are cons ion, the char he contributi
ed.
Methods
ent
er to create a as chosen as s shown in F d due to the be dissociate m yellow in p e spectroscop
cture of (above oly(allylamine h
pted that ma Electrostatic S
and occupy m mmon for bo
polymers fo
a humidity o minium oxid g [9, 20, 23-f sensors due ons e.g. oil a limited num posited onto w is applied a other indicato sidered indic racteristics o on of the la
an effective o it has consid Fig. 1(a) and
presence of ed at high pH
pH 6.4 to red py. This mol
e) brilliant yello hydrochloride)
acromolecule Self-Assemb more surfac oth negative or either a po
or a gas senso de, poly-R an -26]. Howev e to the impo and gas indus mbers of pH i
optical fibre as an indicat ors. The wav cating the n of the probes ast deposited
optical pH se derable wave its absorban f two sulfona H and make d-orange in p lecule is stro
ow Fi
pH
e materials a bly (ESA) [1 e area witho
and positive ositive or a n
or when chem nd prussian ver, optical p ortance of pH
stry, pharma indicators su es to create p tor because o velength shift novelty of th s created wi d layer on th
ensor, brillia elength shift nce spectra a ate groups. In e a stronger
pH 8.0 while ongly water s
ig. 2 Absorbanc H buffer solutio
are more suit ]. Hence, th out increasin e charged la negative laye
micals such blue were a pH sensors h H measurem aceutical, man uch as neutral
pH sensors [ of better wav ft and the sen his approach ith differing he probe) are
nt yellow (B compared to re shown in n addition tw
negatively c e pKa is 7.2
oluble.
ce spectra of br ons.
table for use e larger mol ng the thickn
yers to be s er has been r
as PDDA, P applied for have been co ment in both s anufacturing al red, methyl
[7, 11, 12, 2 velength shift nsitivity of th h and the ac numbers of e evaluated a
BY) was sele o other indic Fig.2. This m wo phenolic charged mole
and shows a
rilliant yellow i
e for buildin lecular weigh ness of the selected as p reported [3, 5
PSS, poly humidity onsidered scientific and food lene blue 7-29]. In t with pH he probes chievable f bilayers
and their
ected as a cators. Its molecule hydroxyl ecule. Its a peak in
in different
[image:3.595.71.268.445.613.2] [image:3.595.332.532.456.614.2]the present work PAH is used as a polycation and Fig. 1(b) shows its chemical structure where the amine group in PAH provides the positive charge.
2.3 Types of chemicals and solutions
The indicator and chemicals used and applied to develop the optical sensors were brilliant yellow dye (content 70%, Poly(allylamine hydrochloride) and average molecular weight (MW) ~15,000) and H2SO4.
The probes used, having a variety of compositions were prepared by use of the Layer-by-Layer technique and were tested in pH buffer solutions. In order to prepare the wide range of pH buffer solutions from acidic to alkaline, the mixture of 2.5 mM NaH2PO4 and 2.5 mM citric acid monohydrate in distilled water was used and aqueous NaOH was applied to adjust the desired pH.
In order to create a mirror at the distal end of the fibre, 2 ml of 0.1M AgNO3 was placed in a vial and NH3 solution then added drop by drop until the brown sediment dissolved. 1.4 ml of 0.8 M KOH was added to the vial, and if brown precipitate re-formed NH3 was used dropwise to create a clear solution – the solution being Tollen’s reagent. The cleaned fibre core was rinsed with 0.2% SnCl2 solution, followed by distilled water and was then dipped into the vial containing the Tollen’s reagent. By adding 0.4ml of 0.25M dextrose to the vial silver starts to cover the surface and the mirror was ready in approximately 1 minute.
2.4 Sensor probe preparation
To create the sensor probe, a silica multimode fibre with a core diameter of 600 µm was used. The fibre has a low optical attenuation (low OH) which exhibits transmission over the spectral range from the visible to the NIR (400 to 2200nm) e.g. 4dB/km at 800nm,with a numerical aperture (NA) of 0.37 [32], and with the fibre supplied by Thorlabs. To create an evanescent sensor a part of the fibre was stripped from the jacket and polished with 5 µm, 3 µm, 1 µm and 0.3 µm stone-papers respectively. As the cladding is acetone soluble, it was easily removed. The distal end of the fibre was treated with piranha solution (30:70 (v/v) mixture of H2O2 (30%) and concentrated H2SO4) for 60 minutes to produce the negatively charged surface and was then rinsed in distilled water followed by drying with compressed nitrogen. To reflect the radiated light back and guide it to the other end of the fibre, a mirror was placed at the tip of the fibre allowing it to be ready to be coated with positively charged molecules.
The layer-by-layer technique is based on the successive deposition of oppositely charged molecules onto the solid surface; the negatively charged fibre was dipped into the polycation solution for 5 minutes. As a result, a thin layer of the positive molecules is adsorbed onto the surface. The fibre was then dipped into the distilled water for 5 minutes to remove unbonded molecules from its surface; the substrate was alternately placed into the polyanion solution for a further 5 minutes and unbonded molecules were again washed out using distilled water. This procedure was repeated to build up a multilayer coating. Each pair of negatively and positively charged layers is called a bilayer and the number of bilayers is shown by the subscript e.g. (PAH/BY)9 means 9 bilayers of PAH and BY were coated on the fibre.
2.5 Experimental setup
portion of the total light is absorbed at a specific wavelength by the sensing layer with the remaining light emitted through the other end of the fibre coupler and is guided to the spectrometer. The output from the spectrometer was then displayed using the spectroscopy application software. The probe was designed using a coated optical fibre (polycation/polyanion)n and was successively dipped into buffer solutions with increasing pH.
Fig. 3 The experimental setup applied to measure the
optical performance of the fabricated optical sensor
(All component images have been extracted from
http://www.oceanoptics.com)
Fig. 4 The wavelength shift and absorbance change
when increasing numbers of bilayers are added to the
surface. The concentration of PAH and BY in saline
solution were 1.5 and 0.25 mM respectively.
Destruction of bilayers happens when the coated surface is immersed in the pH buffer solution. However, a thermal treatment was used in which the coated substrate was cured at 120°C for 2 hours and then at 100°C for a further 2 hours. The thickness of the film increases as further numbers of bilayers are added onto the surface and thus to monitor the effect, the change in the absorbance and the wavelength at which this occurs is recorded. The peak wavelength shifts to higher values with lower number of bilayers used in the probe while with adding a further number of bilayers, the peak wavelength remains constant. Absorbance, in contrast, increases continuously with the number of bilayers. Fig. 4 displays the peak wavelength and absorbance as a function of the number of bilayers for brilliant yellow deposited on a glass slide. As this graph shows, the peak wavelength remains the same level after 6 bilayers are coated. Further it shows that this zone is suitable as the basis of the performance of the sensor.
3. Results and Discussion
3.1 Experiments on optical fibre
To study the characteristics of the sensors which had been prepared by building up the pH indicator on the distal end of the optical fibre, a suitable experimental setup was developed.
[image:5.595.317.564.169.337.2] [image:5.595.84.289.169.318.2]
0 2 1
1 ( )
1 10
x x pA
A
y
A
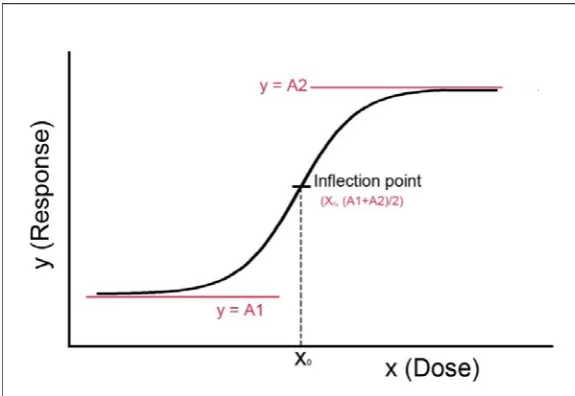
(1) where A1 and A2 are minimum and maximum values of y respectively, p is the slope factor and x0 is the Dose value when the response is halfway between A1 and A2. The more sensitive probe shows a dramatic wavelength shift from A1 to A2 while the steeper area introduces the range of pH in which the sensor has a good performance in comparison with other pHs.
Fig. 5 Dose‐Response curve sample
The first derivative of Equation (1) shows an inflection point which reveals the average slope of the curve in the steeper region which can be written as:
y(1) = p.ln(10).(A2 - A1) = 2.3p(A2 - A1) (2)
The inflection point in this graph has a (x0, (A1+A2)/2) coordinate and it demonstrates the pKa of the thin film which is a function of the degree of ionization, revealing the pH at which 50% of the thin film functional groups are ionized[33]. The pKa is given by –log10Ka, where Ka is the acid dissociation constant which is the equilibrium constant of the dissociation reaction in the context of the acid-base reaction in which an acid is ionized reversibly into its conjugate base and the hydrogen ion. As Choi et.al. have discussed in the literature [33], the effective pKa of a polyelectrolyte substantially differs from that in the solution state value when incorporated into a multilayer film. On the other hand, the degree of ionization affects the thickness of the bilayer [33]; likewise adding a copolymer such as salt to the polyelectrolyte solution increases the film thickness and the degree of ionization [31].
Furthermore, the pH of the polyelectrolyte solution is an important parameter that can change the degree of ionization and it can then allow for a thicker or thinner multilayer film [30]. Therefore, every thin film has its own pKa (dissociation constant) which depends on specific factors such as utilizing a copolymer, the pH of the polyelectrolyte solution and the degree of ionization of the deposited material.
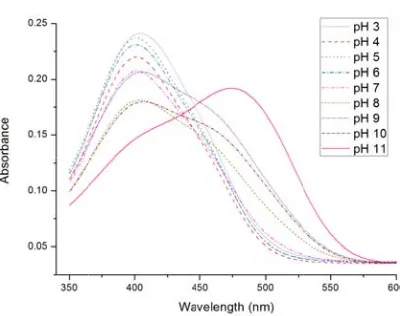
[image:6.595.143.431.191.389.2]Fig. 6 Absorbance spectra for the optical fibre coated
with 10 double layers of (PAH/BY) and one further
PAH layer in different pH buffer solutions.
Fig. 7 The peak wavelength for each spectrum with
respect to pH for Probe coated by (PAH/BY)10PAH.
3.2 Fabrication of the sensor with brilliant yellow (BY)
The concentrations of the PAH and BY solutions (in 150mM saline solution) respectively were identical at 2.5mM and 0.25 mM for all samples. The dipping time for all the stages of the coating was 5 minutes for each stage without drying. To enhance the stability of the bilayers, heat treatment was used after the deposition, where the fibre was cured at 120°C for 2 hours and at 100°C for 2 further hours. To study the behaviour of the fibre coated with BY in the presence of different pH solutions, an initial experiment was carried out on a range of pH from pH 3 to pH 10. To create the initial probe ten bilayers were coated on the end of the fibre and the deposition was terminated by a PAH layer which has a positive charge. Fig. 6 shows the graphs that were produced from the spectrometer. To study the probe performance, the wavelength at the maximum absorbance for each spectrum, as a function of pH, was plotted. The result is shown in Fig. 7 which shows a good fit (R2=0.99) to the Dose-Response curve. Furthermore, it was observed that this probe is more sensitive in the pH range 6.5 to 9.5. In order to study the detection accuracy of the fibre probe, a subsequent experiment was done using a narrower increment where the pH range was varied between 6.2 and 9.4.
The layers of PAH and BY were built up on the optical fibre using a range of different bilayers (numbered from 3.5 to 9.5 where a whole number represents a series of full double (bi-)layers is used and a fraction e.g. 3.5 indicates 3 full bilayers and one single layer (represented by the 0.5 added)). Thus probes with whole numbers of layers e.g. 4.0 end with BY whereas those that end with PAH are represented by a decimal 0.5 added to the whole number e.g. 4.5. In all the probes the mirror length was 3mm and sensor length was 22mm. The prepared probes were evaluated in pH buffer solutions using the method presented in Section 2.5 and the absorbance spectra for each probe were recorded. Figures 8 to 10 demonstrate the results obtained from the spectrometer for probes with 5.5, 8.0 and 9.5 bilayers. These figures show that the absorbance intensity increases with the addition of layers, as shown in Fig. 4, while the peak wavelength shift decreases when further layers are added. The graph of peak wavelength versus pH, extracted from the spectrometer spectra, was plotted for each probe and these scattered data were fitted by a Dose-Response graph at the end. The performance of the first four probes is compared in Fig. 11 and that of last four probes in Fig. 12. Fig. 13 and Fig. 14 further show the probe performance for even numbers of layers and odd numbers of layers respectively.
[image:7.595.334.514.89.238.2] [image:7.595.90.289.91.238.2]Fig. 8 Absorbance spectra for the optical fibre coated
using 5 double layers of (PAH/BY) and one further PAH
layer in different pH buffer solutions.
Fig. 9 Absorbance spectra for the optical fibre coated
using 8 double layers of (PAH/BY) in different pH
buffer solutions
Fig. 10 Absorbance spectra for the optical fibre coated
using 9 double layers of (PAH/BY) and one further PAH
layer in different pH buffer solutions
3.3 Discussion
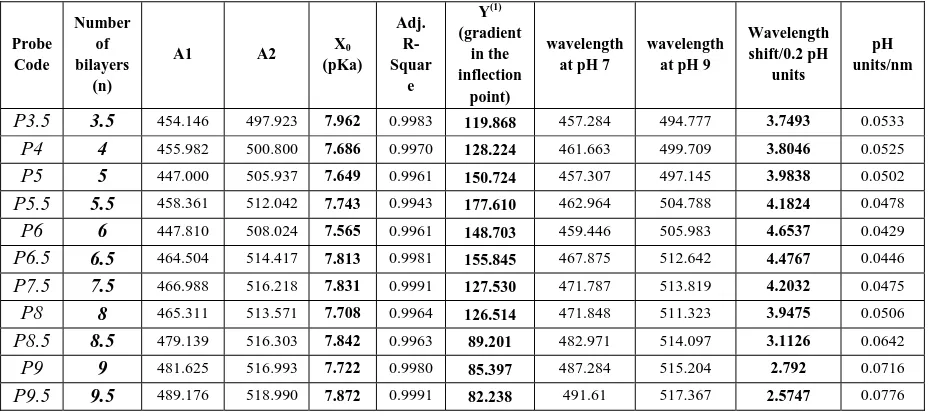
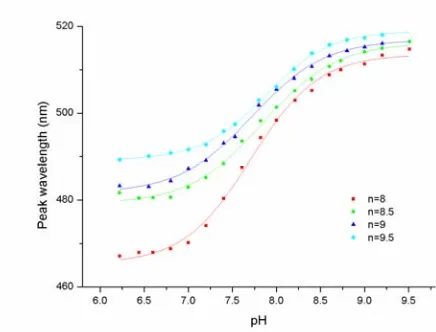
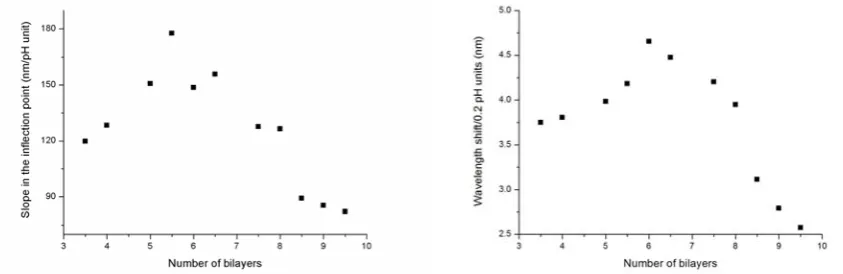
[image:8.595.87.287.113.257.2] [image:8.595.329.526.114.259.2] [image:8.595.90.282.343.490.2]bilayers [20, 34] this series of experiments shows that a different behaviour is evident. The sensitivity of a pH sensor is, of course, a measure of the degree of change in the sensor output with change in the solution pH. In optical sensors this transduction effect (that can then be related to the measurand) typically can be absorbance [12, 35, 36], reflected optical power [20, 34], transmitted power [37] or the wavelength at maximum absorbance [22], for example, and indeed other effects can be used. Therefore, the sensitivity of the device will depend on the optimum choice of this transduction mechanism – where for example, a cross-comparison of Fig. 8, Fig. 9 and Fig. 10 shows a significant change in absorbance from pH 6.22 to 7.20 for the probe coated with eight bilayers and the least change for the probe with 9.5 bilayers. Hence, an eight bilayer-deposited fibre creates a more sensitive device for use over the pH range 6.2 to 7.2 than it does with either a 5.5 or 9.5 bilayer coated fibre. Reviewing its response to wavelength, the sensitivity of these probes is limited over the range considered but for the higher pH range the wavelength shift is clearly measurable, especially for the probe coated with 5.5 to 6.5 bilayers which shows the highest slope and thus device sensitivity. This means that the sensitivity is significant over the pH values from pH 7 to pH 9 for all probes coated with BY. Looking at this more closely, as shown in Table 1, the average peak wavelength shift, seen for a sample 0.2 pH units, varies from 2.58 nm for P9.5 to 4.65 nm for P6 (designating a probe with 6 bilayers where, in general, Pn represents a probe with n bilayers) and the best sensitivity (measured per nm shift) is 0.043 pH units for P6, with the least sensitivity seen being 0.078 pH units for P9.5. The conclusion of this is that increasing the number of bilayers does not necessarily increase the sensitivity and, in addition, the sensitivity can even decrease when the number of bilayers on the fibre is increased. Fig. 15 confirms a continuous reduction of sensitivity for the probes ranging from P6.5 to P9.5 and there is a dramatic decline in sensitivity for the probes from P8 to P9.5, although, the probes with fewer than 5 bilayers are not as sensitive as P5.5, P6 and P6.5. This may arise due to lower stability of the layers as the thin film may not be sufficiently stable in the cases of both very high and very low bilayer thickness values [20, 34].
Probe Code
Number of bilayers
(n)
A1 A2 X0 (pKa)
Adj. R-Squar
e
Y(1)
(gradient in the inflection
point)
wavelength at pH 7
wavelength at pH 9
Wavelength shift/0.2 pH
units
pH units/nm
P3.5 3.5 454.146 497.923 7.962 0.9983 119.868 457.284 494.777 3.7493 0.0533
P4 4 455.982 500.800 7.686 0.9970 128.224 461.663 499.709 3.8046 0.0525
P5 5 447.000 505.937 7.649 0.9961 150.724 457.307 497.145 3.9838 0.0502
P5.5 5.5 458.361 512.042 7.743 0.9943 177.610 462.964 504.788 4.1824 0.0478
P6 6 447.810 508.024 7.565 0.9961 148.703 459.446 505.983 4.6537 0.0429
P6.5 6.5 464.504 514.417 7.813 0.9981 155.845 467.875 512.642 4.4767 0.0446
P7.5 7.5 466.988 516.218 7.831 0.9991 127.530 471.787 513.819 4.2032 0.0475
P8 8 465.311 513.571 7.708 0.9964 126.514 471.848 511.323 3.9475 0.0506
P8.5 8.5 479.139 516.303 7.842 0.9963 89.201 482.971 514.097 3.1126 0.0642
P9 9 481.625 516.993 7.722 0.9980 85.397 487.284 515.204 2.792 0.0716
P9.5 9.5 489.176 518.990 7.872 0.9991 82.238 491.61 517.367 2.5747 0.0776
Table 1 Does‐Response curve properties for the prepared probes
[image:9.595.61.527.470.678.2]peak which tends to move up to a higher wavelength. The onset point for each graph as a (function of the number of bilayers) varies both up and down as a probe with more deposited layers starts from the greater peak wavelength at lower pH region by contrast all the graphs approach convergence in the higher pH regions.
[image:10.595.69.289.148.319.2] [image:10.595.327.531.149.317.2] [image:10.595.77.295.367.533.2]
Fig. 11 The peak wavelength for each spectrum with
respect to pH for probes with 3.5, 4, 5 and 5.5 bilayers.
[image:10.595.328.531.374.530.2]
Fig. 12 The peak wavelength for each spectrum with
respect to pH for probes with 8, 8.5, 9 and 9.5 bilayers.
Fig. 13 The peak wavelength for each spectrum with
respect to pH for probes with 4, 5, 6, 8, and 9 bilayers.
Fig. 14 The peak wavelength for each spectrum with
respect to pH for probes with 5.5, 6.5, 7.5, 8.5 and 9.5
bilayers.
observed that the pKa value for both the odd and even number of layers decreases with an increase in the thickness of the thin film from 5.5 to 6 bilayers, whilst beyond this the pKa value starts to go up with an increasing number of bilayers. This means that the peak sensitivity of the probes slightly shifts for the alkaline region when more layers are deposited onto the fibre. In addition, when the PAH is applied as the outer layer, the pKa of the multilayer film rises to reach a higher level; in other words, when there is one more layer of PAH than BY, the probe shows greater sensitivity in the alkaline region because of higher association constant of the PAH compared to the BY.
[image:11.595.80.502.187.324.2]
Fig. 15 Left: The graph gradient in the inflection point for each probe. Right: The average wavelength shift at each measurement from pH 7 to pH 9
Fig. 16 The amount of pKa related to number of layers and outer layer deposited which is PAH for the upper graph and BY for lower one.
4. Conclusions
[image:11.595.194.387.390.540.2]accuracy of ±0.20) the probe coated by 6 bilayers displayed 4.65nm peak wavelength shift per 0.2 units showing the maximum sensitivity. Additionally, the pKa slowly rises with an increasing number of layers, with the contrary behaviour seen for a smaller number of layers and the outer layer of thin film also clearly influences the pKa value. In conclusion, it has been shown that increasing the number of layers increases the sensitivity towards a higher pH and alkaline area; although higher alkalinity is seen in sensors deposited with PAH as the outer layer due to pKa of PAH itself.
Acknowledgements
This work was supported by scholarship from City University London and Islamic Azad University – South Tehran Branch
References
[1] G. Decher, Fuzzy nanoassemblies: Toward layered polymeric multicomposites, SCIENCE, 277
(1997) 1232‐1237.
[2] A. Rosidian, Y. Liu, R.O. Claus, Ionic self‐assembly of ultrahard ZrO2/polymer nanocomposite thin
films, Adv Mater, 10 (1998) 1087‐1091.
[3] I.R. Matias, F.J. Arregui, R.O. Claus, K.L. Cooper, Molecularly self‐assembled optical fiber sensors,
IEEE, (2002) 198‐202.
[4] O. Mermut, C.J. Barrett, Stable sensor layers self‐assembled onto surfaces using azobenzene‐
containing polyelectrolytes, Analyst, 126 (2001) 1861‐1865.
[5] G.Decher, J.D.Hong, J.Schmitt, Buildup of ultrathin multilayer films by a self‐assembly process: III.
Consecutively alternating adsorption of anionic and cationic polyelectrolytes on charged surfaces,
Thin Solid Films, 210/21 I (1992) 831‐835.
[6] F.Surre, W.B.Lyons, T. Sun, K.T.V.Grattan, S.O’Keeffe, E.Lewis., C.Elosua, M.Hernaez, C.Barian, U‐
bend fibre optic pH sensors using layer‐by‐layer electrostatic self‐assembly technique, Journal of
Physics: Conference Series, Sensors & their Applications XV, 178 (2009) 1‐4.
[7] J. M.Corres, I.R. Matias, I.D. Villar, Francisco J. Arregui, Design of pH sensors in long‐period fiber
gratings using polymeric nanocoatings, IEEE Sensors Journal, 7 (2007) 455‐463
[8] N.A. Kotov, I. Dekany, J.H. Fendler, Layer‐by‐layer self‐assembly of polyelectrolyte‐semicondoctor
nanoparticles composite films, J. Phys. Chem. , 99 (1995) 13065‐13069.
[9] J.M. Corres, I.R. Matias, M. Hernaez, J. Bravo, F.J. Arregui, Optical fiber humidity sensors using
nanostructured coatings of SiO2 nanoparticles, IEEE Sens J, 8 (2008) 281‐285.
[10] Y. Liu, T. Cui, Ion‐sensitive field‐effect transistor based pH sensors using nano self‐assembled
polyelectrolyte/nanoparticle multilayer films, Sensors Actuat B‐Chem 123 (2007) 148‐152.
[11] Y. Egawa, R. Hayashida, J.‐I. Anzai, Multilayered assemblies composed of brilliant Yellow and
poly(allylamine) for an optical pH sensor, Anal Sci 22 (2006) 1117‐1119.
[12] J. Goicoechea, C.R. Zamarre˜no, I.R. Mat´ıas, F.J. Arregui, Op cal fiber pH sensors based on
layer‐by‐layer electrostatic self‐assembled Neutral Red, Sensors Actuat B‐Chem 132 (2008) 305‐311.
[13] P. Jorge, M.A. Martins, T. Trindade, J.L. Santos, F. Farahi, Optical fiber sensing using quantum
dots, Sensors 7(2007) 3489‐3534.
[14] K. J.Loh, J. P.Lynch, N. A.Kotov, Passive wireless strain and pH sensing using carbon nanotube‐
and aerospace systems Proceedings of SPIE, the International Society for Optical Engineering San
Diego, California, USA 19‐22 March 2007, pp. 652919.652911‐652919.
[15] J.u.M. Corres, A. Sanz, F.J. Arregui, I.R. Mat´ıas, J.ı. Roca, Fiber optic glucose sensor based on
bionanofilms, Sensors Actuators B‐Chem, 131 (2008) 633‐639.
[16] I.D. Villar, I.R. Matias, F.J. Arregui, J.M. Corres, Fiber optic glucose biosensor, Opt Eng, 45 (2006)
104401‐104401‐104401‐104406.
[17] G. Decher, J.B. Schlenoff, Multilayer thin films, Wiley‐VCH Verlag GmbH & Co., 2002.
[18] G. Decher, Y. Lvov, J. Schmitt, Proof of multilayer structural organization in self‐assembled
polycation‐polyanion molecular films, Thin Solid Films., 244 (1994) 772‐777.
[19] D. Yoo, S.S. Shiratori, M.F. Rubner, Controlling bilayer composition and surface wettability of
sequentially adsorbed multilayers of weak polyelectrolytes, Macromolecules, 31 ( 1998) 4309‐4318.
[20] I.D. Villar, I.R. Matías, F.J. Arregui, R.O. Claus, ESA‐based in‐fiber nanocavity for hydrogen– peroxide detection, IEEE T Nanotechnol, 4 ( 2005) 187‐193.
[21] K. Itano, J. Choi, M.F. Rubner, Mechanism of the pH‐induced discontinuous swelling/deswelling
transitions of poly(allylamine hydrochloride)‐containing polyelectrolyte multilayer films,
Macromolecules, 38 (2005) 3450‐3461.
[22] C.R. Zamarre, M. Hernáez, I.D. Villar, I.R. Matías, F.J. Arregui, Optical fiber pH sensor based on
lossy‐mode resonances by means of thin polymeric coatings, Sensors Actuat B‐Chem 155 (2011)
290‐297.
[23] Q. Chen, ESA based fiber optical humidity sensor, in: Electrical Engineering, Virginia Polytechnic
Institute and State University, Blacksburg, VA, 2002, pp. 59.
[24] F.J. Arregui, Y. Liu, I.R. Matias, R.O. Claus, Optical fiber humidity sensor using a nano Fabry– Perot cavity formed by the ionic self‐assembly method, Sensors Actuat B‐Chem 59 (1999) 54‐59.
[25] D. Viegas, J. Goicoechea, J.M. Corres, J.L. Santos, L.A. Ferreira, FMAra´ujo, I.R. Matias, A fibre
optic humidity sensor based on a long‐period fibre grating coated with a thin film of SiO2
nanospheres, Measurement Science and Technology 20 (2009) 1‐4.
[26] F.J. Arregui, I.R. Matías, R.O. Claus, Optical fiber gas sensors based on hydrophobic alumina thin
films formed by the electrostatic self‐assembly monolayer process, IEEE Sens J, 3 (2003) 56‐61.
[27] J. Goicoechea, C.R. Zamarre˜no, I.R. Ma as, F.J. Arregui, U liza on of white light interferometry
in pH sensing applications by mean of the fabrication of nanostructured cavities, Sensors Actuat B‐
Chem 138 (2009) 613‐618.
[28] J. Goicoechea, C.R. Zamarreño, I.R. Matías, F.J. Arregui, Study on white light optical fiber
interferometry for pH sensor applications, in: IEEE Sensors Conference, 2007.
[29] F.J. Arregui, l.L. lgnacio, R. Matias, R. Claus, An optical fiber pH sensor based.on the electrostatic
self‐assembly method, IEEE, (2003) 107‐110.
[30] S.S. Shiratori, M.F. Rubner, pH‐Dependent thickness behavior of sequentially adsorbed layers of
eak polyelectrolytes, Macromolecules, 33 (2000) 4213‐4219.
[31] E. Poptoshev, B. Schoeler, F. Caruso, Influence of solvent quality on the growth of
polyelectrolyte multilayers, Langmuir, 20 (2004) 829‐835.
[32] http://www.thorlabs.de/NewGroupPage9.cfm?ObjectGroup_ID=1988, 0.37 NA and 0.39 NA
[33] J. Choi, M.F. Rubner, Influence of the degree of ionization on weak polyelectrolyte multilayer
assembly, Macromolecules, 38 (2005) 116‐124.
[34] I.D. Villar, I.R. Matias, F.J. Arregui, Fiber‐optic chemical nanosensors by electrostatic molecular
self‐assembly, Curr Anal Chem, 4 (2008) 341‐355.
[35] J. Lin, Recent development and applications of optical and fiber‐optic pH sensors, TrAC‐Trend
Anal Chem, 19 (2000) 541‐552.
[36] S. Kodaira, S. Korposh, S.‐W. Lee, W.J. Batty, S.W. James, R. P.Tatam, Fabrication of highly
efficient fibre‐optic gas sensors using SiO2/polymer nanoporous thin films, in: 3rd International
Conference on Sensing Technology, IEEE, Tainan, Taiwan, 2008.
[37] I.R. Matias, F.J. Arregui, J.M. Corres, J. Bravo, Evanescent field fiber‐optic sensors for humidity
monitoring based on nanocoatings, IEEE Sens J, 7 (2007) 89‐95.
[38] Y. YOSHIKAWA, H. MATSUOKA, N. ISE, Ordered structure of polyallylamine hydrochloride in
dilute‐solutions as studies by small‐angle X‐ray‐scattering, Brit Polym J 18 (1986) 242‐246.
[39] H. Ochiai, Y. Anabuki, O. Kojima, K. Tominaga, I. Murakami, Dissociation of poly(allylammonium)
cations in salt solutions, Journal of Polymer Science Part B: Polymer Physics, 28 (1990) 233–240.
[40] M.M. Fang, C.H. Kim, G.B. Saupe, H.N. Kim, C.C. Waraksa, T. Miwa, A. Fujishima, T.E. Mallouk,
Layer‐by‐layer growth and condensation reactions of niobate and titanoniobate thin films, Chemistry
of Materials 11 (1999) 1526‐1532.
[41] A.I. Petrov, A.A. Antipov, G.B. Sukhorukov, Base‐acid equilibria in polyelectrolyte systems: From
weak polvelectrolytes to interpolyelectrolyte complexes and multilayered polyelectrolyte shells,
Macromolecules, 36 (2003) 10079‐10086.
[42] R.W. Sabnis, Handbook of acid‐base indicators, Taylor & Francis Group, 2008.
CurriculaVitae
Nahid Raoufi received her BSc and MSc degrees in chemical engineering from Sharif University of Technology and Azad University, Tehran, Iran, in 1992 and 1997 respectively. She is currently working toward PhD degree on Instrumentation and Measurement in City University London.
She joined to Azad University as a lecturer in chemical engineering in 1997 where she is now funded for her PhD. During years 2003 to 2008 she has collaborated with ERI as a researcher and project manager, and has done some projects in nanostructured materials synthesis and the design and construction of photoreactor for waste-water treatment.
Frederic Surre received the BEng, Msc and PhD in Electronic Engineering from INPT-ENSEEIHT, Toulouse, France in 1998, 1998 and 2003 respectively. In 1998, Frederic was a Research Engineer with ENSAE, France, where he was responsible for opto/microwave measurements. In 2004, he joined Trinity College Dublin, School of Physics, and Dublin City University’s RINCE, Ireland. His research interests included photonic devices for all-optical communications and generation and guiding of Terahertz waves. In 2008, he joined City University London to work on optical and terahertz sensors for structural health monitoring. He is vice-chairman of the IEEE Instrumentation and Measurement Technical Committee 16.
Assistant Professor at Nanyang Technological University in Singapore from year 2000 to 2001 before she re-joined City University in 2001 as a Lecturer. Subsequently she was promoted to a Senior Lecturer in 2003, a Reader in 2006 and a Professor of Sensor Engineering in 2008 at City University, London. Prof Sun has authored or co-authored some 180 scientific and technical papers.
Muttukrishnan Rajarajan is a Reader (Associate Professor) in the Sensors and Instrumentation Centre at City University London. He carried out his PhD at the same centre and completed his PhD in the area of numerical modelling of optical devices and sensors in 1999. His PhD research was funded by the UK Defence Research and Evaluation Agency. Since 2002 he has been actively researching in the areas of biosensors, nanowires and biophotonics. He has published more than 150 international journal and conference papers and is a regular reviewer for IEEE, Elsevier and OSA journals. He is also on the editorial board of several international journals and is on the technical programme committee of several well known conferences.
Kenneth T.V.Grattan graduated in Physics from Queen’s University Belfast with a BSc (First Class Honours) in 1974, followed by a PhD in Laser Physics. Following a period as Research Fellow at the Imperial College of Science and Technology to work on advanced photolytic drivers for novel laser systems, he joined City University in 1983, being appointed Professor of Measurement and Instrumentation and Head of the Department of Electrical, Electronic and Information Engineering in 1991. His research interests have expanded to include the use of fibre optic and optical systems in the measurement of a range of physical and chemical parameters. He obtained a DSc from City University in 1992 for his work in sensor systems and was appointed Dean of the School of Engineering & Mathematical Sciences and Informatics in 2008. In the same year he was elected to the Fellowship of the Royal Academy of Engineering.