Reliability
Based
Design
of
Fluid
Power
Pitch
Systems
for
Wind
Turbines
JesperLiniger1,MohsenSoltani1,HenrikC.Pedersen2,JamesCarroll3,NarimanSepehri4
1DepartmentofEnergyTechnology,AalborgUniversity,Esbjerg,DK
2DepartmentofEnergyTechnology,AalborgUniversity,AalborgEast,DK
3CentreforDoctoralTraininginWindEnergySystems,UniversityofStrathclyde,Glasgow,Scotland,UK
4DepartmentofMechanicalEngineering,UniversityofManitoba,Winnipeg,MB,Canada
ABSTRACT
Thispaperpresentsaqualitativedesigntoolforevaluationoftheriskforfluidp owerp itchs ystems.T hed esignt oolis developedwithspecialattentiontoindustrystandardfailureanalysismethodsandisaimedattheearlyphaseofsystem design.Firstly,theconceptofFaultTreeAnalysis(FTA)isusedforsystematicdescriptionoffaultpropagationlinking
failuremodestosystemeffects.Themethodologyisconductedsolelyonacircuitdiagramandfunctionalbehavior.The
FailureModeandEffectCriticalityAnalysis(FMECA)issubsequentlyemployedtodeterminethefailuremoderiskvia
theRiskPriorityNumber(RPN).TheFMECAisbasedonpastresearchconcerningfailureanalysisofwindturbinedrive
trains.Guidelinesaregiventoselectthe severity,occurrenceanddetectionscorethatmakeuptheRPN.Theusability ofthemethodisshowninacasestudyofafluidp owerp itchs ystema ppliedt ow indt urbines.T her esultss howagood agreementtorecentfieldfailuredataforoffshoreturbineswherethedominatingfailuremodesarevalve,accumulatorand leakage.Theresultsarefurtherusedformakingdesignimprovementstolowertheoverallriskofthepitchsystem.
KEYWORDS
Reliability,fluidpower,pitchsystem,faulttreeanalysis,failuremodeandeffectsanalysis
Correspondence
J.Liniger,DepartmentofEnergyTechnology,AalborgUniversity,Esbjerg,DK
E-mail:jel@et.aau.dk
1.
INTRODUCTION
Windturbinesplayasignificantroleinthepresentutilizationofrenewableenergysourcesandanincreaseininvestment
ofnewinstallationsisexpected[1].TomeetfutureexpectationstheCostofEnergy(CoE)producedbywindturbines
mustdecrease.ThekeyfactorsfordecreasingtheCoEarelowcost,highefficiencyandhighavailability.Sincewind turbinesaredesignedtooperateasautonomousenergyconverters,highavailabilitydependsonefficientmaintenanceand highreliability.Howeverinreallife,turbinessufferfromunpredictedfailurescausingsignificantdowntimewhichreduce availability[2,3,4,5,6].Anumberofstudiesonwindturbinefailureshaverevealedthatpitchsystemsaccountsfora
substantialamount of total failures and downtime.A EuropeanReliaWind studyon app. 350 turbineslarger than 1
megawatt,showsthatthepitchsystemcontributesover20%toboththeoverallturbinefailurerateanddowntime.This
makesitthemostunreliablesubassemblyoftheturbine[4].Thestudyincludeswindturbinesusingeitherelectricalor
fluid powerpitchsystemswithunknowndistribution. However,indicationsare thathalfofthe erectedvariablepitch
turbinesemployfluidpowerpitchsystems[7].Thispaperfocusesonthefluidpowerpitchsystems.Arecentstudyby
Carrolletal.presentssubassemblyfailureratefor∼350offshoremultimegawattturbinesequippedwithfluidpower
pitchsystems[6].Theseresultsconfirmthatpitchsystemsarethelargestcontributorstototalturbinefailurerate.The
associateddowntimeisnotdirectlyevidentbutasimilarindicatorisfoundbycombiningtheaveragerepairtimeand
with fluid power pitch systems show that the pitch system accounts for over 20% of the production stops, only exceeded by the control system [3]. The related total downtime is fourth longest outnumbered only by the gearbox, generator and control system.
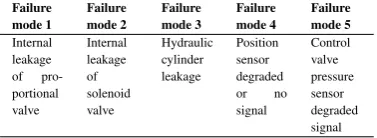
From the above studies it is clearly evident that pitch systems contribute significantly to both the downtime and failures of modern multi megawatt turbines. Hence, lowering the failure probability and downtime of such systems will have the potential to significantly increase the availability of wind turbines. To lower the failure probability of pitch systems an important basis is knowledge of failure modes and component failure rates. Two of the mentioned studies addresses the failure modes and failure rates for current fluid power pitch systems. Table1shows a list of subjectively determined failure
modes identified through the ReliaWind study [4]. Component leakage and sensor faults are seen to be the dominating
faults. Failure rate distribution for components and events are seen in Figure2obtained from the study by Carroll et al. [6]. Here failure rates related to oil, valves and accumulators faults show to make up a large portion of the total failure rate. The failure rates are categorized from field service reports where information can be inadequate. The”Others”category consists of these partially documented failures.
Failure mode 1
Failure mode 2
Failure mode 3
Failure mode 4
Failure mode 5
Internal leakage of pro-portional valve
Internal leakage of solenoid valve
Hydraulic cylinder leakage
Position sensor degraded or no signal
[image:2.595.351.487.236.322.2]Control valve pressure sensor degraded signal
Figure 1.Important failure modes for fluid power pitch systems. Subjectively identified from the ReliaWind project
[4, Fig. 5]. Figure 2.Failure rate distribution for fluid power pitch
systems. Reproduced from the study by Carroll et al. [6].
While the failure modes indicate what failures occur and the failure rate indicates how frequent they occur, these studies do not point out why any of the failures occur. Thus the relation between root cause and system failure is unknown. Without knowledge of the root cause and system failure relation, it is difficult to mitigate failures in future pitch system designs.
A state-of-the-art analysis of fluid power pitch systems revealed that only a few sources deal with failure analysis [8]. Failure analysis in this paper is regarded as the qualitative process of analyzing the root cause and effect relation. Yang et al. [9] presented a method for determining reliability based on a Stochastic Petri Net (SPN) of a 500kW Vestas V39 turbine fluid power pitch system. The method mainly concerned the development of an algorithm for determining minimal cut sets of the SPN and not how the SPN is constructed itself. Thus, the failure analysis was not evident and only few failure modes of the system were considered. Han et al. [10] presented a similar approach, where the SPN was defined from a Fault Tree Analysis (FTA). The construction of the FTA was not evident and similarly only considered a sparse number of failure modes for a few of the components. The previous studies on failure analysis of pitch systems have therefore been focused on quantitatively determining reliability and not the root cause and effect relation that underlies the analysis.
Several patents exists describing pitch system concepts with an objective to increase reliability [8]. Many consider redundant components and also closed circuit type systems. However, the actual impact of the designs to reliability remains undocumented.
Within the general field of fluid power, two categories of qualitative failure analysis are seen to be the subject for
research [8]. One category of methods uses expert knowledge of component failure modes and automatically determines
fault propagation in a system based on a circuit diagram [11,12,13,14]. The other category also uses a circuit diagram, but utilizes component simulation models to determine fault propagation [15,16,17]. While some of the methods seem promising for identifying fault propagation, only the work by Stecki et al. [16] and Gjerstad et al. [17] allows for analysing the system risk. Stecki et al. augments an automated fault propagation method with input for a Failure Mode and Effects Analysis (FMEA). However, no additional information is given for conducting the FMEA itself. Gjerstad et al. presents the system risk as a product of reliability and severity of a failure mode [17]. This method is not directly applicable to fault detection on fluid power pitch systems, as the reliability data for fluid power components are very limited. This is also noted by the Gjerstad et al. [17]. In addition, the used risk evaluation method does not cover the influence of condition monitoring.
[image:2.595.106.295.241.310.2]The main contribution of the paper is to provide a verified design tool that enables systematic analysis of fault propagation and allows for risk evaluation of a fluid power pitch concept in the early design phase of development. This paper also presents design improvements that decrease the overall risk of the fluid power pitch system.
The risk, which is central to the design tool, is determined based on qualitative scores describing severity, occurrence and detectability of failures in the system. The risk score enables identification of weak spots in a concept and directly evaluates the effect of different design changes. To increase usability in industrial development, the design tool incorporates the industry standard failure analysis methods FMEA and Fault Tree Analysis (FTA). Both FMEA and FTA are originally defined in general terms to cover a wide range of mechanical, electrical and software systems [18,19,20]. However, this makes the results sensitive to subjectivity and bias issues generally related to qualitative failure analysis. To overcome the subjectivity and bias issues, the design tool focuses on creating a systematic framework that sets both FMEA and FTA in the context of wind turbine and fluid power systems. As its use is aimed at the early design phase of development, the input depends on a circuit diagram and function description.
This paper is arranged as follows. Section two reviews the methods for failure analysis of wind turbine and fluid power systems. Section three describes a generalized fluid power pitch system which is used as a case study to show usability of the design tool. Section four introduces the design tool and uses it on the pitch system. Section five validates the tool by comparing the results with field failure data. Section six presents design changes to the pitch system based on the design tool results and evaluates how risk is affected. Section seven finalizes the paper with conclusions and discussions of the methods and results.
2. FAILURE ANALYSIS
Failure analysis is used for identifying failure mechanisms of a system and to indicate how faults propagate. Failure analysis and reliability modelling are integrated processes, where failure analysis is the qualitative basis for determining quantitative reliability measures [18]. Two methods dominate the area of qualitative failure analysis; Failure Mode and
Effects Analysis (FMEA) and Fault Tree Analysis (FTA) [18,21]. FMEA is a bottom up approach where failure mode(s)
of each component is determined with its associated effects (on a higher level) and causes (on a lower level). The analysis is normally documented using tables and enables the analyst to provide details on root cause and failure mode correlation.
FMEA is referred to as the general wind turbine failure analysis standard IEC-61400 [22]. The method is therefore
generally known and used in the wind turbine industry. A problem associated with FMEA is how to decide which level of detail is necessary for describing the failure characteristics of a system. If the level of detail is too low, not all relevant failure modes will be discovered and thus leaving out potential important weak spots. On the other hand, if the analysis is too detailed, the analysis will become complex and results in high workload [20]. Additionally, it is recognized that by analysing a system bottom up, it can be difficult to overview which effect a component failure mode has to the system. This overview can be achieved using FTA.
FTA considerers the failure propagation in reverse compared to the FMEA. Here, the system is analyzed top down starting from an undesired top event to individual failure modes. FTA is documented graphically using logic gates and provides a systematic approach to connect systems effect to failure mode. The process of FMEA and FTA is summarized in Figure3. Due to the details provided by the FMEA and the systematic approach of the FTA, many sources advise to use both FTA and FMEA concurrently to detect all relevant failure modes of a system [11,23,18]. A major problem related to both FMEA and FTA is that the methods are subjective and exposed to bias from the group of experts performing the analysis [18,19]. This may compromise the analysis result and will subsequently make it difficult to use as a basis for comparing different design concepts. The design tool to be presented in this paper seeks to lower the bias by introducing specific guidelines for performing the analysis applied to fluid power pitch systems.
Mbari and McCandlish presented a method for constructing an FTA of a fluid power system. The method provides
guidance to subdivide the system analysis based on a circuit diagram and knowledge of normal behavior [11]. With
adjustments, this method is used as a basis for creating the FTA of the pitch system.
FMEA has been used for comparing two turbine configurations [24]. The study is done based on the Risk Priority
Number (RPN), which is a measure calculated for each failure mode of a system. In this case the RPN is a measure of combining both reliability and the risk of not producing electricity. FMEA augmented by the RPN is often named a Failure Mode and Effects Criticality Analysis (FMECA). RPN is normally defined as a product of scores for failure mode severity,
occurrence and detection. Based on the MIL-STD-1629A, Arabian et al. [24] defined scales for severity, occurrence,
detection and set them in terms of wind turbine taxonomy. The scales are given in TableI.
System failure
Subsystem 1 fault
Subsystem 2 fault
Component 2 fault
Component 3 fault
FTA pro
cess
FMEA
process
[image:4.595.207.415.69.182.2]Component 1 fault
Figure 3.Failure analysis approach using either FMEA or FTA.
Table I.Scales for severity, occurrence and detection reproduced from the work by Arabian et al. [24]
Scale Description Criteria
Severity
1 Category IV (minor) Electricity can be generated but urgent repair is required 2 Category III (marginal) Reduction in ability to generate electricity
3 Category II (critical) Loss of ability to generate electricity 4 Category I (catastrophic) Permanent structural damage to the turbine
Occurrence
1 Level E (extremely unlikely) Single failure mode probability of occurrence is less than 0.001
2 Level D (remote) Single failure mode probability of occurrence is more than 0.001 but less than 0.01 3 Level C (occasional) Single failure mode probability of occurrence is more than 0.01 but less than 0.10 5 Level A (frequent) Single failure mode probability greater than 0.10
Detection
1 Almost certain Current monitoring methods almost always will detect the failure 4 High Good likelihood that current monitoring methods will detect the failure 7 Low Low likelihood of current monitoring methods to detect the failure 10 Almost impossible No known monitoring method is available to detect the failure
product of scores, but as given by the following equation:
RPN= 2Severity + Occurrence + Detection
Given the above modified RPN, scores appear as terms in exponents. The benefit is that failure modes with high individual scores are amplified. Also the ratio change in RPN remains the same regardless of the change in individual scores. The modified RPN is used in this paper. To systemize the FMEA procedure Arabian et al. [24] limits both failure modes and root causes. This step is especially helpful when comparing different system designs and is further utilized in the presented design tool.
3. FLUID POWER PITCH SYSTEM
The fluid power pitch system used in this study is shown in Figure4. The diagram is derived from knowledge of different configurations applied to wind turbines. For clarity, the diagram is divided into three. The supply circuit is located in the stationary nacelle of the turbine and connects to the rotating hub through the main shaft and a rotary union. The rotary union is a component that allows supply and return flow to pass between the rotational movement of the hub to the stationary nacelle. The actuator and safety circuit rotates with the hub and are used for each blade; thus, three are used in total. The actuator circuit consists of two parallel pitch cylinders controlled by a proportional valve. The safety circuit consists of gas accumulators that store pressurized fluid used for actuating the pitch cylinders in the event of an emergency shut down.
Emergency shutdown is possible even in the case of a power outage and is achieved by pitching the blades fully to90◦
and using them as an aerodynamic brake [22]. The locking circuit is placed parallel to the actuation and safety circuit and enables locking of the blade movement. The pitch system has four modes of operation; start-up, power regulation, emergency shutdown, normal shutdown. An explanation of each is given below.
Start-upis initiated when the turbine is set to begin power production. Here the two pitch cylinders C1 and C2 and the
[image:4.595.142.482.240.408.2]state in Figure4. All transducers (T1-T7) are checked to be within their specified range. The pump starts and the bypass valve V2 is energized until T2 reads the desired supply pressure. Accumulators A1 and A2 are charged with fluid by energizing valve V5 until T3 reads the desired set pressure. Locking cylinder C3 is then retracted using valve V9 which releases for blade pitch rotation.
Power regulationis active when the turbine is producing power. Pitch cylinders C1 and C2 cause pitch rotation. The
cylinders are controlled by proportional valve V6 connected to the supply unit. The pitch system controller receives a pitch angle setpoint depending on the wind speed. The controller sets a voltage signal to valve V6 and adjusts the desired pitch angle equal to the readings of position transducer T4. Valve V5 is de-energized and valve V8 is energized to prevent flow from the accumulators. Valve V7 is energized to allow flow to and from the piston chamber of the cylinders C1-C2. Note that when the cylinders are extended they are driven in the regenerative configuration where rod side fluid is lead to the piston side. Extending the cylinder means pitching out of the wind.
Emergency shutdownis activated by de-energizing all valves and opening for supply fluid from the accumulators to both
cylinders. As a result the cylinders extend fully in the regenerative configuration. Note that the safety and actuation circuit is separated by valves V5 and V7.
Normal shutdownis activated when wind speed is too low for power production or the turbine is brought to a scheduled
stop. The pitch angle set point is set to fully extend the pitch cylinders and the function is similar to power regulation. When the pitch cylinders are fully extended, the locking cylinder is engaged by using valve V9 connected to the supply circuit. Lastly the supply circuit is de-energized.
The pitch system is considered to fail if the intended function in any of the modes is not achieved. A special case applies for emergency shutdown. This function is safety critical and is normally designed with 2oo3 (Two Out Of Three) redundancy. It is sufficient for two out of the three blades to fully turn out of the wind for performing an emergency stop of the rotor. However, in this event large structural loads are generated due to unbalanced aerodynamic forces. If more than two individual pitch systems fail during the emergency shut down process, the turbine may be exposed to extremely high loads which could result in permanent damage.
4. DEVELOPMENT OF DESIGN TOOL
The design tool takes its basis in combining FTA and FMEA. The flow chart describing the design tool is shown in Figure
5. Firstly, the system is defined using the circuit diagram with all components labeled according to Figure4. At this point, it is important to select to what extent the analysis should be performed. An adequate level of detail is achieved using the assumptions and prerequisites listed below.
Fault tree developed to failure modes of parts.The Fault tree can be developed to any level of detail of a system ranging
from sub-systems, components, parts to physics. The level of detail selected in this analysis reaches the component of the system.
No simultaneous faults.Only single fault events are assumed to occur at any time. The probability of two or more faults
occurring simultaneously is regarded as very low in comparison to single fault events for the fluid power system. This assumption greatly reduces the fault tree structure and workload required to perform the analysis.
Initially fault free system.The system is assumed to perform according to design specification at the time it is used.
No installation faults, misalignment faults or software faults are considered. This assumption reduces the number of failure modes and root causes. These types of faults may be considered later in the design phase as part of initial system installation considerations.
The failure modes and root causes considered are given in TableII. The failure modes are grouped into five categories which are used in the analysis of the results. Both failure modes and root causes are generated based on experience with fluid power systems and the descriptions found in the work by Totten [21], Watton [26] and Hunt [27].
s I M P I C2 C1 T4 C3 V8 V7 V4 V1 T3 M1 P1 F1
A2 A1 V6
V5 T1 T2 P I H1 H2 H3
H4 H5 H6 H7 H8 H9
R1
Connection to remaining pitch circuit Actuation and safety circuit Supply circuit Locking circuit V3 V2 T5 T6 T7 s u V9 V10
TI SI
UU
Label description
· A1-2: Piston accumulators
· Valve V1: Relief valve
· Valve V2: Solenoid bypass valve
· Valve V3-4: Check valves
· Valve V5,7-10: Solenoid valves
· Valve V6: Proportional solenoid valve
· Cylinder C1-C2: Double acting differential pitch cylinders
· Cylinder C3: Double acting differential locking cylinder
· Hose H1-H9: Flexible hoses
· Transducer T1: Filter clog
· Transducer T2: Supply pressure
· Transducer T3: Accumulator pressure
· Transducer T4: Pitch cylinder position
· Transducer T5: Reservoir level
· Transducer T6: Reservoir fluid temperature
· Transducer T7: Locking cylinder engagement
Figure 4.Generalized diagram of a fluid power pitch system. The diagram is based on knowledge from different designs used by the industry. All valves are shown in their de-energized state.
FMECA More junctions or components ? Yes No Yes Yes Define system
Use circuit diagram Label components Define level of detail List failure modes List root causes Identify modes and phases
Draw sub levels Move through flow path to next component or junction Identify failure modes of connected components Develope tree
Define indirect faults No
Identify temperaure faults Identify filtration faults Connect to associated mode Develope tree
More components
? Select detection score Select detection score for all entries in the component table
Select occurrence score Select occurrence for all entries in the component table
Define component FMEA List failure modes (basic events) associated with the selected component Use FTA to link failure modes to worst case system effect (mode) List root causes of each failure mode
Select severity score Define tables Make table for each component present in the FTA
Failure analysis of fluid power pitch control
systems
Analysis done No
FTA
Categorize all system effects (modes) in terms of severity
More phases or modes? Draw top level Draw top tree structure
Choose branch Select mode Select phase
Figure 5.Flow chart describing the proposed design tool used for failure analysis of fluid power pitch systems.
Table II.Failure modes and root causes considered in fluid power pitch systems.
Failure modes
Internal rupture/leakage External rupture/leakage Seizure Electrical faults Other Internal fluid rupture External fluid rupture Valve seized open Electrical input malfunction Blockage
Internal fluid leakage External fluid leakage Valve seized closed Electrical output malfunction Excessive external load Internal gas leakage External gas leakage Excessive friction Electrical intermittent
malfunc-tion
Structural integrity malfunction
Electrical signal wire damage Control unstable/malfunction
Root causes
Fluid borne debris High pressure rupture Excessive generated heat Design error Electrical overload Errosion by air in fluid Pressure cycle fatigue Solenoid malfunction Maintenance error Seal malfunction Corrosion by water in fluid Fluid film breach Spring malfunction Loss of power Pressure caused deformation Errosion/Corrosion by high acid
concentration in fluid
High fluid viscosity Unexpected environmen-tal conditions
Loss of connection Bearing malfunction
does this introduce a more systematical approach for the failure analysis, it also shows to be necessary for correctly setting the severity score used subsequently in the FMECA.
are the”C1 and C2 not extending to setpoint”phase and the”C1 and C2 not retracting to setpoint”phase. Note that these phases are all related to the main objective of the power regulation mode which is to control the pitch cylinder piston to a desired setpoint.
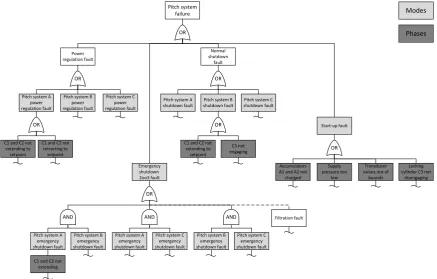
After the system is defined, the top tree structure can be drawn. The top tree level consists of faults in the identified
modes and phases. The structure for the pitch system is seen in Figure6. Note the 2oo3 structure of the emergency
shutdown fault where a single pitch system emergency shutdown does not alone result in the top event occurring. The top level also shows filtration faults connected to the multiple emergency shutdown fault event. This is due to the severity of filter burst which is considered in the latter part of this section.
OR Pitch system failure Emergency shutdown 2oo3 fault Normal shutdown fault Power regulation fault OR
Pitch system A power regulation fault
Pitch system B power regulation fault
Pitch system C power regulation fault
Start-up fault
AND
OR
Pitch system A emergency shutdown fault
Pitch system B emergency shutdown fault
AND
Pitch system A emergency shutdown fault
Pitch system C emergency shutdown fault
AND
Pitch system B emergency shutdown fault
Pitch system C emergency shutdown fault Pitch system A
shutdown fault
Pitch system B shutdown fault
Pitch system C shutdown fault
OR
OR
Accumulators A1 and A2 not charged
Supply pressure too
low
Transducer values out of
bounds C1 and C2 not
extending to setpoint
C1 and C2 not retracting to setpoint
OR
C1 and C2 not extending
OR
C1 and C2 not extending to setpoint C3 not engaging Modes Phases Filtration fault Locking cylinder C3 not
[image:7.595.94.532.166.445.2]disengaging
Figure 6.Fault tree top level for fluid power pitch systems.
Next the sub-levels of the fault tree are drawn by selecting a phase and developing it to the failure modes of components connected to the active flow path. These failure modes are bottom events of the fault tree and represented by circles. The procedure is best illustrated by an example considering the”C1 and C2 not retracting to setpoint”phase. The fault tree is seen in Figure7.
The first components considered are the pitch cylinders C1 and C2 and the position transducer T4. The basic events at this level are the failure modes directly related to the cylinder or transducer that result in the cylinders not retracting to the desired setpoint. The failure modes cover excessive external load, excessive friction, structural integrity malfunction and position sensor T4 malfunction. The next level is expanded by categorizing the pressure needed to perform the function as too highortoo low. This approach is similar to the descriptions given by Hogan et al. [13] in the design of an automated failure analysis. It is clear that too low ring port pressure or too high piston port pressure prevents the retracting motion. These two events therefore facilitate the construction of the next level in the tree structure. The ring port chamber is connected to a junction of valve V6, V10, hose H5 and H7. Failure modes that result in either of the components to cause low ring port pressure construct this level. Further analysis is performed by following the active flow path. For the selected phase, this leads to valve V6 and the analysis continue by following the flow path through this component. This procedure is repeated until there are no more active components to follow, which is usually at the reservoir level.
Pitch system A power regulation fault
C1 and C2 not extending to
setpoint
C1 and C2 not retracting to setpoint OR
Modes
Phases
Piston port pressure too
high
Ring port pressure too
low OR
Cylinder C1,C2 Excessive external load Cylinder
C1,C2 excessive
friction Position transducer T4
malfunction
Basic event/ Failure mode
[image:8.595.199.421.67.214.2]Cylinder C1,C2 structural integrity malfunction
Figure 7.Fault tree example describing faults in power regulation mode.
The FMECA requires tables for all components considered in the FTA. The next step is to categorize all modes in terms of severity. Because many of the part failure modes in the FTA will cause multiple faults, the severity score will aid in selecting the worst case scenario. The categorization is shown in TableIII. Note that pitch systems for each blade is named A to C.
Table III.Mode categorization in terms of severity for fluid power pitch systems.
Scale Description Mode
1 Category IV (minor) None
2 Category III (marginal) Pitch system A-C power regulation fault
3 Category II (critical) Pitch system A-C emergency shut down fault, Normal shut down fault, Start-up fault 4 Category I (catastrophic) Emergency shut down 2oo3 fault
The component FMECA is defined by selecting a component and listing all related failure modes (bottom events) from the fault tree. By using the fault tree structure, all failure modes are linked to their corresponding system effects (mode faults). If multiple mode faults are available, the one having the highest severity score must be selected. Lastly, all root causes applicable to the failure modes will be listed.
The final two steps of the failure analysis is to select appropriate occurrence and detection scores. While TableIgenerally outlines the criteria for selecting the scores, it is up to engineering judgement and experience to apply them in the FMECA. However, some considerations for selecting the scores for fluid power pitch systems is given below.
Occurrenceis selected relatively. By assuming proper component design, failure modes caused by high pressure rupture
can be considered to be extremely unlikely (score 1). Due to the erratic loads caused by turbulence, a remote probability (score 2) of pressure cycle fatigue is regarded for components connected directly to the pitch cylinders. Pressure cycle fatigue for other components is considered to be extremely unlikely (score 1). Two state solenoid valves (poppet valves) are more robust to leakage and seizure failure modes than proportional spool valves [21]. Therefore leakage and seizure failure modes for the two state solenoid valves are regarded as extremely unlikely (score 1) and occasional (score 3) for spool valves. Fluid borne debris are one of the highest contributors to faults in fluid power systems and is regarded to have a remote probability (score 2) [28].
Detectionis related to the condition monitoring methods applied to the system. Faults which can be identified by a fault
detection scheme or measured directly by a sensor is regarded as almost certain (score 1). An example is detection of a seized spool in the proportional valve V6 by using the spool position sensor. The rating high (score 4) is given for faults that are measured indirectly. This could, for instance, apply to internal pump leakage causing lowered supply pressure. Low likelihood of detection (score 7) is given to external leakage faults as they are only indirectly measured by the reservoir fluid level transducer. All other failure modes are are considered almost impossible to detect (score 10). It should be noted that faults in fluid power systems that are visible by inspection are also regarded as impossible to detect, because of the long time service intervals for wind turbines.
An overview of the total system RPN distribution is seen in Figure8. An emergency shutdown fault in a single pitch
system is seen to be the largest contributor to system RPN.
[image:8.595.143.479.331.385.2]Figure 8.Pitch system RPN distribution.
However, this is not the case for the FMECA, which has to be adapted. Specifically, this could be done by changing criteria for selecting the severity score presented in Table1. Also the lists of root causes and failure modes in TableIImay need to be updated to suit the specific system.
5. VERIFICATION OF DESIGN TOOL
To emphasize the usefulness of the design tool developed in this paper, the results are compared to the quantitative failure data reported by Carroll et al. [6]. Here the field failure data show component and event failure rate of fluid power pitch systems of wind turbines located offshore. They are presented as percentage of the total pitch system failure rate. The reason for only selecting the occurrence score for comparison is that it bears the closest resemblance to the failure rate evident from the field data. The comparison is shown in Figure9.
The component fault categories cover valves, accumulators, rotary union, cylinders, transducers and pipe/hose issues. To compare occurrence in the component categories, all occurrence scores for the components are simply summarized. The event failure categories are oil issues, blade not releasing and hydraulic block leakage. The oil issues cover unscheduled oil replenishment, oil change and sludge issues. Neither of these failure modes are directly evident from the lists of root causes and failure modes. However, all rupture/leakage failure modes will cause the fluid level to decrease and thus result in needed replenishment. Sludge in the fluid normally causes the filter to clog up and eventually be blocked. Filter failure modes caused by blockage is therefore included under oil issues. Hydraulic block leakage is also not directly evident from the analysis. The hydraulic block is a machined block interfacing to all valves in the actuator, safety and locking circuits. Leakage is assumed to occur in the interfacing parts of the block and valves and occurrence for these faults are summarized and constitute hydraulic block leakage. Lastly, the occurrence for blade not releasing is assumed to be equivalent to occurrence for the cylinder C3 not retracting. Note thatOthers-category has been omitted, and it is assumed that the inadequately documented failures are distributed uniformly to all categories. The field failure rate distribution shown in Figure9is therefore generally higher than depicted in Figure2.
Recalling that the results obtained in this analysis are based on a generalized pitch configuration and qualitative reasoning, the overall tendency is well captured. Categories for valve and oil issues are highest for both field data and results from this analysis. Specifically the field data and analysis result show very good agreement for the categories concerning the rotary union, transducers, hydraulic block leakage and blade not releasing. Here the difference between field data and occurrence is around 1% or lower.
Valves Accumulators Pump Rotary union Cylinder Transducers Oil issues Pipe/hose issues Hydraulic blockleakage Blade notƌĞůĞĂƐŝŶŐ
% of total occurence 33͘ϱ% ϴ͘ϱ% ϭ͘ϳ% Ϭ͘ϴ% ϲ͘ϲ% Ϯ͘ϴ% 2ϴ͘ϳ% 10͘ϱ% ϰ͘ϴ% ϭ͘ϵ%
% of total field failure rate ϭϵ͘ϳ% 15͘ϰ% ϴ͘ϳ% 1͘ϱ% Ϯ͘ϯ% Ϯ͘ϭ% 3ϲ͘ϲ% 6͘Ϭ% ϲ͘0% ϭ͘ϴ%
[image:10.595.98.531.68.189.2]0% 5% 10% 15% 20% 25% 30% 35% 40%
Figure 9.Comparison between calculated occurrence and field failure rate.
the most occurred failure modes. A large portion of the failure modes for valves receive a score of one, which should have been relatively much lower. The sum of occurrence presented here, is therefore greatly affected by the coarse occurrence scale used.
The relatively large discrepancy for the cylinder category may be caused by the system having two pitch cylinders and the field system only one. This also applies for the accumulators and pump.
In general, Figure9shows that a good agreement exists between the field data and the results from the analysis based on the design tool developed here.
6. DESIGN IMPROVEMENTS
The above design tool represents the backbone for investigating design improvements of a pitch system in the early design phase. The design improvements given in this section are based on the component RPN. High component RPN indicates the weak spots of the system in terms of risk. Since the RPN depends on severity, occurrence and detection, a lowered risk implies both an increase in safety and reliability. A pareto chart of the top ten component RPNs is given in Figure
10. Here the components active in the event of emergency shut down (valves V7, V8, V10 and accumulators A1,2), are
seen to contribute with high RPN, thus indicating weak spots of the system. High RPN follows the intuition that safety critical components imply high risk. The system RPN is therefore preferably lowered by making design changes that mitigate failure modes for these high risk components. For clarity the failure modes for each component are divided into the categories previously described in TableII.
Valve V8 Valve V7 Accumulator A1
Accumulator
A2 Valve V10 Valve V6 Valve V9 Hose H4 Hose H6 Filter F1
Other components
Other 0.0% 0.0% 0.0% 0.0% 0.0% 0.0% 0.0% 0.0% 0.0% 0.0% 0.2%
Electrical fault 1.3% 1.3% 0.0% 0.0% 1.3% 0.0% 1.3% 0.0% 0.0% 1.3% 9.4%
Internal rupture/leakage 5.3% 2.0% 4.7% 4.7% 0.0% 5.3% 0.7% 0.0% 0.0% 0.4% 0.1%
External rupture/leakage 2.4% 2.0% 1.7% 1.7% 2.0% 1.0% 0.7% 3.1% 3.1% 0.6% 12.7%
Seizure 6.0% 6.7% 3.3% 3.3% 6.0% 0.0% 3.3% 0.0% 0.0% 0.4% 1.1%
0%
5%
10%
15%
20% 25%
%
o
f
to
ta
l R
P
N
Figure 10.Component RPN Pareto chart with failure mode distribution.
Four risk-based design changes are proposed in the following. The impact to total system RPN is seen in Figure11.
Parallel redundant valve V8.Valve V8 is the most critical component of the system which is mainly caused by the
[image:10.595.106.521.479.600.2]because of the no simultaneous faults assumption. Inserting an additional valve, however, increases the number of leakage paths.
Series redundant valve V7.High RPN is associated with seizure of the valve V7. From the FMECA, it is seen to be
caused by the seized open failure mode. Inserting a series redundant valve V7 eliminates this failure mode. Again, the additional valve increases the number of leakage paths in the system.
Spring return locking cylinder C3 and parallel redundant valve V9.Valve V9 implies high risk to the system because
of the seized closed failure mode. If the valve is seized closed the locking cylinder C3 cannot be operated. Inserting a parallel redundant valve V9 eliminates this failure mode. Additionally, if the locking cylinder C3 engaging motion is driven by a spring, valve V9 can be replaced by a normally open valve. Valve V9 solenoid and electrical wire malfunction is therefore eliminated. Hose H8 rupture failure mode can also be disregarded.
Accumulators A1,2 piston position transducer. Accumulator risk is associated with seizure, internal and external
[image:11.595.215.416.293.425.2]rupture and leakage failure modes. All have similar system effect and cause the inability to supply sufficient fluid to the pitch cylinders in the event of an emergency shut down. The accumulator piston position is an indicator of either leakage or piston seizure. By introducing accumulator piston position transducers these failure modes can therefore be detected and the associated score can be decreased to the lowest level. The drawback of introducing a piston position transducer is an increased number of electrical failure modes.
Figure 11.Change in total RPN due to design changes. Lower values are preferred.
From Figure11the accumulator piston position transducer is seen to be the most effective design change to lower the system RPN. Also the series redundant V7 and the altered locking circuit decrease the system risk. Parallel redundant V8 valves actually increase the system risk. This is caused by introducing new leakage paths that outweighs the advantages of eliminating the seized closed failure modes. This conclusion underlines why the proposed analysis tool is needed when evaluating design changes. Being able to comparatively evaluate design changes or even different system configurations at the design phase aids in selecting a proper architecture. Also note that the procedure enables for evaluation of system specific condition monitoring methods. Introducing condition monitoring will lower the detection score of the monitored failure mode or component.
Applying all design changes, but the redundant valve V8, to the pitch system results in a significant RPN reduction of 27,4%. The design tool therefore shows the ability to lower system risk. However, the impact of the design changes to failure rate and downtime must first be verified from field tests.
7. CONCLUSIONS
review for this work, no past papers were encountered on creating the qualitative basis. This emphasized the need for the design tool. Thus the objective of the paper was to provide industry development with a systematic framework of known methods to aid in selecting proper system architecture in the early design phase.
The presented design tool was based on the industry standard failure analysis methods Fault Tree Analysis (FTA) and Failure Modes and Effects Criticality Analysis (FMECA). FTA was chosen as it enables systematic discovery of relevant failure modes and shows fault propagation through the system. A procedure for performing FTA for fluid power systems was presented, which improves its usefulness when comparing different concepts. FMECA was used to construct a detailed overview of correlation between root cause, failure mode and system effect where the latter two were given by the FTA. The FMECA build upon prior research concerning wind turbine concepts and allowed risk evaluation via the Risk Priority Number (RPN). Guidelines for determining RPN was adapted to pitch systems and standards were established in selecting the severity, occurrence and detection scores.
A case study of a fluid power pitch system applied to wind turbines was conducted to show usability of the design tool developed here. The results showed that valves and accumulators where high contributors to system failure. To verify the design tool a comparison was made between occurrence score and field failure rate. The comparison showed a good agreement between the qualitative results from the design tool and the field data. Design changes were proposed based on the component RPN to lower the overall systems risk. For example, inserting a piston position transducer in the accumulator to monitor leakage showed to significantly lower the system RPN. This design change did not alter the physical layout, but dealt with monitoring of a critical part of the system. The presented design tool therefore allows for risk evaluation of not only physical design changes but also of condition monitoring methods.
ACKNOWLEDGEMENTS
The authors would like to thank project collaborator Hydratech Industries Wind Power for providing knowledge on fluid power systems for wind turbines and the Danish Energy Agency (EUDP) for co-funding the project (project no. 64013-0510).
REFERENCES
1. Global Wind Energy Council & Greenpeace International. Global wind energy outlook 2014 2014;5.
2. Ribrant J, Bertling L. Survey of failures in wind power systems with focus on swedish wind power plants during
1997-2005.IEEE Transactions on Energy ConversionMarch 2007;22(1):1–8.
3. NordzeeWind. Operations report 2009.Technical Report OWEZ R 000 20101112, NordzeeWind November 2010.
4. Wilkinson M, Hendriks B. Reliability-focused research on optimizing wind energy system design, operation and maintenance: Tools, proof of concepts, guidelines & methodologies for a new generation.Collaborative Project:
Large Scale Integrated Project, FP7-ENERGY-2007-1-RTD2010; .
5. Hines VA, Ogilvie AB, Bond CR. Continuous reliability enhancement for wind (crew) database: Wind plant reliability
benchmark.Technical Report, Sandia National Laboratories Sep 2013.
6. Carroll J, McDonald A, McMillan D. Failure rate, repair time and unscheduled O&M cost analysis of offshore wind
turbines.Wind Energy2015; :1107–1119doi:10.1002/we.1887.
7. Dvorak P. Hydraulic pitch control for wind-turbine blades May 16 2009. URL
http://www.windpowerengineering.com/design/mechanical/gearboxes/ hydraulic-pitch-control-for-wind-turbine-blades/, retrieved 07-01-2016.
8. Liniger J, Pedersen HC, Soltani M. Reliable fluid power pitch systems: A review of state of the art for design and
reliability evaluation of fluid power systems.Proceedings of the ASME/BATH 2015 Symposium on Fluid Power &
Motion ControlOctober 2015; :1–10.
9. Yang X, Li J, Liu W, Guo P. Petri net model and reliability evaluation for wind turbine hydraulic variable pitch systems.Energies2011;4(6):978–997.
10. Han X, Zhang H, Chen Y, Zhang X, Wang C. Fault diagnosis of hydraulic variable pitch for wind turbine based on qualitative and quantitative analysis.World Congress on Intelligent Control and Automation (WCICA), 2012 10th 2012; :3181–3185.
11. Mbari P, McCandlish D. Reliability and fault tree analysis in hydraulic systems.Proceedings of the 7th International
Fluid Power SymposiumSep 1986; :303–311.
12. Atkinson R, Montakhab M, Pillay K, Woollons D, Hogan P, Burrows C, Edge K. Automated fault analysis for
hydraulic systems: Part 1: Fundamentals.Proceedings of the Institution of Mechanical Engineers, Part I: Journal
13. Hogan PA, Burrows CR, Edge KA, Atkinson RM, Montakhab MR, Woollons DJ. Automated fault analysis for
hydraulic systems: Part 2: Applications.Proceedings of the Institution of Mechanical Engineers, Part I: Journal
of Systems and Control Engineering1992;206(4):215–224.
14. Hogan PA, Burrows CR, Edge KA, Atkinson RM, Montakhab MR, Woollons DJ. Automated fault tree analysis
for hydraulic systems.Journal of Dynamic Systems, Measurement, and Control Jun 1996;118(2):278–282, doi:
10.1115/1.2802315.
15. Bull DR, Stecki JS, Edge KA, Burrows CR. Failure modes and effects analysis of a valve-controlled hydrostatic drive. Challenges and Solutions: Tenth Bath International Fluid Power Workshop1997; :131–144.
16. Stecki JS, Conrad F, Oh B. Software tool for automated failure modes and effects analysis (FMEA) of hydraulic
systems.Proceedings of the JFPS International Symposium on Fluid Power2002; (5-3):889–894.
17. Gjerstad V, Lauvas T, Grahl Madsen M. FMECA of an offshore man-riding winch. Proceedings of Power
Transmission and Motion Control2003; :183–197.
18. Bertsche B. Reliability in automotive and mechanical engineering: determination of component and system
reliability. Springer Science & Business Media, 2008.
19. Stapelberg RF. Handbook of reliability, availability, maintainability and safety in engineering design. Springer
Science & Business Media: London, 2009.
20. Mauri G. Integrating safety analysis techniques, supporting identification of common cause failures. PhD Thesis, Department of Computer Science, The University of York Sep 2000.
21. Totten GE.Handbook of hydraulic fluid technology. CRC Press: Boca Raton, Florida, 2011.
22. IEC. Wind turbines part 1: Design requirements (IEC 61400-1:2005) 2006.
23. Isermann R.Fault-diagnosis systems: an introduction from fault detection to fault tolerance. Springer Science & Business Media: Berlin, 2006.
24. Arabian-Hoseynabadi H, Oraee H, Tavner P. Failure Modes and Effects Analysis (FMEA) for wind turbines. International Journal of Electrical Power & Energy Systems2010;32(7):817–824, doi:10.1016/j.ijepes.2010.01.019. 25. Tavner PJ, Higgins A, Arabian H, Long H, Feng Y. Using an FMEA method to compare prospective wind turbine
design reliabilities 2010;4:2501–2537.
26. Watton J.Modelling, monitoring and diagnostic techniques for fluid power systems. Springer Science & Business Media: London, 2007.
27. Hunt TM.Handbook of wear debris analysis and particle detection in liquids. Springer Science & Business Media: Netherlands, 1993.