Copyright ©1977 AmericanSociety for Microbiology Printed in U.S.A.
Localization of
Single-Chain
Interruptions
in
Bacteriophage
T5 DNA
I. Electron
Microscopic
Studies'
PATRICIA P. SCHEIBLE,2 ELLEN A. RHOADES, AND MARC RHOADES* DepartmentofBiology, The Johns Hopkins University, Baltimore, Maryland 21218
Received forpublication29 December 1976
BacteriophageT5 DNA wasexamined in anelectronmicroscope after limited
digestion withexonuclease IIIfrom Escherichiacoli. The effect of the exonucle-asetreatment was to converteachnaturally occurringsingle-chaininterruption
in T5 DNA into a shortsegment of single-stranded DNA. The locations of these segments were determined for T5st(+) DNA, T5st(0) DNA, and fragments of
T5st(0) DNAgenerated byEcoRI restrictionendonuclease. The results indicate
thatsingle-chain interruptions occur in avariable, butnonrandom, mannerin
T5 DNA. T5st(+) DNAhas four principal interruptions locatedat sites approxi-mately 7.9, 18.5, 32.6, and 64.8% from one end ofthe molecule. Interruptions
occur atthesesites in 80 to 90%of the population. Alargenumber of additional sites, located primarilyatthe ends of the DNA, containinterruptionsatlower
frequencies.The average number ofinterruptions per genome, asdetermined by
thismethod,is 8. Asimilar distributionofbreaksoccurs inT5st(0)DNA,except
that the 32.6% site is missing. At least one ofthe principal interruptions is
reproducibly located within an interval of 0.2% oftheentire DNA.
Mature particles of the virulent coliphage T5 contain a single molecule of double-stranded DNA, which has a nonpermuted, terminally repetitious nucleotide sequence (21, 29). T5
DNA is distinguished from most other viral
DNAmoleculesby the presence of a small
num-ber of single-chain interruptions (1). These
sites can be repaired by DNA
jigase
and arelocated within one strand ofthe duplex (11).
Although the interruptions in T5 DNA had
been thoughtto occur atdefinedpositions,
sev-eral studies have suggested that theexact
dis-tribution of these sites is variable.
Denatura-tionof T5 DNA resultsintheformationof over
40discrete classes ofsingle chains, which can
be resolved by agarose gel electrophoresis (9).
The relative abundances of these fragments
varyoverawiderange.Evidencethat
interrup-tions occur atvariable positionsatoneendof T5
DNAhasbeenobtainedby electronmicroscopic
studies of circular molecules produced by
an-nealing exonuclease-treated DNA (21).
Thepurpose of theexperimentsreportedhere was to determine the locations of the
single-chain interruptions in T5 DNA. This was
ac-complished by examining T5 DNA in an
elec-IContribution912fromtheDepartmentofBiology,The JohnsHopkinsUniversity,Baltimore,Md.
2Presentaddress: DepartmentofSurgery, Duke
Univer-sity MedicalSchool, Durham, NC27710.
tronmicroscope after limited digestion with
ex-onuclease III ofEscherichia coli, an enzyme
thathydrolyzes both internal and external 3'-terminiinduplex DNA (17). Under the appro-priateconditions, the short single-stranded
seg-mentsproduced by the exonuclease can be
visu-alized and thepositions of the interruptions can be determined. By performing analogous
exper-iments onfragmentsgenerated by EcoRI endo-nuclease, we constructed an unambiguous physicalmapof T5 DNA.
MATERIALS AND METHODS
Purificationofexonuclease III. E. coli 1100, an
endonuclease I-deficient strain (6), was grown at
37°Cin4liters of M9 medium(2)supplemented(per
liter) with 2 g ofCasamino Acids, 1 g oftryptone
(Difco Laboratories, Detroit, Mich.), and 1 mg of thiamine hydrochloride. At a concentration of5 x
105/ml, the cellswere chilled to 0°C, harvested by centrifugation at 10,000 x g for 15 min, and
sus-pended in 30 ml of EB (0.02 M Tris-hydrochloride
[pH7.8], 10-3M2-mercaptoethanol, 10-4MEDTA). All subsequent steps were carried outat 0 to 4°C. The resuspended cellsweredisrupted bysonic treat-ment, andtheresultingextract wascentrifugedfor 90 min at 25,000 rpm in a Spinco 40 rotor. After
dialysisagainst 0.01 Mphosphate buffer(potassium
phosphate [pH 6.8] containing 10-3 M
2-mercapto-ethanol and 10-4 M EDTA), the supernatant was
applied toacolumnofDEAE-cellulose (100-mlbed
volume). Elution was carried out with a 350-ml lin-725
on November 10, 2019 by guest
http://jvi.asm.org/
726
SCHEIMLE,
RHOADES, AND RHOADESeargradient formedwith 0.01and0.30 Mphosphate
buffer. Exonuclease III activitywasrecovered ina
single peak elutingbetween 0.075 and 0.140 M phos-phate buffer. The active fractions were dialyzed
against 0.01 M phosphate buffer and appliedto a
phosphocellulose column (35 ml). Elution was
car-riedoutwitha150-ml lineargradientformed with
0.01and 0.30 Mphosphatebuffer. Activitywas
re-coveredinasharp peakat0.15 Mphosphatebuffer.
This materialwasdialyzedagainstEDTA-free 0.01
Mphosphate buffer and appliedtoacolumn of
hy-droxyapatite (3.0 ml). Elution was carried out as
described above. ExonucleaseIII wasrecoveredin
fractions ranging from 0.075to 0.115 M phosphate buffer. Contaminating endonuclease activity was
foundtoeluteslightlyahead ofthe exonuclease. The fractions showing the highest ratio of exonuclease/ endonucleaseactivitywerepooled and concentrated
to 1mlbypressuredialysisagainstEBcontaining 2
X 10-3 M MgC12. This material was applied to a
Sephadex G-75 column (1.5 by 30 cm, superfine)
equilibrated with thesamebuffer. ExonucleaseIII
eluted from this column justafterthe void volume
andjust ahead of the endonuclease activity. The leading fractions containing exonuclease III were
free from detectable endonucleaseactivityandwere
used for theexperimentsreported here (seeFig. 1).
Assays for exonuclease III were routinely
per-formedby measuringthe formation of acid-soluble
radioactivity from 32P-labeledT5DNAasdescribed
below. At variousstagesthe identity of the
exonu-cleaseIIIactivitywasverifiedby the3'-phosphatase assayof Richardson andKornberg (22). Endonucle-aseactivitywasmeasuredbyalkalinesucrose
gra-dient sedimentation.
Digestion of T5DNA with exonuclease III. Reac-tion mixturescontained0.067 MTris-hydrochloride (pH8.0), 10-3MMgCl2, and10 ggof32P-labeled T5 DNA perml. The concentration of exonuclease III wasadjusted sothatapproximately4%of the DNA
washydrolyzed within 15minat37°C. The
forma-tion of acid-soluble radioactivity was measured by
thin-layer chromatography on
polyethyleneimine-cellulose(12).
Sequential treatmentof T5 DNA with
exonucle-ase III and EcoRI endonuclease. Exonuclease III
incubations were carried out as described above.
The reactions were terminatedby heatingto 650C
for 5min. The solutionswerethen made0.01 M in
MgCl2 and 0.10 M inTris-hydrochloride (pH 7.6), and sufficientEcoRIendonucleasewasaddedto
pro-duceacompletedigestwithin 30 minat37°C.These
incubations wereterminated by adding1/5 volume of 0.1 MEDTA. EcoRI endonucleasewaspurifiedas
describedby Rhoades (19).
Electron microscopy. DNAwasprepared for
mi-croscopybyaproteinfilm procedurepatterned after
that ofWestmoreland et al. (30). The hyperphase
contained0.15 MNaCl, 0.5,ugof DNAperml,0.01%
(wt/vol)cytochromec,and 30to50%(vol/vol) form-amide. (Lower formamide concentrations produce clearer junctions between single- and double-stranded DNA. Higher concentrations render the
single-stranded regions more visible.) The
hypo-phasewasglass-distilledordeionizedwater.
Speci-mens wererotary-shadowed with platinum and ex-aminedinaPhilips EM200or a JEM100Belectron microscope. Tracings of projected molecules were measured with a Numonicsgraphics calculator. The double-stranded, circular DNAs ofbacteriophages
4)X174 and PM2 and the single-stranded DNA of
4)174 were employed as internal molecular weight
standards.
Other methods. The proceduresemployedfor the preparation ofradioactively labeled T5 phageand DNA, for sucrose density gradient centrifugation, and for the preparation of
qSX174
DNA have been described previously (21). PM2DNA was agift of S. Rogers.RESULTS
Molecular weight of T5 DNA. A wide range of values has been reported for the molecular
weight of T5 DNA. In the case of T5st(+) (wild type),the valuesvary from 66 x 106 to68 x 106 asmeasuredby hydrodynamic methods (5, 27) to83 x 106 asmeasured by 32p autoradiography (15). The heat-stable deletion mutant T5st(0)
has generallybeen reported to contain 6 to8%
less DNA thanthewildtype (9).
To obtain areliablevalue for thisstudy, the
length of T5st(+) DNA was determined, in an
electron microscope, relative to the circular,
double-stranded forms of 4X174 DNA (3.4 x
106;28) and PM2 DNA (6.4 x 10⁶; 18). Allthree
DNAs were present on the same grid, and at
least 5 ofeach ofthe reference genomeswere
included in every field. A sample of28
mole-culesyieldedavalueforT5st(+)DNA of76.1 ±
1.6 x 10⁶relative to 4X174 DNA and of 77.0 ±
1.5 x 10⁶relative to PM2 DNA. The averageof
thesetwodeterminations,76.5 x 106,is ingood
agreement withthevalueof 77.4 x 10⁶recently
determinedby electron microscopyforT5st(+)
DNA (14).This value also providesaclose fitto
the empiricalrelationship between
sedimenta-tion coefficient and molecular weight
con-structed by Freifelder (7) for other coliphage
DNAmolecules.
The molecular weight ofT5st(0) DNA was determined relative to T5st(+) DNA by com-paring thefragments derivedby cleavageof the two genomes with restriction endonucleases.
Aspreviously described(19), EcoRI
endonucle-asedigestsofT5st(0)DNAlackthreefragments
foundinwild-type digestsand containone new
fragment. The molecular weight of this
frag-ment was shown by electron microscopy to be 5.6 x 10⁶less than the sum of thethreemissing
wild-type fragments. A similar analysis
per-formed withHpaI endonucleasegave a value of 5.4 x 10⁶ for the deleted segment. The average ofthese values represents a 7.2% deletion if T5st(+) DNA has a molecular weight of 76.5 x
on November 10, 2019 by guest
http://jvi.asm.org/
INTERRUPTIONS IN T5 727
106. (The details of these experiments will ap-pearinasubsequent publication.)
Digestion of T5 DNA with exonuclease III. E. coli exonuclease III catalyzes the stepwise
removal of 5'-mononucleotides from internal
andexternal 3'-termini in duplex DNA(17,23).
Since the mode of attack of exonuclease III is
random or nonprocessive (16), uniform
degra-dation of all susceptible sites can be achieved
with subsaturating levels ofenzyme. Limited
digestion of T5 DNA with exonuclease III should, therefore, generate short segments of single-stranded DNA atthe site ofeach
inter-ruption, aswell asatall duplextermini.
The exonuclease III used in this study was
extensively purifiedtoremoveothernucleases.
The principal contaminant during the later stages of purification was an endonuclease,
which introduced a limited number of
ran-domly placed single-chain breaks in T5 DNA. This endonuclease canbe separated from
exo-nuclease III by gel filtration as described in
Materials and Methods. Figure 1 shows the alkaline sucrose gradient profiles ofT5 DNA
afterdigestion to 3.3% with purified and
par-tially purified exonuclease III preparations.
The sedimentation profile of the DNA treated with purified exonuclease III is virtually
un-changed from that of untreated DNA.
Treat-ment with the partially purified preparation, however, resulted inasignificant loss of
mate-rial from the fastest-sedimenting peak, which
representsthe intact strand of T5DNA. Thefully purified preparation of exonuclease IIIhas also been analyzed in experiments
em-ploying both alkaline sucrose gradient
sedi-mentation andagarosegelelectrophoresis (20).
Under the conditions described here, T5 DNA
canbedegradedto atleast 7.8% without
detect-able endonucleolytic cleavage.
Electron microscopy of exonuclease III-treated T5 DNA. Exonuclease III-treated T5 DNAwas prepared for electron microscopy by
theformamide modification of thebasic protein film procedure. As originally described by Westmorelandetal. (30), this technique main-tainssingle-stranded DNA inanextended
con-figuration. Regions of single- and double-stranded DNA canbe distinguished, since the
former has athinnerand kinkier appearance.
Digestion of T5 DNAto3 to 4%with
exonucle-aseIII creates single-stranded segmentsof 600 to 1,000 nucleotides, which can be recognized
without difficulty in an electron microscope.
Except where noted, this level ofhydrolysiswas
employed in all of the experiments reported below.
Analysis of EcoRI fragments. The positions 200
100
a-W)I
100
200~
100
5 10 15 20
Fraction No. 25
200
100
200 0
a-100
100
FIG. 1. Effectof partial digestion with
exonucle-aseIIIon the alkaline sedimentationprofile of T5
DNA. 32P-labeled T5st(O) DNA was denatured and
centrifuged in alkaline sucrose gradients (a) after
incubation in a control reaction mixture, (b) after
digestion to3.3%withpurifiedexonucleaseIII,and
(c) after digestion to3.0% with apartially purified
preparationofexonuclease III.Thelatterpreparation
wasobtainedfromthegel filtrationstepdescribed in the text. Untreated 3H-labeled Xb2 DNA was
in-cluded in eachgradientas asedimentationreference.
Centrifugationwascarriedoutfor90minat40,000
rpminaSpincoSW50.1 rotor.Thedirectionof sedi-mentation is from right to left. Symbols: *, 32P_
labeledT5st(0) DNA; 0, 3H-labeled xb2DNA.
of the single-stranded segments generated by exonuclease IIIweredetermined for intact
mol-ecules ofT5st(+)and T5st(0) DNAaswellasfor
EcoRIfragments of T5st(0) DNA. Itwas
antici-pated that the measurements on intact
mole-cules wouldprovideasatisfactorydescription of
the locations of the single-chain interruptions. Theinitial results, however, revealedadegree
of intermolecular heterogeneity that made it impossible toalign individual molecules in an
absolute manner. This problem was circum-vented by combining the results obtained from intactgenomeswith those obtained from EcoRI
fragments.
EcoRIdigests of T5st(+) DNA containseven
fragments, of which thetwolargestoccuratthe
ends of the DNA (19).Fragment 1,representing
37%of thegenome,defines therightend of the
molecule, and fragment 2,a25%fragment, oc-cursinthesame half of the moleculeasthest
deletions (26). In the present experiments,
(c)
(b)
(a)
',JI
on November 10, 2019 by guest
http://jvi.asm.org/
[image:3.503.255.445.63.301.2]EcoRIdigests wereprepared aftertreatmentof
the DNA with exonuclease III. As a result,
fragments 1 and 2 each had one duplex end,
generatedby EcoRIendonuclease,andone
sin-gle-stranded end, generated by exonuclease III. The orientation ofbothfragmentscould thus be unambiguously determined.
The positions of the single-stranded
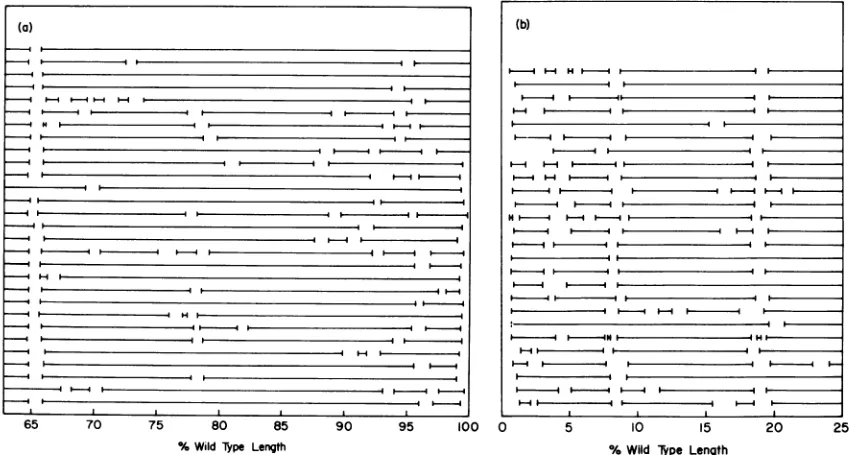
seg-mentsin29molecules of EcoRI fragment1and 26 molecules of EcoRI fragment 2 of T5st(0) DNAareshown in Fig. 2. The fragments have
been alignedasthey wouldoccurin wild-type DNA, with the position of each single-strand/
double-strand junction plotted to the nearest
0.1% of the total length ofT5st(+) DNA. It is
apparent that single-stranded segments occur
frequently at two sites within EcoRI fragment 2, located at approximately 8 and 18%, andat
onesiteinfragment 1, locatedat65%.
Interrup-tionsoccurlessfrequentlyatanumber of other
sites,especiallyateach end oftheDNA,within
the terminalrepetition.
The nine molecules ofEcoRI fragment1 plot-ted at the top of Fig. 2a possess two duplex termini. These molecules, however, allappear to containthe single-stranded segment at65% and were aligned on that basis. The probable cause ofthis will bediscussedbelow.
(a)
Fi-I
I~~~~~~-@~~~ ~ @| |
I
I_
To determine which end of each
single-stranded segment represents theoriginal
inter-ruption, itisnecessarytoknow thepolarity of
thestrands inT5 DNA. Several studies (3, 10,
11) have indicated that most, ifnotall, of the interruptions inT5 DNAarelocated withinone
strand of the duplex. The polarity of this
strand, which is designated the "interrupted"
strand, can be determined by analyzing the
effect ofX exonuclease digestionon the single-chain fragments contained in T5 DNA. As orig-inally reported by Rhoades and Rhoades (21), and confirmed in the accompanyingpaper(20),
the 3'-terminus of theinterruptedstrandoccurs
at the left end of the molecule. Consequently,
theleft side of each single-strandedsegmentin Fig. 2 marks the site ofan interruption.
Histogramsdescribing the density of single-chain interruptions along EcoRI fragments 1 and 2 are shown in Fig. 3. Each vertical bar
represents the frequency of interruptions within a segment equal to 0.2% of T5st(+)
DNA. Of particular interest is the siteat65%, which, because of its proximitytothe EcoRIcut at62.8%,canbemapped with considerable
pre-cision. Over 90% of the interruptions that de-fine this siteoccurbetween 64.7 and64.9%, an
interval ofapproximately 200 base pairs. A
his-65 70 75 80 85 90 95 100 0 5
% WildType Length
10 15
% Wild Type Length
20 25
FIG. 2. Positions of the single-strandedsegmentsinexonucleaseIII-treated EcoRI fragments1 (a)and2
(b) of T5st(O) DNA. T5st(O) DNA was treated with exonuclease III and EcoRI endonuclease, and the
unfractionateddigestwasexaminedinanelectron microscope. EcoRIfragments1and 2wereidentifiedonthe basis of size. The lengths of the molecules in the twopopulations were normalized to 37.2 and 25.0%, respectively, of the wild-type length.Thegapswithineachmoleculerepresenttheduplexlengthequivalentto eachsingle-stranded region.
(b)
-4 -4 H I-I
H4 l- I
:: -I I
H--H- |- - H- 4- H
-I H- I H
---I I-- I---w
- H- HI H - H
--I- i-|4 1_ I H I
-Hi
-HI -. - 4 H
-I I- H- - - I H
on November 10, 2019 by guest
http://jvi.asm.org/
[image:4.503.49.474.376.604.2]I
0.40 k
0.301-0.20F
0.10
_i
_l
_II_i
_ _ __111
T _0 5 10 15 20
II11
1 lIIIII1
INI
liii
I
I11
1
1
11
65 70 75 80 85 90 95 100
% Wild Type Length
FIG. 3. Histograms of the frequency of single-chain interruptionsinEcoRIfragments1(a)and 2(b) ofT5
DNA. Theresults shown in Fig.2 were used to determine thefrequency of interruptionswithin segments equalto0.2%of intact T5st(+) DNA.
togram of the positions of the right end of the single-strandedsegments at65% (notshown) is significantly less sharp. This result would be expected, duetoheterogeneity inthe extentof exonuclease IIIdigestion, if the polarity of the interrupted strandwereas described above.
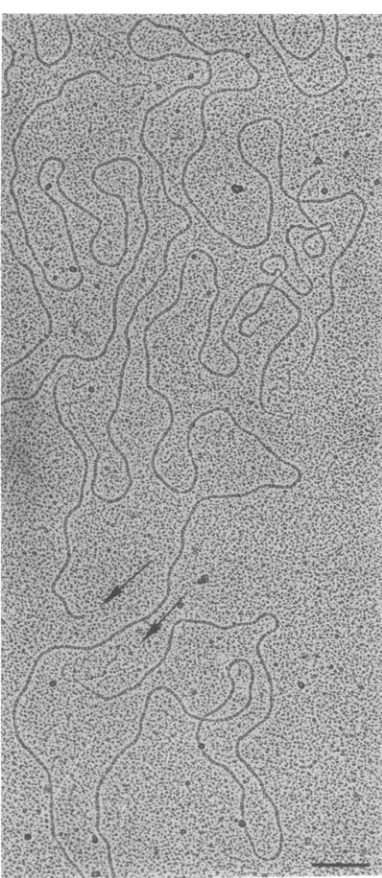
Electron micrographs of exonuclease III-treated EcoRI fragments are shown in Fig. 4
and 5. Figure 4 shows acomplete molecule of
fragment 1, in whichsingle-strandedsegments
defining interruptions at65 and 78% are
visi-ble. Figure 5 shows portions ofseveral mole-cules in which single- and double-stranded ends, as well as internal single-stranded
re-gions, arevisible.
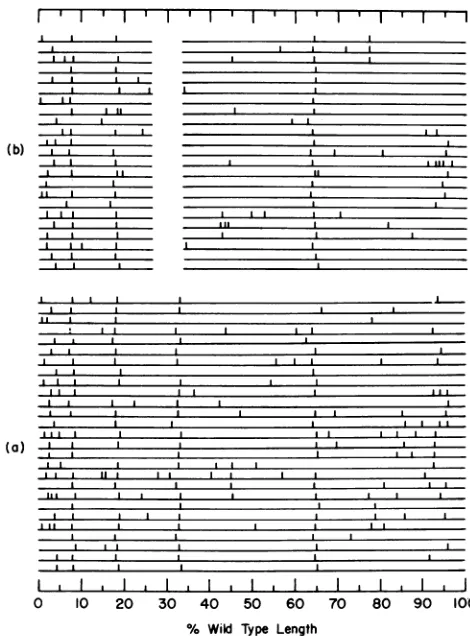
Analysis of intact DNA. The positions ofthe
single-chain interruptions in 27 molecules of
T5st(+) DNA and23 molecules of T5st(0)DNA
are shown in Fig. 6. These molecules were
alignedon the basisofthe principal
interrup-tions at8, 18, and 65%observed in EcoRI
frag-ments 1 and 2. For every molecule ofT5st(0) DNAandmostof thoseofT5st(+) DNA, oneof
the twopossibleorientationsgaveabetter fit at
thesepositions. Thepattern ofinterruptions is
sufficiently complex, however,thatsomeof the
molecules maybeincorrectly aligned. Thegap inthe molecules of T5st(0) DNArepresents the
7.2%deletion thatoccursfrom 26.3 to33.5% in
wild-type DNA. Theseendpointsreflectminor
revisions ofthosereported previously (26).
Histograms of the positions of the single-chain interruptions in T5st(+) and T5st(0)DNA
are shown in Fig. 7. Each vertical line repre-sents0.5%ofT5st(+) DNA. Anelectron
micro-graph ofamolecule ofT5st(+)DNAcontaining
five single-strandedsegmentsis shown in Fig. 8.
The results in Fig. 3 and 7 reveal that T5st(+) DNA contains four sites, locatedat7.9, 18.5, 32.6,and 64.8%, where interruptionsoccur
inmost,butnotall,molecules. Except for these sites, the internalregionsof T5 DNAare
rela-tively free from interruptions. The only other internal sites where interruptions appear to
occur inmore than 10% of the population are
locatedat45 and 78%. In contrast, the endsof
the DNA contain a relatively high density of
interruptions. Theseterminal sites arelargely
clustered between 0 and 5% and 91 and 96%.
Since theterminalrepetitionin T5 DNAequals 8.3% ofwild-type DNA (20, 21), these clusters
occur at analogous positions within the
re-peated segments. A more detailed analysis of
the left end is presentedin the next section.
The distribution ofinterruptions in T5st(0) DNA issimilartothatinT5st(+) DNA, except that the interruption at 32.6% lies within the
deleted region. The histograms in Fig. 7 sug-gest that, compared with wild-type DNA, T5st(0) DNA contains fewer interruptions at
the right end of the molecule. However, a
0.60F
0.501
CA
0
CL
0.40F
0.30
k
0.20F
0.10h
IV 11 11 III, 11 ; . I .I I 11 y 1111 11 m
P.-(a) (b)
11111111
IIII
IIII Holl I I
L
1L
Al
on November 10, 2019 by guest
http://jvi.asm.org/
730 SCHEIBLE, RHOADES, AND RHOADES
FIG. 4. Complete EcoRI fragment 1 of T5st(0) DNA after 4%digestion with exonuclease III. The
arrowsindicate thetwoendsof thefragment,oneof
which is single-stranded. Two internal single-strandedsegments, specifying interruptions at64.8 and 77.8%, are also visible. The bar represents a
duplex length of 500 basepairs.
larger number of molecules of bothtypeswould
havetobeanalyzedtosubstantiate this
conclu-sion.
The total number of interruptionsper
mole-cule is highly variable. Thesample ofT5st(+)
DNA studied here contained an average of eight interruptions. Some molecules hadasfew
as four, whereas others had as many as 13 interruptions. ForT5st(0) DNA,the range was
from3to10, withanaverageof6interruptions
permolecule.
Analysis of the interval from 0 to 8%. As
describedintheprecedingsections,theinterval
between 0 and 8% atthe left end of T5 DNA
contains a high density ofsingle-chain inter-ruptions. Thisregion wasinvestigatedinmore
detail byexaminingT5st(0)DNA in anelectron
microscope after degradationto0.9%with
exo-nucleaseIII.The single-strandedsegments
cre-atedby this level of hydrolysis (250 nucleotides)
werebarely large enoughtobe identified. Only
unambiguous single-stranded segments were
included in this analysis. An electron micro-graph in which several short single-stranded segmentsarevisibleisshowninFig.9.A histo-gramof the frequency of single-chain interrup-tions attheleftend of T5DNA isshowninFig.
10. This histogram was derived from measure-ments on 14 intact molecules and 8 molecules
whose right ends were either too tangled to
measure orobscuredby agridbar.
The resultsinFig. 10indicate that, in
addi-tion totheprominent site at 8%, interruptions
are clusteredat 0.8, 2.4, and 3.4 to 4.0% from
theleftendof the molecule. Evidence for sites
at2.4and3.4 to 4.0% canbeseeninFig.3.The
siteat0.8%,however,isnotvisible in themore
highly degraded molecules. Interruptions
ap-pearto occur at these sites in 20to30% of the
population. The level of interruptions at the
right ends of the molecules sampled in this
experimentwas toolowtopermitanalysis.
DISCUSSION
The results presented above demonstrate thatT5 DNA possessesalarge number ofsites
where single-chain interruptions can
poten-tiallyoccur. The frequencieswithwhich
inter-ruptions actually occurredatthese sites inthe
mature form of T5 DNAwere highly variable.
Although amajority ofthe interruptions were
found at four sites and atthe two ends of the
genome, asignificant fraction of the
interrup-tions occurred at siteswhere the frequency of breakswasless than0.10. Individual molecules of T5 DNA thus differ with respecttoboth the number and location ofsingle-chain interrup-tions. Within thepopulations of intactT5st(+)
andT5st(0)DNAsampledinthisstudy,no two
moleculespossessed identical structures.
The validity of these conclusions depends
largelyontheproperties of E. coli exonuclease
III. For an accurate picture ofT5 DNA to be
on November 10, 2019 by guest
http://jvi.asm.org/
[image:6.503.61.252.76.515.2]FIG. 5. Portions of several EcoRI fragments ofT5st(0) DNA after 4% digestion with exonuclease III. The arrowsindicate single-stranded regions, both internal and external. The molecule centered in (A) is the left half of EcoRI fragment 1. The bars represent duplex lengths of 500 base pairs.
obtained, it is essential that exonuclease III
initiate hydrolysis at all of the natural inter-ruptionswithoutintroducingadditional
single-chain breaks. The latterrequirement appears
to have been satisfied, since itwaspossible to
prepare exonuclease IIIthatwas free from de-tectable endonuclease activity. It would be
dif-ficulttodetectalow level of activity, however,
anditisconceivable thatasmall fractionof the
observedinterruptions werespurious.
Thefinding thatinterruptionsdo notalways
occur ateach ofthe principal sites might
indi-cate the occasional resistance of internal
3'-termini to hydrolysis. In fact, Hayward and Smith (9)suggested, on the basis of their elec-trophoreticanalysis of denaturedT5DNA, that
theprincipalinterruptionsarealwayspresent.
Theelectrophoretic studiespresentedinthe
ac-companying paper (20), however, demonstrate
that eventhe most frequent interruptions are
occasionally missing. Moreover, studies onthe
properties of exonuclease III have indicated
thatvirtuallyallligase-repairablesingle-chain
interruptions in apopulationaresusceptibleto
hydrolysis(17). It isthusunlikelythata
signif-icantfraction of the natural interruptionswas
overlookedbythe exonuclease.
A moreserious problem concerns the extent
of exonuclease III hydrolysis. In most of the
experiments reported here, single-stranded
segmentsof 600 to 1,000 nucleotides were cre-ated at the site of each interruption. These
conditions clearly preclude detection of
inter-ruptionslocatedwithin 1,000base pairsfroman
endorfrompairsofinterruptionsseparated by
less than this distance. This situation can be
remedied,inprinciple,bydecreasing theextent
of exonuclease III hydrolysis. One experiment inwhichsingle-strandedsegmentsof 200 to 300
nucleotidesweregenerated did allow the
iden-tification of an additional site,located0.8%(900
nucleotides)from the left end of the genome. In
practice, however, very short single-stranded
segments aredifficult toidentifywith certainty (Fig. 9). Furthermore, as demonstrated in the accompanying paper (20), interruptions occur
inT5 DNA at alocation that would be virtually impossible to detect regardless of theextentof
digestion. This site occurs 0.4% (450 basepairs)
from therightend of the molecule. Since the
3'-terminusofthe intactstrandalso occurs at the right end of the molecule, the 0.4% segment will bedegradedfromboth directionsby
exonu-clease III. Removal of225 nucleotides per
on November 10, 2019 by guest
http://jvi.asm.org/
[image:7.503.36.464.78.343.2]732 SCHEIBLE, RHOADES, AND RHOADES
* UL
II
I Il
*
,, _
.I
(a)|
I Il I Il I II I I I I
0 10 20 30 40 50 60 70
I I
80 90 100 % Wild Type Length
FIG. 6. Positions of single-chain interruptions in intact molecules of T5st(+) and T5st(0) DNA. After normalizationto 100%of the wild-type length, the molecules were aligned to give the best fit at the 7.9, 18.5, and 64.8% sites, where interruptionsoccurat ahigh frequency. The vertical bars represent the left end ofeach internal single-stranded segment. The deleted segment inT5st(0) DNA has been left blank so that the maps of thetwogenomescanbecompared directly. (a) T5st(+) DNA; (b)T5st(0)DNA.
II II
(b)
K'
111111 111111 ii2
(a)
un
40 50 60 70 80 90 100
%Wild Type Length
0 10 20 30
FIG. 7. Histogramsof the frequency ofsingle-chain interruptions in T5st(+) and T5st(0) DNA. The results shown inFig.6wereusedtodetermine the frequency ofinterruptionswithinsegmentsequalto0.5%of intact
T5st(+)DNA.(a) T5st(+)DNA; (b) T5st(0) DNA. 0.50
0.40 0.30 8 0.20
.2 CL 0.10
C, 0.50 0.40
!LW
0.30 0.20 0.10
I I I I I
. . .
on November 10, 2019 by guest
http://jvi.asm.org/
[image:8.503.138.373.73.391.2] [image:8.503.116.412.449.638.2]INTERRUPTIONS IN T5 DNA 733
1s,.',, ,. ,f,.
..o ,,./ ,*
.S,,_..
.,S,*...
\:, .': ;-.: 'K
, -,
:^
-::
w.
*: l <
4..
r
/ /
1) 1 .'1. 1...
VOL. 23, 1977
C.)
~t
'U,)
c
o
cc
O.
ko
06 s
'U-.. k%.
@ 3
'U
@3
SS
o
^cs
otq S.E x
^U
W
: ~
'CO
E
U . 0,*
'.I
on November 10, 2019 by guest
http://jvi.asm.org/
734 SCHEIBLE, RHOADES, AND RHOADES
S'.L-.
FIG. 9. T-st(.)DNAafterdigestionto0.9%with exonucleaseTI Thearrows indicateshort, internal
segments ofsingle-stranded DNA. The bar
repre-sentsaduplex length of500 basepairs.
terminus will therefore result in loss of the right (5') end ofthe interrupted strand. This
effectisundoubtedlyresponsibleforthe appar-ent absence ofsingle-stranded materialat the
right ends ofsomemolecules (Fig. 2).
Many of the structural features of T5 DNA described in this study were first proposed by
Hayward and Smith (9, 10), who fractionated denaturedT5DNAbyagarosegel electrophore-sis into 4major andover40minorsingle-chain
fragments. The majorfragments werethought
todefineprimary interruptions thatoccurinall
molecules, whereas the minor fragments were
proposedtoresult fromsecondaryinterruptions
that occur less frequently within the major
fragments. The sizes of both the major and minorfragmentswerediscrete, and the
electro-phoreticpatternswereunaffected byvariations
in host bacteria and in the method of DNA
preparation.Theonlyqualitativedifference
be-tween the model proposed by Hayward and
Smith(10)and the conclusions obtainedinthe
present study is that, as mentioned earlier,
eventhe mostfrequent interruptions are
occa-sionally missing. However, because of the
as-sumptionthat theentiremoleculecanbe
recon-stituted from major fragments, these authors
failed
torecognize the segmentbetween 0and
7.9%. The density of interruptions in this re-gion is too high to yield a majorfragment,
although a minor fragment that defines this
segment canbe identified(20).
Several other studies on T5 DNA have
mapped single-chaininterruptions at sitesthat
agreerelatively well with the positions
deter-mined for the principal interruptions in the
presentstudy. Inanelectron microscopic exam-ination of partially denatured T5st(+) DNA,
Bujard (3) identified interruptions at sites
lo-cated 7.9, 19.0, and 60% from one end ofthe
molecule. Bujard and Hendrickson (4)
deter-mined the positions of the major
single-stranded fragments of T5st(+) DNA,
isolated
by sucrose gradient sedimentation, by
anneal-ing eachfragment tothe intactstrand.
Analy-sisofthesestructures in anelectronmicroscope
gavepositionsfor single-chain interruptionsat
3.9, 7.8, 17.8, 30.6, and 65.0% of the wild-type
length. Hayward (8)demonstrated that
hydro-dynamic shearing breaks duplex T5 DNA at
single-chain
interruptions. The positions ofthese shear-sensitive points were determined
by electrophoretic procedures to occur at 7.4,
16.9, 29.5, and 64.0% of the wild-type length.
Morerecently, Saigo (24, 25)haslocated
inter-ruptions at 8.2, 17.9, 32.6, and64.0% by exam-iningsheared tail-orghost-DNA complexes in
an electron microscope and at 18.0, 33.1, and
0.30
0.20
0.10
0 2 4 6 8 10
%WildTypeLength
FIG. 10. Histogram of the frequency of single-chain interruptionsattheleft endofT5DNA. The positionsof thesingle-strandedsegmentswere deter-minedin 22moleculesofT5st(0)DNAthathad been digestedto0.9%with exonucleaseIII.Themolecules
were aligned as described in the legend toFig. 6,
exceptthat thelengthswere notnormalized.Instead, the positionof each interruptionwasplottedrelative
totheleft end of the DNA. Each vertical line
repre-sents0.2%of theintactT5st(+) DNA.
on November 10, 2019 by guest
http://jvi.asm.org/
[image:10.503.65.232.63.402.2] [image:10.503.288.433.462.563.2]64.5% by denaturing mapping. Except for the
60% site reported by Bujard (3), all of these
values agreereasonably wellwith the positions
determinedinthe presentstudy.
The T5st(0) deletion mutant has been shown by heteroduplex mapping to lack the segment between 26.3 to 33.5% on the wild-type genome (26; M. Rhoades, unpublished data).
Conse-quently, the prominent interruption locatedat
32.6% shouldbe missing inT5st(0) DNA. The absence of this site had been previously
in-ferredfromthe electrophoretic studies of
Hay-ward and Smith (9, 10) and Hayward (8). A
different structure for T5st(0) DNA has been
proposed by Labedanetal. (13). These authors
analyzed the products formed by shearing
T5st(0) DNA after attaching one end of the
molecule, by phage infection, to the bacterial
membrane. Under the assumption that a uniqueendof the DNA was injected, amodel
for T5st(0) DNA was proposed, with
interrup-tions located 8, 19, 35, and 60% from the end
that initiated transfer. This result indicated
that the leftendof the genome, as describedin
the present study, initiated infection. T5st(0)
DNA, however, does not contain a detectable
levelof interruptionsinthe vicinityof35%from the leftend. The origin of this discrepancyhas
notbeendetermined.
Itwasinitiallyanticipatedthatknowledgeof
the positions of the single-chain interruptions in T5 DNA would provide some insight into their originand function. The major
contribu-tionof thisstudy,however, hasbeento
demon-stratethecomplex and heterogeneousnatureof
T5 DNA. A more detailed description of the locations of single-chain interruptions in T5
DNA ispresented in the accompanying paper
(20).
ACKNOWLEDGMENTS
Wearegrateful to Rolf Benzinger and the Biology De-partment, University of Virginia,Charlottesville, for pro-viding supportand facilities for portions of this study. P.S. was supported by Public Health Service training grant 5 T01-GM-5717 from the National Institute of General Medi-cal Sciences. This research was supported by grant GB-20460from theNational Science Foundation.
LITERATURE CITED
1. Abelson,J., and C. A. Thomas, Jr. 1966.Theanatomy of theT5bacteriophageDNAmolecule.J.Mol.Biol. 18:262-291.
2. Adams, M. H. 1959.Bacteriophages. Interscience, New York.
3. Bujard, H. 1969. Location of single-strand interrup-tions inthe DNA ofbacteriophage T5+. Proc. Natl. Acad. Sci.U.S.A. 62:1167-1174.
4. Bujard, H., and H. E. Hendrickson. 1973. Structure and function of thegenome ofcoliphage T5. 1. The physical structure of the chromosomeofT5+.Eur. J. Biochem. 33:517-528.
5. Dubin, S. B., G. B. Benedek, F. C. Bancroft, and D. Freifelder. 1970. Molecular weights of coliphages and coliphage DNA. II. Measurement of diffusion coeffi-cients usingoptical mixing spectroscopy, and mea-surement ofsedimentation coefficients. J.Mol. Biol. 54:547-556.
6. Durwald,H., and H.Hoffmann-Berling. 1968. Endonu-clease I-deficientEscherichza coli mutants. J. Mol. Biol.34:331-346.
7. Freifelder, D. 1970. Molecular weights ofcoliphages and coliphage DNA. IV. Molecular weights of DNA frombacteriophage T4, T5, and T7 and the general problem of determination of M. J. Mol. Biol. 54:567-577.
8. Hayward, G. S. 1974. Unique double-stranded frag-ments ofbacteriophage T5 DNA resulting from pref-erentialshear-induced breakage at nicks. Proc. Natl. Acad. Sci. U.S.A.71:2108-2112.
9. Hayward, G. S., and M. G. Smith. 1972. The chromo-someofbacteriophage T5. I. Analysis of the single-stranded DNA fragments by agarosegel electropho-resis. J. Mol. Biol. 63:383-395.
10. Hayward, G. S., and M. G. Smith. 1972. The chromo-some ofbacteriophage T5. II. Arrangement of the single-stranded DNA fragments in the T5+ and
T~st(0)chromosomes. J. Mol. Biol. 63:397-407. 11. Jacquemin-Sablon, A., and C. C. Richardson. 1970.
Analysis of the interruptions in bacteriophage T5 DNA. J. Mol. Biol.47:477-493.
12. Kelly, T. J., Jr., and H. 0.Smith. 1970. Arestriction enzyme from Hemophilus influenza. II. Base se-quence of the recognition site.J. Mol. Biol. 51:393-409.
13. Labedan, B.,M.Crochet, J.Legault-DeMare, and B. J. Stevens.1973.Locationof the first step transfer frag-mentandsingle-strand interruptions inT5st(0) bac-teriophage DNA. J. Mol. Biol. 75:213-234.
14. Lang,D., A. R. Shaw,and D. J. McCorquodale. 1976. Molecular weights of DNA from bacteriophages T5, T5st(0),BF23, and BF23st(4).J.Virol.17:296-297. 15. Leighton, S. B., andI.Rubenstein. 1969. Calibration of
molecular weight scales for DNA. J. Mol. Biol. 46:313-328.
16. Little, J. 1967. An exonuclease induced by bacterio-phageX.II.Nature oftheenzymatic reaction.J.Biol. Chem. 242:679-686.
17. Masamune, Y., R. A. Fleischman, and C. C. Richard-son. 1971. Enzymatic removal andreplacement of nucleotides at singlestrandbreaksin deoxyribonu-cleicacid.J. Biol. Chem. 246:2680-2691.
18. Pettersson, U., C.Mulder, H. Delius, andP. A.Sharp. 1973. Cleavage ofadenovirus type 2 DNA into six uniquefragmentsby endonucleaseR- RI. Proc.Natl. Acad. Sci. U.S.A. 70:200-204.
19. Rhoades, M. 1975. Cleavage ofT5 DNAby the Esche-richia coli RI restriction endonuclease. Virology 64:170-179.
20. Rhoades, M. 1977. Localization ofsingle-chain inter-ruptions in bacteriophage T5 DNA. II. Electropho-reticstudies. 23:737-750.
21. Rhoades, M., and E. A.Rhoades. 1972.Terminal repe-titionintheDNAofbacteriophageT5.J.Mol. Biol. 69:187-200.
22. Richardson, C. C., andA.Kornberg.1964. A deoxyribo-nucleic acid phosphatase-exonuclease from Esche-richiacoli.I.Purification of theenzymeand charac-terizationofthephosphatase activity.J. Biol.Chem. 239:242-250.
23. Richardson, C. C., I. R. Lehman, and A. Kornberg. 1964.Adeoxyribonucleic acid phosphatase-exonucle-asefromEscherichia coli. II.Characterization of the exonucleaseactivity.J.Biol. Chem.239:251-258. 24. Saigo,K. 1975.Tail-DNAconnectionandchromosome
on November 10, 2019 by guest
http://jvi.asm.org/
structure inbacteriophageT5.Virology 68:154-165. 25. Saigo, K. 1975. Denaturation mapping andchromosome
structure inbacteriophageT5.Virology 68:166-172. 26. Scheible, P. A., and M.Rhoades. 1975. Heteroduplex
mapping ofheat-resistant deletion mutants of bacte-riophage T5. J. Virol. 15:1276-1280.
27. Schmid, C. W., and J. E. Hearst. 1969. Molecular weights of homogeneouscoliphage DNA's from den-sity-gradient sedimentation equilibrium. J. Mol. Biol. 44:143-160.
J. VIROL. 28. Sinsheimer,R. L.1959.Asingle-stranded
deoxyribonu-cleicacid from bacteriophage4bX174. J. Mol. Biol. 1:43-53.
29. Thomas, C. A., Jr., and I. Rubenstein. 1964. The ar-rangements of nucleotide sequence in T2 and T5 bac-teriophageDNAmolecules.Biophys.J.4:93-106. 30. Westmoreland,B. C.,W.Szybalski,and H. Ris.1969.
Mappingofdeletions andsubstitutions in heterodu-plexDNAmolecules ofbacteriophage lambda by elec-tronmicroscopy.Science 163:1343-1348.