PRODUCTIVITY IMPROVEMENT THROUGH TPM
ADOPTION ON PRINTING MACHINE
This report is submitted in accordance with requirement of the University Teknikal Malaysia Melaka (UTeM) for Bachelor Degree of Manufacturing Engineering
by
MOHD ALIFF MUKMIN BIN ABDUL RAHIM B051510032
941226-07-5369
UNIVERSITI TEKNIKAL MALAYSIA MELAKA
BORANG PENGESAHAN STATUS LAPORAN PROJEK SARJANA MUDA
Tajuk:
Sesi Pengajian: 2017/2018 Semester 2
Saya MOHD ALIFF MUKMIN BIN ABDUL RAHIM (941226-07-5369)
mengaku membenarkan Laporan Projek Sarjana Muda (PSM) ini disimpan di Perpustakaan Universiti Teknikal Malaysia Melaka (UTeM) dengan syarat-syarat kegunaan seperti berikut:
1. Laporan PSM adalah hak milik Universiti Teknikal Malaysia Melaka dan penulis.
2. Perpustakaan Universiti Teknikal Malaysia Melaka dibenarkan membuat salinan untuk tujuan pengajian sahaja dengan izin penulis.
3. Perpustakaan dibenarkan membusat salinan laporan PSM ini sebagai bahan pertukaran antara institusi pengajian tinggi.
4. *Sila tandakan (√)
SULIT (Mengandungi maklumat yang berdarjah keselamatan atau kepentingan Malaysiasebagaimana yang termaktub dalam AKTA RAHSIA RASMI 1972) TERHAD (Mengandungi maklumat TERHAD yang telah ditentukan oleh organisasi/
badan di mana penyelidikan dijalankan) TIDAK TERHAD
Disahkan oleh:
__________________ ___________________________ Alamat Tetap: Cop Rasmi:
NO1, LORONG HUTTON, 10050 GEROGETOWN, PULAU PINANG
Tarikh: 06 JULAI 2018 Tarikh: _______________________
i
DECLARATION
I hereby, declared this report entitled “Productivity Improvement Through TPM Adoption On Printing Machine” is the results of my own research expect as cited in the references.
Signature : ………..
Author’s Name : Mohd Aliff Mukmin Bin Abdul Rahim
ii
APPROVAL
This report is submitted to the Faculty of Manufacturing Engineering of UTeM as partial fulfilment of the requirements for the degree of Bachelor of Manufacturing Engineering (Management)(Hons.).The member of the supervisory is as follows:
………. Prof Madya Dr Mohd Rizal Bin Salleh
iii
ABSTRAK
iv
ABSTRACT
iv
DEDICATION
v
ACKNOWLEDGEMENT
vi
TABLE OF CONTENT
DECLARATION i
APPROVAL ii
ABSTRAK iii
ABSTRACT iv
DEDICATION iv
ACKNOWLEDGEMENT v
LIST OF FIGURE x
LIST OF TABLE xi
LIST OF EQUATION xii
LIST OF ABBREVIATION xiii
CHAPTER 1 : INTRODUCTION : 1
1.1 Introduction 1
1.2 Problem Statement 2
Figure 1.1 Pareto Chart of process in Evert 3
1.3 Objectives of Study 3
1.4 Scope of Study 4
CHAPTER 2 : LITERATURE REVIEW 5
2.1 Company Background 5
vii
2.2 Lean 6
2.3 Waste 8
2.3.1 Over-Production 9
2.3.2 Waiting 10
2.3.3 Overprocessing 10
2.3.4 Inventory 10
2.3.5 Motion 11
2.3.6 Defect 11
2.3.7 Transportation 12
2.4 TPM Total Productive Maintenance (Lean Tools) 12
Figure 2.2: 8 pillar of TPM Singh et al., (2013) 13
2.4.1 Autonomous Maintenance 14
2.4.2 Planned Maintenance 14
2.4.3 Focused Maintenance/Improvement (Kaizen) 14
2.4.4 Quality Maintenance 15
2.4.6 Safety,Health and Enviroment 15
2.4.7 Office TPM 15
2.5 Function of Production and Maintenance in TPM activity 16
Figure 2.3:Supporting element in TPM Chan et al., (2005) 16
2.6 Overall Equipment Effectiveness (OEE) 17
2.7 Six Major Loses 18
2.7.1 Equipment Failure 19
2.7.2 Setup and Adjustment 19
2.7.3 Idling and Minor Stop 19
2.7.4 Reduced Speed 19
2.7.6 Start-up Losses 20
viii
2.9 5S 21
Figure 2.4: 5S (Sources :
https://www.5stoday.com/content/images/custom/5S-wheel-diagram.jpg?v=2) 21
2.10 Pareto Chart 23
Figure 2.5: Example of pareto analysis Tague .,(2005) 23
2.12 Brainstorming 23
2.12 Summary 24
CHAPTER 3 : METHODOLOGY 25
3.1 Introduction 25
3.2 Project Overview 25
3.3 Project Plan 26
Figure 3.1 Project Progress chart 27
Figure 3.2: Methodology Progress chart 28
3.4 Research Methodology 29
3.5 Preliminary Stage 29
3.6 Information Gathering 30
3.7 TPM Implementation 31
3.7.1 Autonomous Maintenance approach 31
3.7.2 Planned Maintenance approach 32
3.8 Calculation of OEE 32
CHAPTER 4 : RESULT AND DISCUSSION 34
4.1 Issue in printing process 34
Figure 4.1 Pareto chart of Printing Issue 36
Figure 4.2 Printing Process 37
ix
4.2.1 Autonomous Maintenance 38
4.2.1.1 One Point Lesson (OPL) 38
Figure 4.3 Dial Indicating Torque Wrench(Source:
https://www.tohnichi.com/products/dial-torque-wrench-DB.htm) 39
Figure 4.5 One Point Lesson for Sensor Bolt Tightening 40
4.2.1.2 Checklist Printing Process 41
4.2.3 Planned Maintenance 42
4.3 Current Value of OEE 44
4.3.1 Availability Ratio 45
4.3.2 Quality Rate 46
4.3.3 Performance Efficiency 46
4.4 Overall Equipment Efficiency (OEE) 47
Figure 4.6 World OEE Comparison Chart 48
CHAPTER 5 : CONCLUSION AND RECOMMENDATION 50
5.1 Conclusion 50
5.2 Recommendation 51
5.3 Sustainability 52
5.4 Complexity 52
REFERENCES 53
x
LIST OF FIGURE
Figure 1.1 Pareto Chart of process in Evert 3
Figure 2.1 Company Logo 5
Figure 2.2: 8 pillar of TPM Singh et al., (2013) 13
Figure 2.3:Supporting element in TPM Chan et al., (2005) 16
Figure 2.4: 5S (Sources :
https://www.5stoday.com/content/images/custom/5S-wheel-diagram.jpg?v=2) 21
Figure 2.5: Example of pareto analysis Tague .,(2005) 23
Figure 2.6: Example of Ishikawa Diagram Tague., (2005) Error! Bookmark not defined.
Figure 3.1 Project Progress chart 27
Figure 3.2: Methodology Progress chart 28
Figure 4.1 Pareto chart of Printing Issue 36
Figure 4.2 Printing Process 37
Figure 4.3 Dial Indicating Torque Wrench(Source:
https://www.tohnichi.com/products/dial-torque-wrench-DB.htm) 39
Figure 4.5 One Point Lesson for Sensor Bolt Tightening 40
Figure 4.6 World OEE Comparison Chart 48
xi
LIST OF TABLE
Table 4.1: Type of issue in printing process 35
Table 4.1 Daily Checklist for Printing Process 41
Table 4.2 Maintenance Schedule Printing Process 43
Table 4.3 Factor of OEE 44
Table 4.3 Data of Availability 45
Table 4.4 Data of Quality 46
Table 4.5 Data of Efficiency 47
xii
LIST OF EQUATION
Equation 2.1 17
Equation 2. 18
xiii
LIST OF ABBREVIATION
TPM - Total Productive Maintenance
TPS - Toyota Production System
OEE - Overall Equipment Effectiveness
1
CHAPTER 1
INTRODUCTION
1.1 Introduction
Productivity is a core issue in manufacturing sector which every company wants it to be growing at higher rate than the past. Productivity is the rates of output that comes from the unit of input. One of the way to achieve the growth of productivity by getting closer with the of time of a process, the cost effective, effective use of available area to reduce the cost and increase the profit. Error that occur during production run is one of the cause of lower productivity. Error can come from man power, machine (breakdown) or from the part manufactured by supplier. Manufacturing industries highlights on dealing with this mistakes especially human mistake.
2
Effectiveness (OEE). The waste possibly come from breakdowns, setup and adjustment losses idling and minor stoppages, reduced speed and etc. To overcome this waste, one of the lean manufacturing tools which is Total Productive Maintenance(TPM) can be implemented in order to maximize the OEE.
The development of Lean Manufacturing nowadays helps the industry to improve their productivity prevailing. As indicated by Womack & Jones (1996), the term ‘Lean’ signify a group of activities or solution to eliminate waste, reduce non-value added operation, improve value added process and maximize performance.
1.2 Problem Statement
3
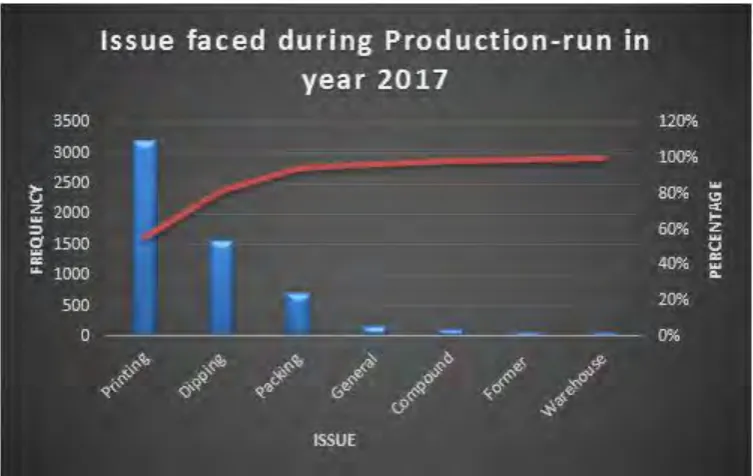
Figure 1.1 Pareto Chart of process in Evert
Based on Figure 1.1, The Pareto chart shows that the printing process that has the highest frequency what of machine breakdown among the 7 process. It is occurs more than 3000 times in a year of 2017 compared to Dipping which is 1500, Packing 600, general 48, Compound process 52 issues, Former 38 issues and Warehouse 20 issues.
1.3 Objectives of Study
The objectives of this study are:
I. To investigate the problems at the printing process due to inefficient of equipment.
4 1.4 Scope of Study
5
CHAPTER 2
LITERATURE REVIEW
[image:21.595.199.415.364.490.2]2.1 Company Background
Figure 2.1 Company Logo
Everts was founded in 1924 by Will Everts as a balloon printing company and distributor of novelties. At first, Everts was only produce the balls in 1954 but in 1965,it is started to produce its own balloon in Datteln, Germany. Time passes over the years, further printing operation were build in UK and in 1987 a second manufacturing plant was established in Melaka, Malaysia.
6
In this day, Evert now is part of the manufacturing division of Amscan, producing natural latex balloons that consummation the other in hose manufactured party products, with operation in Poland, United States and Mexico.
Today, Everts (Malaysia) Sdn. Bhd is operating in modern purpose built plant in Malacca at address 103 – 107 Jalan Usaha 6, Kawasan MIEL Phase II Ayer Keroh, Industrial Estate 75450 Melaka, Malaysia. The area of capacity is about 1500 sq. This company is running 24 hours production, 7 days per week at 3 Shift of work has been scheduled which is morning, (7.00am-3.00pm), afternoon (3.00pm-11.00pm) and night (11.00pm-7.00am). On average, it has more than 300 workers and most of them are foreigners from Indonesia and Nepal. This factory is considered as world class factory as it has other branches in Germany, United Kingdom, Mexico, China, Hong Kong.
This company consist of 6 different department, which is tools (Foam), material (Latex), Maintenance production, quality control, printing, and packing. Each department was assigned one manager to manage the worker and the department. The entire product of Everts are made from latex, the rubber material to make the balloon. Its raw physical properties is a liquid before it’s undergoes the process.
2.2 Lean
7
mainly old firms that organised and managed by traditional push systems Garre, Nikhil Bharadwaj, Shiva Shashank, Harish, & Sai Dheeraj, (2017). The improvement of quality, cycle times and customer responsiveness can be dramatic achieved with the sets of tools and techniques which universally adopted by many production company. According to the Alefari et al., (2017) the term lean can be found almost everywhere nowadays, including lean software development, lean service, lean entrepreneurship, lean accounting and many more. Although there is many different types of industries that used the lean term, but the underlying concept is still the same, which is maximize the customer value with the minimum waste or in the simplest sentences, delivering more with less.
According to Deshmukh et al. (2017), Lean is one of the effective and tested method of reducing operation cost and diminishing waste from manufacturing operation. Lean principles are described for the growth and survival of the industries for both production and also to a service sector. Applying lean production principle, engaging Kaizen events and reducing unnecessary activities will help to keep the business remain competitive. To produce high quality of work, process of the human working procedure should be defined properly. Lean helps to single out non value added services and removes the waste from the process. A continuous use of the lean implementation helps to expand the potential of industry and waste can be seen clearly and visibly in a process. The Implementation of Lean Manufacturing can be complex at initial stage, but result will be appreciated. It is just need commitment and period base of time.
Lean techniques are proposed and applied in almost every industry. It is are methodically applied lean concept and leading successes to their respective industries. IT, air travel and ship design industries are eliminating wastes and thus their profitability is enhancing. TFV model (explained by Koskela) views the lean as a concept in which process is assumed as system of value added actions, transformations and flows. Egan report (also known as Rethinking Construction) mentions that construction industry is produced by the lessons of manufacturing revolution.
8
which allow sharing of realization the philosophy of Lean Manufacturing. Akhramovich et al. (2017) also stated that the Russian companies face some challenge when implement this concept. The problem was an improper interpretation of approaches of Lean Manufacturing, internal barriers represented by the peculiarity of managing approaches in domestic leadership, and the loss of support by the government. Thus, it is important to have a good planning in order to implement Lean tool and technique and how it can be sustain in the company. Apparently by have a good planning and strategy can drive the company for a better future. The result will build up the enterprise’s competitiveness on the world stage.
Generally, Lean is a tools and technique that assist to eliminate waste or 7 Muda’s which that lead to the non value added of customer perspective. The waste elimination will improve the good of product quality, shorter lead time, reduce the production cost and the most important its increase the productivity continuously. It’s the solution to solve the problem of waste.
2.3 Waste
Toyota executive, Taichii Ohno who was the first who identified the initial 7 types of muda as written by Womack and Jones (2010). The definition of muda in Japanese word is waste, specially any human activity that absorb time, require excessive of human effort, or anything that have added no value to a process before proceed to next activity. Stated by Alukal et al,.(2006) stated that the definition of waste can be many and some of them includes any activities that create excessive cost and time but does not add value in return. According to Puvanasvaran et al.,(2014) there are seven types of waste in manufacturing industries are, any activity that bring cost but does not add value of the product or using extra resources than needed to produce the goods, or services that ordered by the customer.