A
ut
omatic
all
y
gener
at
ed
rough
by
Pr
oo
fCheck
fr
om
Ri
ver
V
alle
y
Tec
hnologies
Lt
d
Naleya Everson
1/ Tracy Levett-Jones
2/ Victoria Pitt
3/ Samuel Lapkin
4/ Pamela Van Der Riet
3/
Rachel Rossiter
5/ Donovan Jones
3/ Conor Gilligan
3/ Helen Courtney Pratt
6Analysis of the Empathic Concern Subscale of
the Emotional Response Questionnaire in a
Study Evaluating the Impact of a 3D Cultural
Simulation
1The University of Technology, Faculty of Health, Sydney, Australia, E-mail: [email protected] 2The University of Technology, Faculty of Health, Sydney, Australia, E-mail: [email protected] 3Department of Nursing, The University of Newcastle, Callaghan, New South Wales, Australia, E-mail:
[email protected], [email protected], [email protected], [email protected]
4Centre for Research in Nursing and Health, St George Hospital, Kogorah, Australia, E-mail:
5Charles Sturt University, Albury, New South Wales, Australia, E-mail: [email protected]
6University of Tasmania Faculty of Health, Hobart, Australia, E-mail: [email protected]
Abstract:
Abstract Background Empathic concern has been found to decline in health professional students. Few effective educational programs and a lack of validated scales are reported. Previous analysis of the Empathic Concern scale of the Emotional Response Questionnaire has reported both one and two latent constructs. Aim To evalu-ate the impact of simulation on nursing students’empathic concern and test the psychometric properties of the Empathic Concern scale. Methods The study used a one group pre-test post-test design with a convenience sam-ple of 460 nursing students. Empathic concern was measured pre-post simulation with the Empathic Concern scale. Factor Analysis was undertaken to investigate the structure of the scale. Results There was a statistically significant increase in Empathic Concern scores between pre-simulation 5.57 (SD = 1.04) and post-simulation 6.10 (SD = 0.95). Factor analysis of the Empathic Concern scale identified one latent dimension. Conclusion Immersive simulation may promote empathic concern. The Empathic Concern scale measured a single latent construct in this cohort.
Keywords:empathic-concern, compassion, simulation, culture DOI:10.1515/ijnes-2017-0003
Received:January 28, 2017;Revised:March 1, 2018;Accepted:March 7, 2018
Introduction
Empathy is a required attribute for all health professionals (Australian Medical Council, 2012; Nursing and Mid-wifery Board of Australia, 2006), and a key factor in patients’definitions of quality care (Regula, Miller, Mauger, & Marks, 2007). Empathy is also considered a basic component of all therapeutic relationships, with compelling research demonstrating the psychological and physiological benefits of empathetic engagement with patients (Brunero, Lamont & Coates, 2010; Doyle, Lennox & Bell, 2013; Post, 2011; Rakel et al., 2009; Sarinopoulos, 2012). Among several types of empathy, Empathic Concern (EC), an affective empathetic response linked to prosocial motivation and helping behaviour (Niezink, Siero, Dijkstra, Buunk, & Barelds, 2012), has been found to be a key mediator of important outcomes for both patients (Drwecki, Moore, Ward, & Prkachin, 2011; 2011) and healthcare professionals (Klimecki, Leiberg, Ricard, & Singer, 2014; Lamothe, Boujut, Zenasni, & Sultan, 2014). Internationally, a number of healthcare reports have identified a lack of EC as a contributing factor in patient neglect (Department of Health., 2002; Francis, 2013; Garling, 2008), resulting in a renewed focus on nursing education in this area (Papadopoulos & Ali, 2015).
There is currently a paucity of research on appropriate educational interventions to promote the develop-ment of health professional students’EC (Blomberg, Griffiths, Wengström, May, & Bridges, 2016; 2008; 2016),
A
ut
omatic
all
y
gener
at
ed
rough
by
Pr
oo
fCheck
fr
om
Ri
ver
V
alle
y
Tec
hnologies
Lt
d
and a reported lack of validated measurement instruments (Papadopoulos & Ali, 2015; Sinclair et al., 2016). This paper profiles a study that assessed changes in nursing students’EC, following exposure to a 3D cultural simulation and evaluated the psychometric properties of the EC subscale of the Emotional Response Question-naire.
Background
Empathy and empathic concern
Contemporary definitions of empathy vary between and within disciplines, however a growing body of em-pirical literature describes empathy as a multi-dimensional construct with cognitive and affective elements (Shamay-Tsoory, 2014; Singer & Klimecki, 2014). Cognitive empathy is understood to be form of psychologi-cal inference, enabling a person to perceive another person’s subjective experience from their point of view; whereas affective empathy involves emotional resonance with, or the sharing of, the affective states of others (Shamay-Tsoory, 2014).
Empathic concern is a related but distinct affective construct defined as“An emotional response of compassion and concern caused by witnessing someone else in need”(Niezink et al., 2012, p. 544). EC was first described by social psychologists in discussions of altruism and prosocial behaviour in the 1970s (Coke, Batson, & McDavis, 1978). Following a number of neuroscientific studies Singer and Klimecki (2014, p. 876) concluded that the terms EC and compassion denote the same construct and defined this as“A feeling of concern for another person’s suffering which is accompanied by the motivation to help”.
The impact of empathy on patients and health professionals
A number of studies have identified a relationship between healthcare professionals’ empathy and EC, and patient outcomes. For example, Rakel et al. (2009), found that physician empathy and compassion displayed in one consultation, resulted in a reduction in the duration and severity of illness, and an increase in immune function, in patients with a common cold. EC has also been associated with improved patient safety and sat-isfaction, wound healing, treatment adherence, and sense of wellbeing (Post, 2011). EC has been found to be negatively correlated with staff burnout and associated with increased positive affect (Klimecki et al., 2014; Lamothe et al., 2014). Significantly, reduced levels of EC for other racial groups have been shown to be highly predictive of nurses’pain treatment decisions, a finding that is of particular concern in the context of widely reported racial disparities in the treatment of pain (Drwecki et al., 2011).
Variability in levels of empathic concern
The dispositional tendency of individuals to react with EC to the suffering of others has been found to vary appreciably between individuals of different genders (Niezink et al., 2012) and of different ages (O’Brien, Kon-rath, Gruhn, & Hagen, 2013). A retrospective study that aggregated the findings of 72 studies undertaken with American college students (n= 13,737), identified that levels of EC had declined by more than 48 % in the pre-ceding 30 years, with the steepest decline occurring since 2000 (Konrath, O’Brien, & Hsing, 2011). A number of studies have also reported a seemingly paradoxical decline in the empathy of nursing (Ward, Cody, Schaal, & Hojat, 2012) and medical students (Neumann et al., 2011), as they progress in their studies.
Educational interventions to increase empathic concern
A
ut
omatic
all
y
gener
at
ed
rough
by
Pr
oo
fCheck
fr
om
Ri
ver
V
alle
y
Tec
hnologies
Lt
d
on death and dying that incorporated the filmWitfor pharmacy students (Manolakis, Olin, Thornton, Dolder, & Hanrahan, 2011); a viewing of the filmWitfor nursing and allied health students (Hunter, 2008); and mind-fulness based stress reduction training for medical and pre-medical students (Shapiro, Schwartz, & Bonner, 1998).
Studies that have investigated various mediators of EC have found that instructions which increase perspec-tive taking (Dovidio et al., 2010), and detailed processing (Woltin, Corneille, Yzerbyt, & Förster, 2011) promote EC. Specific training in EC has also been found to be effective in neuroscientific studies that have demonstrated changes in relevant neural networks following short term training programs involving meditation (Singer & Klimecki, 2014).
Measuring empathetic concern
Two scales have been instrumental in developing understanding of the EC construct and have been widely used as psychometric measures. The first is the Interpersonal Reactivity Index (IRI) (Davis, 1980), a dispositional measure of empathy that includes a subscale that measures EC. This subscale includes items such as:I often have tender or concerned feelings for people less fortunate than me.
The second scale, titled the Emotional Response Questionnaire (ERQ) (Batson, Fultz, & Schoenrade, 1987; Coke et al., 1978), was developed for use in the general population and measures EC and personal distress felt at a point in time, that is, as a psychological state rather than a dispositional trait. Variations of this scale have been used in over 55 studies (Niezink, 2008). Following a decade of research and factor analysis in six studies, Batson, Fultz, and Schoenrade (1987) identified a distinct subscale comprised of six adjectives that measure EC: sympathetic, compassionate, moved, tender, warmandsoft-hearted.
Batson et al’s (1987) EC scale uses a Likert rating scale (ranging from‘not at all’to“very much’) and partic-ipants are instructed to report how strongly they experience the listed feelings in response to stimuli such as video, audio or written scenarios depicting others in distress. The EC scale has demonstrated good reliability when used in different settings and with different cohorts (Cronbach alphas range from 0.79–0.94) (Niezink et al., 2012). Validity of the EC scale is supported by research utilising functional magnetic resonance imag-ing, with EC scores found to correlate highly with activation of empathy-related brain networks (Hein, Silani, Preuschoff, Batson, & Singer, 2010).
Recent research has raised the question of whether the EC scale of the ERQ is comprised of two latent constructs, described as Sympathy and Tenderness (Niezink et al., 2012). These two dimensions were proposed by Niezink et al. in light of studies that suggested people differentially experience sympathy in response to a current need, and tenderness in response to vulnerability (Lishner, Batson, & Huss, 2011). Whereas factor analysis conducted in six previous studies identified the EC scale as representing a single latent dimension (Batson et al. as cited in Niezink et al., 2012). Analysis reported by Batson et al. found that all scale items had factor loadings greater than 0.40 on the single factor Empathic Concern (Batson et al. as cited in Niezink et al., 2012).
In six of nine studies conducted by Niezink et al. (2012), factor analysis confirmed the hypothesised two la-tent dimensions: Tenderness (composed of the items:tender, warmandsoft-hearted)and Sympathy (represented by the itemscompassionate, sympatheticandmoved). However, the itemmovedshowed a variable pattern of load-ings in the remaining three studies, and significant cross loadload-ings. Cronbach’s alpha for the subscales across the nine studies ranged from 0.63 to 0.89. Thus, while the EC scale has consistently demonstrated reliability, the question remains whether EC is a single psychological construct, or is comprised of two latent dimensions.
Study aims
This study formed one component of a larger mixed methods multisite study. Previous papers have reported on student satisfaction with the simulation experience (Courtney-Pratt et al., 2015) and changes in empathy (rather than EC) using a modified version of the Kiersma-Chen Empathy Scale (Everson et al., 2015).
The aims of the current study were to:
1. Evaluate changes in nursing students’EC following exposure to a 3D cultural simulation;
A
ut
omatic
all
y
gener
at
ed
rough
by
Pr
oo
fCheck
fr
om
Ri
ver
V
alle
y
Tec
hnologies
Lt
d
Methods
Research design
A one group pre-test post-test design was used to evaluate changes in nursing students’EC following expo-sure to a 3D immersive cultural simulation. Due to the one group design and the nature of the educational simulation, the blinding of participants and outcome assessors could not be achieved. However, participants were not observed by researchers while completing the EC scale (the outcome measure) and responses were anonymous. To minimise risk of bias, invitation to participate in the study was extended by staff who were not involved in teaching or assessment in the course; the simulation, debriefing and EC questionnaire did not refer to empathy or EC explicitly; pre-post testing was conducted within a period of around 40 minutes; students were asked not to discuss the simulation with students who had not yet taken part in the simulation; and while the simulation was a mandatory course component, participation in the research was voluntary and did not impact assessment in the course.
Setting
The study was conducted at a large semi-metropolitan university in New South Wales, Australia where the Bachelor of Nursing (BN) program is offered across three campuses. Data were collected between April and June 2014.
Ethical considerations
Ethical approval for the study was sought and obtained from the university ethics committee prior to contacting potential participants (Approval Number H-2014-0060). All participants provided written informed consent and were able to withdraw consent at any time during the study period. Participants were assigned digital identifiers to link pre-post responses.
Sampling and recruitment
Convenience sampling was used with all second year BN students (530) undertaking the 3D cultural simulation invited to participate in the study. A formal invitation accompanied by a participant information statement was provided by email and on the university electronic learning management system (BlackboardTM). Potential participants were provided with the opportunity to ask questions prior to agreeing to participate.
Educational intervention
The educational intervention evaluated in this study consisted of a high-fidelity 3D cultural simulation de-veloped in collaboration with the staff and clients from the Northern Settlement Services for Migrants and Refugees. The theoretical basis for the intervention was the premise that a simulated experience could increase EC for others having similar real life experiences, and empirical literature that has identified prior experience (Hodges, Kiel, Kramer, Veach, & Villanueva, 2010) and perspective taking (Dovidio et al., 2010) as predictors of EC. Cultural empathy was selected as the focus of the simulation due to the increasing cultural diversity of patient populations internationally (Alonso, 2011), significant health disparities (Henderson & Kendall, 2011; Lee et al., 2012; World Health Organization Regional Office for Europe, 2010) and continued reports of dispari-ties in healthcare and adverse healthcare outcomes related to a lack of culturally competent healthcare practice (Divi, Koss, Schmaltz, & Loeb, 2007; Horner et al., 2004; Palmer et al., 2013; Smedley, Stith, & Nelson, 2009).
Results from four randomised controlled trials indicate that experiential simulations where learners are asked to ‘literally stand in the patient’s shoes’are a beneficial approach for teaching empathy (Bosse, Schultz, & Nickel, 2012; 2009; Daepen, Fortini, & Bertholet, 2012; Henry, Ozier, & Johnson, 2011), particularly when supported by opportunities for dialogue and debate. Therefore the simulation described below was specifically designed to provide and immersive point of view experience.
A
ut
omatic
all
y
gener
at
ed
rough
by
Pr
oo
fCheck
fr
om
Ri
ver
V
alle
y
Tec
hnologies
Lt
d
admitted to a small community hospital after becoming acutely unwell in a developing country. They then laid down on a bed in the simulation unit and, wearing 3D point of view glasses and headphones, watched a 10-minute 3D video of a hospital scenario that depicted a combination of cultural behaviours, symbols and metaphors incongruent with Anglo-Celtic Australian culture. In the unfolding scene languages other than En-glish were spoken and the healthcare practices were culturally unfamiliar to the participants. To enhance the authenticity and immersive nature of the simulation, students were exposed to a range of unfamiliar smells and tactile stimuli during the simulation. Once six students had viewed the video they attended a 30 minute debriefing and guided reflection.
Data collection
The EC scale was prefaced by a brief demographic questionnaire and pre-post versions included a scenario accompanied by an image of a women from a culturally and linguistically diverse (“CALD”) background who appeared distressed. The scenarios were developed with reference to the literature describing the experiences encountered by hospitalised patients from CALD backgrounds. The images and pre-post-scenarios were essen-tially the same with minor details such as the patients’age and health condition changed. The scenarios were reviewed by an expert panel and pilot tested prior to use in the current study.
Data collection took place during semester one 2014. The EC scale was completed by participants prior to and following the simulation. At each time-point participants were instructed to respond to the questions on the EC scale in relation to the written scenario and accompanying image.
Data analysis
Statistical analysis was performed using IBM SPSS Statistics version 22.0 for Windows (IBM Corp, 2013), and the packages paramap (O’Connor, 2015), pysch (Revelle, 2015) and lavaan (Rosseel, 2012), in R version 3.2.1 (R Core Team, 2015). Pre-post changes in EC were analysed using a paired samplest-test. While non-parametric tests have been recommended for data derived from ordinal rating scales, studies have found the paired samples t-test to be robust with ordinal (de-Winter & Dodou, 2010) and non-normallly distributed data (Lumley et al., 2002).
Bivariate Pearson’s correlations were performed to explore the relationship between the demographic vari-ables (gender, age and employment status) and pre-post EC scores. Correlation coefficient values of ± 0.1, ±0.3, and ± 0.5 were considered to be small, medium, and large effect sizes respectively (Ratner, 2013). Simple logistic regression was conducted to further explore the association between these variables.
Exploratory Factor Analysis (EFA) and Confirmatory Factor Analysis (CFA) were undertaken to investigate the factor structure of the EC scale. EFA incorporates a range of methods that aim to describe the underlying relationships between variables, and CFA employs structural equation modelling to test whether the identified or hypothesised models fit the data (Holgado–Tello, Chacón–Moscoso, Barbero–García, & Vila–Abad, 2010).
Data cleaning
Missing data were replaced with imputed values using expectation maximisation. This method imputes miss-ing values based on iterative maximum likelihood estimation of model parameters and missmiss-ing data, and has been found to produce less biased estimations than other methods (Nelwamondo, Mohamed, & Marwala, 2007).
Assumption testing for factor analysis
A number of tests were conducted to examine whether the data met assumptions for factor analysis. Sampling adequacy was evaluated based on the results of a simulation study by Mundfrom, Shaw and Ke (2005) that identified sample size requirements based on communalities, as well as the number of factors and variables in each factor. The Kaiser-Meyer-Olkin Measure of Sampling Adequacy, and Bartlett’s Test of Sphericity were also conducted to evaluate sampling adequacy for factor analysis (Pett, Lackey, & Sullivan, 2003).
A
ut
omatic
all
y
gener
at
ed
rough
by
Pr
oo
fCheck
fr
om
Ri
ver
V
alle
y
Tec
hnologies
Lt
d
Maximum Likelihood (ML) based approaches in EFA (Harrington as cited in Peng & Woodrow, 2010), while kurtosis greater than 7 and skewness above 2 are problematic in CFA (Newsom, 2015).
Factor analysis
Both EFA and CFA were analysed on the polychoric correlation matrix using pre-test data. The default Pear-son correlations assume equal interval scales of measurement and have been shown to produce biased factor loadings when analysing ordinal data (Holgado–Tello et al., 2010), whereas polychoric correlations more ac-curately reproduce the measurement model (Holgado–Tello et al., 2010) and are less sensitive to distributional assumptions (Zygmont & Smith, 2014).
Determining the number of factors to extract
It is recommended that decisions about the number of factors to extract should be informed by the results of multiple tests. Parallel analysis and the minimum average partial (MAP) procedure have been found to perform reliably and with higher accuracy than the eigenvalues greater than one rule and the scree test (Gaskin & Happell, 2014). Parallel analysis identifies factors that account for greater variance than randomly generated or chance factors, and the MAP procedure identifies components based on systematic variance (Zygmont & Smith, 2014).
McCoach, Gable, and Madura (2013) recommend conducting parallel analysis using both principal compo-nent analysis (PCA) and principal axis factoring (PAF), in addition to the MAP procedure and examination of the pattern matrix. Some authors have recommended the use of PCA based parallel analysis above PAF based parallel analysis (Gaskin & Happell, 2014; O’Connor, 2015). The PCA method accounts for all of the variance in the correlation matrix, while the PAF methods is based on the variance shared between variables (O’Connor, 2015).
Factor extraction and rotation
Based on the results of the parallel analysis and MAP both one and two factor solutions of the EC scale were ex-tracted with ordinary least squares (OLS). OLS is not based on distributional assumptions, and has been found to produce loading matrixes with less bias and error than other extraction methods when analysing ordinal data (Coughlin, 2013). Oblimen (oblique) rotation was used to rotate the pattern matrix. Oblique rotation methods are recommended when analysing social and psychological constructs as they assume factors correlate (Gaskin & Happell, 2014). Items with loadings greater than 0.40 are described as having a significant relationship with a factor, while loadings above 0.30 are considered acceptable in personality research (Laher, 2010). Factors with less than three variables are considered weak and unstable (Costello & Osborne, 2005), although factors with two variables may be acceptable if the variables correlate highly with each other and are relatively uncorrelated with variables on other factors (Yong & Pearce, 2013).
Confirmatory factor analysis
Confirmatory Factor Analysis was estimated with robust weighted least squares (WLSMV). WLSMV has been found to reliably fit models in the presence of normality violations and when analysing ordinal data (New-som, 2015). Goodness of fit was evaluated using the suggested Root Mean Square Error of Approximation (“RMSEA”) (less than 0.06) and Weighted Root Mean Square Residual (“WRMR”) (approximately less than 1) indices of model fit. The RMSEA and WRMR have been recommended as appropriate indicators of model fit when using WLSMV estimation (Newsom, 2015).
Internal consistency reliability of the EC scale
A
ut
omatic
all
y
gener
at
ed
rough
by
Pr
oo
fCheck
fr
om
Ri
ver
V
alle
y
Tec
hnologies
Lt
d
Results
Demographics
There were 460 participants from a population of 530 (response rate of 87 %). The majority were female (88 %) and their ages ranged from 18–60 years, with an average of 27 years. The participants’country of birth and first language varied, however the majority had been born in Australia (84 %) and spoke only English (86 %).
Research Aim 1: To evaluate changes in nursing students’empathic concern following exposure to a cultural empathy simulation
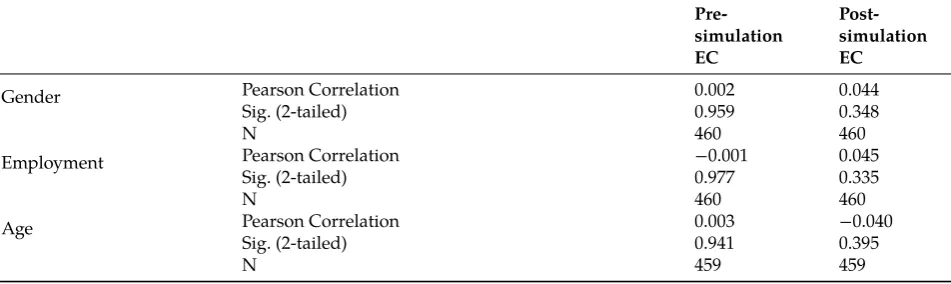
[image:7.595.55.543.356.443.2]Mean EC scores were 5.57 (SD = 1.04) pre-simulation and 6.10 (SD = 0.95) post-simulation; this increase was statistically significant (t(459) =‒12.48,p< 0.000, 95 % CI [‒0.0.61,‒0.44]) and represents a medium effect size (Cohen’s d = 0.53) (Walker, 2008). Mean scores and standard deviations for each of the six EC scale items are reported in Table 1. There were no significant correlations between pre-or post EC scores and the demographic variables of age, gender and employment status. Table 2 lists the correlation values among the variables. Sub-sequent regression analysis indicated that the variance in pre-or post EC scores was not explained by any of the demographics.
Table 1:Mean scores and standard deviations for EC scale items.
EC Scale Item Pre-test Mean ± SD Post-Test Mean ± SD
Sympathetic 6.17 ± 1.02 6.61 ± 1.93
Moved 5.31 ± 1.43 5.98 ± 1.22
Compassionate 6.10 ± 0.99 6.49 ± 0.85
Tender 5.23 ± 1.40 5.81 ± 1.28
Warm 5.03 ± 1.66 5.65 ± 1.49
Soft-hearted 5.61 ± 1.34 6.07 ± 1.20
Table 2:Pearson correlations between demographic variables and EC scale scores.
Pre-simulation EC
Post-simulation EC
Gender Pearson Correlation 0.002 0.044
Sig. (2-tailed) 0.959 0.348
N 460 460
Employment Pearson Correlation −0.001 0.045
Sig. (2-tailed) 0.977 0.335
N 460 460
Age Pearson Correlation 0.003 −0.040
Sig. (2-tailed) 0.941 0.395
N 459 459
Research Aim 2: To examine the factor structure of the EC scale
Previous studies using the EC scale have identified one and two factors. Therefore to better understand the un-derlying dimensions of the EC scale Exploratory (EFA) and Confirmatory (CFA) factor analysis were employed.
Missing data, sampling adequacy and data distribution
[image:7.595.62.538.499.641.2]A
ut
omatic
all
y
gener
at
ed
rough
by
Pr
oo
fCheck
fr
om
Ri
ver
V
alle
y
Tec
hnologies
Lt
d
indicated that a sample size of 320 or greater met Excellent-Level criterion for factor analysis. The Kaiser-Meyer-Olkin Measure of Sampling Adequacy (0.86) and Bartlett’s Test of Sphericity (χ2 = 1952.65 df = 15,p= 0.000) also indicated that the sample size was appropriate for factor analysis (Pett et al., 2003).
Mardia’s test of multivariate normality reported a high and statistically significant level of kurtosis identi-fying the data as multivariate non-normal (g2p = 83.43, z = 38.77, p = 0.00). Multivariate skewness was 16.11 and non-significant (g1p = 16.11χ2 = 1235.68,p= 1.02). Kurtosis exceeded the suggested cut-off ranges for ML approaches to EFA and CFA.
Exploratory factor analysis
The original and revised MAP tests as well as parallel analysis based on PCA, suggested a one factor solution for the EC scale. The eigenvalue of the identified factor in the parallel analysis was 4.22 compared to the highest randomly generated eigenvalue of 1.20. However a parallel analysis using PAF identified two factors. There was a substantial decline in eigenvalues from the first (eigenvalue 3.88) to second (eigenvalue 0.34) factor in the PAF based parallel analysis, suggesting a weak second factor.
One factor EFA
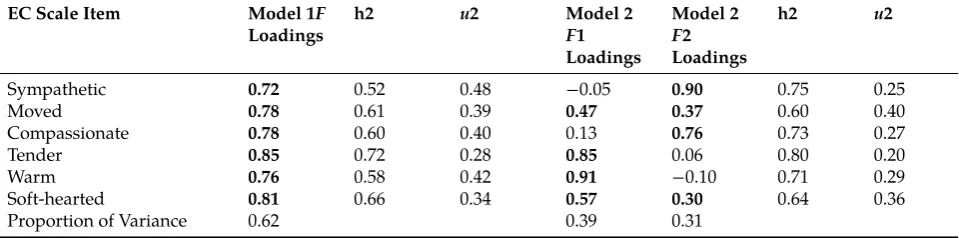
[image:8.595.59.539.408.527.2]The rotated factor loadings of one and two factor solutions are presented in Table 3. The single factor explained 62 % of the variance and all items demonstrated high loadings (0.72–0.85). The communalities were all above 0.40 (0.52–0.72): the suggested cut-off below which additional factors are indicated (Costello & Osborne, 2005).
Table 3:Factor analysis: rotated standardised loadings (pattern matrix) and proportion of variance explained by one and two factor solutions.
EC Scale Item Model 1F
Loadings
h2 u2 Model 2
F1 Loadings
Model 2
F2 Loadings
h2 u2
Sympathetic 0.72 0.52 0.48 −0.05 0.90 0.75 0.25
Moved 0.78 0.61 0.39 0.47 0.37 0.60 0.40
Compassionate 0.78 0.60 0.40 0.13 0.76 0.73 0.27
Tender 0.85 0.72 0.28 0.85 0.06 0.80 0.20
Warm 0.76 0.58 0.42 0.91 −0.10 0.71 0.29
Soft-hearted 0.81 0.66 0.34 0.57 0.30 0.64 0.36
Proportion of Variance 0.62 0.39 0.31
F= factor;h2 =communalities;u2 = unique variance.
Two factor EFA
In the two-factor model, the itemstenderandwarmloaded exclusively (loading of 0.85 and 0.91) on the first factor, andsympatheticandcompassionateexclusively (loadings of 0.90 and 0.76) on the second factor.Movedand soft-heartedcross-loaded, with higher loadings on the first factor. The two-factor model cumulatively explained 70 % of the variance and demonstrated higher communalities than the one factor solution (0.60–0.80). The inter-factor correlation of the two extracted inter-factors (0.69), was slightly below the value (>0.70) that is suggested to indicate significant overlap and a lack of distinction between constructs (Hair, 2006). The correlation matrix (Ta-ble 4) was examined to identify whether a factor with two varia(Ta-bles was justified by high correlations (>0.70) between those items, and a lack of correlation with other items (Yong & Pearce, 2013).Compassionateand sympa-theticwere highly correlated (0.77), howevercompassionateandsympatheticwere moderately to highly correlated (0.45–0.69) with the other four variables.
Table 4:The polychoric correlation matrix.
A
ut
omatic
all
y
gener
at
ed
rough
by
Pr
oo
fCheck
fr
om
Ri
ver
V
alle
y
Tec
hnologies
Lt
d
Sympathetic 1.00 0.61 0.77 0.57 0.45 0.61
Moved 0.61 1.00 0.67 0.69 0.59 0.62
Compassionate 0.77 0.67 1.00 0.65 0.55 0.64
Tender 0.57 0.69 0.65 1.00 0.77 0.73
Warm 0.45 0.59 0.55 0.77 1.00 0.68
Soft-hearted 0.61 0.62 0.64 0.73 0.68 1.00
Confirmatory factor analysis
As the results of the EFA provided some support for a two-factor model, which replicated, in part, previous analysis distinguishing the dimensions Sympathy and Tenderness (Niezink et al., 2012), both the one and two factor models were analysed in CFA.
In line with the factor loadings identified in the EFA, the two-factor model was specified withsympathetic and compassionateon one factor and the remaining variables on the second factor. Initial CFAs suggested a degree of misspecification in both the one factor and two factor models. Neither model achieved acceptable fit using the RMSEA and WRMR indices. The one factor model had a RMSEA of 0.157 and WRMR of 1.508, and the two factor model a RMSEA 0.097 and WRMR of 0.934.
Modified one and two factor models
Based on modification indices that reported large error correlations (21–68), the one factor model was respec-ified allowingsympatheticandcompassionateto co-vary andtenderandwarmto co-vary. The two-factor model was respecified withtenderandwarmco-varying. There was some theoretical justification for these modifica-tions: the terms sympathy and compassion have been described as synonymous (Singer & Klimecki, 2014) and tender and warm have been found to be highly correlated in factor analysis of other psychometric measures (Huang, 2001). Standardised factor loadings were between 0.82 and 1.00 for the respecified one factor model and between 0.89 and 1.00 for the respecified two factor model. The modified one and two factor models both demonstrated satisfactory fit with identical RMSEA (0.06) and WRMR (0.66) values.
Internal consistency reliability of the EC scale
The subscales of the two-factor model demonstrated good internal consistency on the pre-simulation data (Sym-pathy subscaleα0.81, Tenderness subscaleα0.85), however the Cronbach’s alpha for the Sympathy subscale on the post-simulation data was unacceptably low (α0.28). Cronbach’s alpha for the Tenderness subscale on the post-simulation data was 0.87. The one factor model demonstrated good internal consistency (α0.87) on the pre-test data and acceptable internal consistency (α0.78) on the post-test data.
Discussion
Research aim 1: To evaluate changes in nursing students’
empathic concern following exposure to a 3D
cultural simulation
A
ut
omatic
all
y
gener
at
ed
rough
by
Pr
oo
fCheck
fr
om
Ri
ver
V
alle
y
Tec
hnologies
Lt
d
Research aim 2: To examine the factor structure of the EC scale
Factor analysis of a two-factor model of the EC scale identified a similar pattern of loadings to those reported by Niezink et al. (2012). Their findings were replicated in the current study to the extent that the Sympathy and Tenderness factors contained the same items, and the itemmovedcross loaded. However the approach in the current study differed from that taken by Niezink et al: the factor analysis in their study was based on a hypothesised two factor structure rather than the use of statistical tests to identify the number of dimensions. A number of findings from the factor analysis in the current study suggested that a one factor solution better explained the structure of the EC scale in this sample. Firstly, in deciding the number of factors to extract, the use of PCA based parallel analysis has been recently recommended as more appropriate than PAF (Gaskin & Happell, 2014; O’Connor, 2015). With the exception of the PAF based parallel analysis in this study, all tests suggested a one factor structure. In addition, all items demonstrated high loadings on a single factor in the EFA. While there was some evidence for a two-factor structure, with the variablescompassionateandsympathetic correlating highly, these variables also correlated with variables on the second factor, suggesting that a two-item factor may not be justified. In addition, Cronbach’s alpha for the Sympathy subscale on the post-test data demonstrated unacceptably low internal consistency. Cronbach’s alpha was acceptable for the single factor scale on both the pre-test and post-test data.
The results of the CFA did not identify either model as demonstrating superior fit. Despite remaining ques-tions as to whether EC is comprised of Sympathy and Tenderness dimensions or represents a single latent con-struct, the research to date, confirmed by the current study, identifies the EC scale as consistently demonstrating internal consistency reliability and strong item factor loadings. Previous research reporting high correlations between EC scale scores and activation of empathy related brain networks, has further confirmed the validity of the scale as a measure of EC. The design of the scale as a state measure, which permits EC to be measured in response to particular groups or individuals, as well as its brevity, contributed to its utility in measuring changes in EC over a short time period in this study.
Study implications
Healthcare professionals’EC has been shown to directly impact patient outcomes and satisfaction with care (Post, 2011; Scott, 2011). EC also mitigates racial biases in the assessment and management of pain (Drwecki et al., 2011) and is protective against burnout and compassion fatigue (Klimecki et al., 2014; Lamothe et al., 2014). While studies have found that the EC of health professional students declines as they progress in their studies (Ward et al., 2012), a search of the literature did not identify any studies that reported on methods to promote the EC of health professional students. This study demonstrated that a brief 3D simulation can positively impact nursing students’EC towards CALD patients. This result may be of interest to educators and researchers involved in health professional education. Additionally, this study conducted factor analysis of the EC subscale of the ERQ in a large cohort of nursing students and the findings of this analysis may contribute to ongoing research into the widely used scale, as well as to understandings of the empathic concern construct in nursing and other disciplines. Finally, the nursing literature has reported a lack of validated scales to measure the construct compassion and this study highlights the utility and validity of the EC scale as a measure of the synonymous construct: empathic concern.
Limitations
Although the improved EC scores are encouraging, it should be noted that the extent to which simulation may lead to long term changes in participants’EC for CALD patients and how this may impact their clinical practice is not known. Additionally, the relative contributions of the simulation and the debriefing to the increased EC scores was not evaluated. Other limitations to the study include the lack of a control group and blinding which would have allowed exclusions of alternative explanations for increased scores. Additionally, although this study benefited from a large sample size, generalisability to other populations and contexts cannot be assumed.
Conclusion
A
ut
omatic
all
y
gener
at
ed
rough
by
Pr
oo
fCheck
fr
om
Ri
ver
V
alle
y
Tec
hnologies
Lt
d
concern. Consistent with other studies the EC scale demonstrated high internal consistency and is thus a reliable tool for measuring EC. Further research is needed to examine whether simulation education promotes enduring changes in levels of EC.
Funding
This work was supported by Department of Education, Employment and Workplace Relations, Australian Gov-ernment, Funder Id: 10.13039/501100000937, Grant Number: HEPPP.
References
Alonso, J. A. (2011).International migration and development: A review in light of the crisis (CDP Background Paper No. 11(E)). New York: United Na-tions Development Policy and Analysis Division.
Australian Medical Council Limited. (2012). Standards for assessment and accreditation of primary medical programs by the Australian Med-ical Council. Retrieved from http://www.amc.org.au/index.php/component/content/article/91-news/615-accred-review-dec-21
Batson, C. D., Fultz, J., & Schoenrade, P. A. (1987). Distress and empathy: Two qualitatively distinct vicarious emotions with different motiva-tional consequences.Journal of Personality,55(1), 19–39. Retrieved from http://psycnet.apa.org/journals/psp/36/7/752/
Blomberg, K., Griffiths, P., Wengström, Y., May, C., & Bridges, J. (2016). Interventions for compassionate nursing care: A systematic review. International Journal of Nursing Studies,62, 137–155. doi:10.1016/j.ijnurstu.2016.07.009
Bosse, H., Schultz, J., & Nickel, M. (2012). The effect of using standardised patient or peer role play on ratings of undergraduate communica-tion training: A randomized control trial.Patient Educational Counselling,87(3), 300–306.
Brown, T. A., & Moore, M. T. (2012). Confirmatory factor analysis. In R. H. Hoyle (Ed.),Handbook of structural equation modeling(pp. 361–379). New York: Guilford Publications.
Brunero, S., Lamont, S., & Coates, M. (2010). A review of empathy education in nursing.Nursing Inquiry,17(1), 65–74. doi:10.1111/j.1440-1800.2009.00482.x
Bunn, W., & Terpstra, J. (2009). Cultivating empathy for the mentally ill using simulated auditory hallucinations.Academic Psychiatry,33(6), 457–460. doi:10.1176/appi.ap.33.6.457
Coke, J. S., Batson, C. D., & McDavis, K. (1978). Empathic mediation of helping: A two-stage model.Journal of Personality and Social Psychology, 36(7), 752–766. doi:10.1037/0022-3514.36.7.752
Costello, A. B., & Osborne, J. W. (2005). Best practices in exploratory factor analysis: Four recommendations for getting the most from your analysis.Practical Assessment, Research & Evaluation,10(7), 1–9. Retrieved from pareonline.net/pdf/v10n7.pdf
Costello, J., & Haggart, M. (2008). The nature of nursing: Can we teach students how to care?Care.2, 41–55. Retrieved from
http://www.gcu.ac.uk/care/issuesarchive/issue2volume2/vol2iss2.the-nature-of-nursing.can-we-teach-students-how-to-care.-8310.pdf Coughlin, K. B. (2013).An analysis of factor extraction strategies: A comparison of the relative strengths of Principal Axis, Ordinary Least Squares, and
Maximum Likelihood in research contexts that include both categorical and continuous variables (Doctor of Philosophy). Florida USA: University of South Florida. Retrieved from http://scholarcommons.usf.edu/etd/4459
Courtney-Pratt, H., Levett-Jones, T., Lapkin, S., Pitt, V., Gilligan, C., Van Der Riet, P.,…Everson, N. (2015). Development and psy-chometric testing of the Satisfaction with Cultural Simulation Experience Scale.Nurse Education in Practice,15(6), 530–536. doi:10.1016/j.nepr.2015.07.009
Cunico, L., Sartori, R., Marognolli, O., & Meneghini, A. M. (2012). Developing empathy in nursing students: A cohort longitudinal study. Jour-nal of Clinical Nursing,21(13-14), 2016–2025. doi:10.1111/j.1365-2702.2012.04105.x
Daepen, J., Fortini, C., & Bertholet, N. (2012). Training medical students to conduct motivational interviewing: A randomized control trial. Patient Educational Counselling,87(3), 313–318. doi:10.1016/j.pec.2011.12.005
Davis, M. H. (1980). A multidimensional approach to individual differences in empathy.JSAS Catalog of Selected Documents in Psychology, 10(85). Retrieved from www.uv.es/~friasnav/Davis_1980.pd
Department of Health. (2002).Learning from Bristol: The Department of Healths’response to the report of the public enquiry into children’s heart surgery at the Bristol Royal infirmary 1984–1995. London, UK.: HMSO.
de-Winter, J. C. F., & Dodou, D. (2010). Five-Point Likert items: T-test versus Mann-Whitney-Wilcoxon.Practical Assessment, Research & Evalua-tion,15(11), 1–16. Retrieved from http://pareonline.net/getvn.asp?v=15&n=11
Divi, C., Koss, R. G., Schmaltz, S. P., & Loeb, J. M. (2007). Language proficiency and adverse events in US hospitals: A pilot study.International Journal for Quality in Health Care,19(2), 60–67. doi:10.1093/intqhc/mzl069
Dovidio, J. F., Johnson, J. D., Gaertner, S. L., Pearson, A. R., Saguy, T., Ashburn-Nardo, L., & Mikulincer, M. (2010). Empathy and intergroup re-lations. In P. R. Shaver (Ed.),Prosocial motives, emotions, and behavior: The better angels of our nature(pp. 393–408). Washington, DC: Ameri-can Psychological Association.
Doyle, C., Lennox, L., & Bell, D. (2013). A systematic review of evidence on the links between patient experience and clinical safety and effec-tiveness.British Medical Journal,3(1). doi:10.1136/bmjopen-2012-001570
Drwecki, B. B., Moore, C. F., Ward, S. E., & Prkachin, K. M. (2011). Reducing racial disparities in pain treatment: The role of empathy and perspective-taking.Pain,152(5), 1001–1006. doi:10.1016/j.pain.2010.12.005
A
ut
omatic
all
y
gener
at
ed
rough
by
Pr
oo
fCheck
fr
om
Ri
ver
V
alle
y
Tec
hnologies
Lt
d
Everson, N., Levett-Jones, T., & Pitt, V. (under review). The impact of educational interventions on the empathic concern of health profes-sional students: A literature review.
Francis, R. (2013).Report of the Mid Staffordshire NHS Foundation Trust Public Inquiry. London. Retrieved from www.midstaffspublicinquiry.com Garling, P. (2008). Final report of the special commission of enquiry: Acute care in New South Wales
pub-lic hospitals. Retrieved from http://www.dpc.nsw.gov.au/__data/assets/pdf_file/0003/34194/Overview_-_Special_Commission_Of_Inquiry_Into_Acute_Care_Services_In_New_South_Wales_Public_Hospitals.pdf
Gaskin, C. J., & Happell, B. (2014). On exploratory factor analysis: A review of recent evidence, an assessment of current practice, and recom-mendations for future use.International Journal of Nursing Studies,51(3), 511–521. doi:10.1016/j.ijnurstu.2013.10.005
George, D., & Mallery, P. (2000).SPSS for Windows step by step: A simple guide and reference 9.0 update(2nd ed.). Boston: Allyn and Bacon. Hair, J. F. (2006).Multivariate data analysis. (6th Pearson international ed.). Upper Saddle River, N.J.: Pearson Prentice Hall.
Hein, G., Silani, G., Preuschoff, K., Batson, C. D., & Singer, T. (2010). Neural responses to ingroup and outgroup members’suffering predict individual differences in costly helping.Neuron,68(1), 149–160. doi:10.1016/j.neuron.2010.09.003
Henderson, S., & Kendall, E. (2011). Culturally and linguistically diverse peoples’knowledge of accessibility and utilisation of health services: Exploring the need for improvement in health service delivery.Australian Journal of Primary Health,17, 195–201. doi:10.1071/PY10065 Henry, B., Ozier, A., & Johnson, A. (2011). Empathetic responses and attitudes about older adults: How experience with the aging game
mea-sures up.Educational Gerontology,37(10), 924–941. doi:https://doi.org/10.1080/03601277.2010.495540
Hodges, S. D., Kiel, K. J., Kramer, A. D., Veach, D., & Villanueva, B. R. (2010). Giving birth to empathy: The effects of similar expe-rience on empathic accuracy, empathic concern, and perceived empathy.Personality & Social Psychology Bulletin,36, 398–409. doi:https://doi.org/10.1177/0146167209350326
Holgado–Tello, F. P., Chacón–Moscoso, S., Barbero–García, I., & Vila–Abad, E. (2010). Polychoric versus Pearson correlations in exploratory and confirmatory factor analysis of ordinal variables.Quality and Quantitiy: International Journal of Methodology,44(1), 153–166. Retrieved from http://link.springer.com/article/10.1007%2Fs11135-008-9190-y
Horner, R. D., Salazar, W., Geiger, H. J., Bullock, K., Corbie-Smith, G., & Cornog, M.,…. Working Group on Changing Health Care Professionals’Behavior. (2004). Changing healthcare professionals’behaviors to eliminate disparities in health-care: What do we know? How might we proceed?The American Journal of Managed Care,10 Spec No, SP12–19. Retrieved from http://www.ncbi.nlm.nih.gov/pubmed/15481432
Huang, M. (2001). Measuring ad-evoked love. In M. C. Gilly & J. Meyers-Levy (Eds.),Advances in consumer research(Vol. 28, pp. 295–300). Val-dosta, GA: Association for Consumer Research.
Hunter, W. C. (2008).The value of the filmic encounter as a pedagogical tool for empathy promotion in allied health undergraduates(Unpublished doctoral dissertation). New Jearsey, USA: Drew University.
IBM Corp. (2013).IBM SPSS Statistics for Windows, Version 22.0.Armonk, NY: IBM Corp.
Klimecki, O. M., Leiberg, S., Ricard, M., & Singer, T. (2014). Differential pattern of functional brain plasticity after compassion and empathy training.Social Cognitive and Affective Neuroscience,9(6), 873–879. doi:10.1093/scan/nst060
Knox, J. (2013).‘Feeling for’and‘feeling with’: Developmental and neuroscientific perspectives on intersubjectivity and empathy.The Journal of Analytical Psychology,58(4), 491–509. doi:10.1111/1468-5922.12029
Konrath, S. H., O’Brien, E. H., & Hsing, C. (2011). Changes in dispositional empathy in American college students over time: A meta-analysis. Personality and Social Psychology Review,15(2), 180–198. doi:10.1177/1088868310377395
Laher, S. (2010). Using exploratory factor analysis in personality research: Best-practice recommendations.SA Journal Of Industrial Psychology, 36(1), 1–7. doi:doi:10.4102/sajip.v36i1.873
Lamothe, M., Boujut, E., Zenasni, F., & Sultan, S. (2014). To be or not to be empathic: The combined role of empathic concern and perspective taking in understanding burnout in general practice.BMC Family Practice,15, 15. doi:10.1186/1471-2296-15-15
Lee, C. H., Yun, J. M., Han, J. S., Park, S. M., Park, Y. S., & Hong, S. K. (2012). The prevalence of chronic diseases among migrants in Korea ac-cording to their length of stay and residential status.Korean Journal of Family Medicine,33, 34–43. doi:10.4082/kjfm.2012.33.1.34 Lishner, D. A., Batson, C. D., & Huss, E. (2011). Tenderness and sympathy: Distinct empathic emotions elicited by different forms of need.
Personality and Social Psychology Bulletin,37(5), 614–625. doi:10.1177/0146167211403157
Little, R. J. A. (1988). A test of Missing Completely at Random for multivariate data with missing values.Journal of the American Statistical Asso-ciation.83, 1198–1202. Retrieved from http://www.tandfonline.com/doi/abs/10.1080/01621459.1988.10478722
Lumley, T., Diehr, P., Emerson, S., & Chen, L. (2002). The importance of the normality assumption in large public health data sets.Annual Review of Public Health,23, 151–169. doi:10.1146/annurev.publhealth.23.100901.140546
Manolakis, M. L., Olin, J. L., Thornton, P. L., Dolder, C. R., & Hanrahan, C. (2011). A module on death and dying to develop empathy in student pharmacists.American Journal of Pharmacy Education,75(4), 71. Retrieved from http://www.ncbi.nlm.nih.gov/pubmed/21769147
McCoach, D. B., Gable, R. K., & Madura, J. P. (2013).Instrument development in the affective domain: School and corporate applications(3rd ed.). New York: Springer-Verlag.
McDonald, J. H. (2014).Handbook of biological statistics(3rd ed.). Baltimore, Maryland: Sparky House Publishing.
Mundfrom, D. J., Shaw, D. G., & Ke, T. (2005). Minimum sample size recommendations for conducting factor analyses.International Journal of Testing,5(2), 159–168. doi:10.1207/s15327574ijt0502_4
Nelwamondo, F., Mohamed, S., & Marwala, T. (2007). Missing data: A comparison of Neural Network and Expectation Maximisation tech-niques. Retrieved November 1st, 2015 from http://arxiv.org/abs/0704.3474
Neumann, M., Edelhauser, F., Tauschel, D., Fischer, M. R., Wirtz, M., Woopen, C.,…Scheffer, C. (2011). Empathy decline and its reasons: A systematic review of studies with medical students and residents.Academic Medicine,86(8), 996–1009. doi:10.1097/ACM.0b013e318221e615
A
ut
omatic
all
y
gener
at
ed
rough
by
Pr
oo
fCheck
fr
om
Ri
ver
V
alle
y
Tec
hnologies
Lt
d
Niezink, L. W. (2008).Considering others in need: On altruism, empathy and perspective taking (Doc-tor of Philosophy). Groningen, Netherlands: University of Groningen. Retrieved from
https://www.academia.edu/1304451/Considering_others_in_need._On_altruism_empathy_and_perspective_taking
Niezink, L. W., Siero, F. W., Dijkstra, P., Buunk, A. P., & Barelds, D. P. H. (2012). Empathic concern: Distinguishing between tenderness and sympathy.Motivation and Emotion,36(4), 544–549. doi:10.1007/s11031-011-9276-z
Nursing and Midwifery Board of Australia. (2006). National competency standards for the registered nurse. Retrieved from
http://www.nursingmidwiferyboard.gov.au/documents/default.aspx?record=WD10%2f1342&dbid=AP&chksum=N5ws04xdBlZijTTSdKnSTQ%3d%3d O’Brien, E., Konrath, S. H., Gruhn, D., & Hagen, A. L. (2013). Empathic concern and perspective taking: Linear and quadratic
ef-fects of age across the adult life span.The Journals of Gerontology. Series B, Psychological Sciences and Social Sciences,68(2), 168–175. doi:10.1093/geronb/gbs055
O’Connor, B. P. (2015). paramap.R package version 1.0. Retrieved from https://people.ok.ubc.ca/brioconn/nfactors/paramap.pdf
Osborne, J., & Waters, E. (2002). Four assumptions of multiple regression that researchers should always test.Practical Assessment, Research & Evaluation,8(2). Retrieved from http://PAREonline.net/getvn.asp?v=8&n=2
Palmer, N. R., Geiger, A. M., Felder, T. M., Lu, L., Case, L. D., & Weaver, K. E. (2013). Racial/Ethnic disparities in health care receipt among male cancer survivors.American Journal of Public Health,103, 1306–1313. doi:10.2105/AJPH.2012.301096
Papadopoulos, I., & Ali, S. (2015). Measuring compassion in nurses and other healthcare professionals: An integrative review.Nurse Education in Practice,16(1), 133–139. doi:http://dx.doi.org/10.1016/j.nepr.2015.08.001
Peng, J., & Woodrow, L. (2010). Willingness to communicate in english: A model in the chinese EFL classroom context.Language Learning, 60(4), 834–876. doi:10.1111/j.1467-9922.2010.00576.x
Pett, M. A., Lackey, N. R., & Sullivan, J. J. (2003).Making sense of factor analysis: The use of factor analysis for instrument development in health care research. London: Sage.
Post, S. G. (2011). Compassionate care enhancement: Benefits and outcomes.The International Journal of Person Centered Medicine,1(4), 808– 813. Retrieved from http://www.stonybrook.edu/bioethics/CCE.pdf
R Core Team. (2015).R: A language and environment for statistical computing. Version 3.2.1“World-Famous Astronaut”R Foundation for Statistical Computing. Retrieved from http://www.R-project.org/
Rakel, D. P., Hoeft, T. J., Barrett, B. P., Chewning, B. A., Craig, B. M., & Niu, M. (2009). Practitioner empathy and the duration of the common cold.Family Medicine,41(7), 494–501. Retrieved from http://www.ncbi.nlm.nih.gov/pubmed/19582635
Ratner, B. (2013). The correlation coefficient: Definition. Retrieved November 1st, 2015 from http://www.dmstat1.com/res/TheCorrelationCoefficientDefined.html
Regula, C. G., Miller, J. J., Mauger, D. T., & Marks, J. G. (2007). Quality of care from a patient’s perspective.Archives of Dermatology,143(12), 1589–1603. doi:10.1001/archderm.143.12.1592
Revelle, W. (2015). psych.R Package version 1.5.6. Retrieved from https://cran.r-project.org/web/packages/psych/index.html
Rogers, I. A. (1986). The effects of undergraduate nursing education on empathy.Western Journal of Nursing Research,8(3), 329–342. Retrieved from http://www.ncbi.nlm.nih.gov/pubmed/3639675
Rosseel, Y. (2012). lavaan: An R package for structural equation modeling.Journal of Statistical Software,48(2), 1–36. Sarinopoulos, A. M. I. (2012). Listen up, doc: Empathy raises patients’pain tolerance. Retrieved November 1st, 2015 from
http://msutoday.msu.edu/news/2012/listen-up-doc-empathy-raises-patients-pain-tolerance/
Scott, H. (2011).Empathy in healthcare settings (Doctor of Philosophy). London: Goldsmiths, University of London. Retrieved from http://research.gold.ac.uk/6704/
Shamay-Tsoory, S. G. (2014). Dynamic functional integration of distinct neural empathy systems.Social Cognitive Affective Neuroscience,9(1), 1–2. doi:10.1093/scan/nst107
Shapiro, S. L., Schwartz, G. E., & Bonner, G. (1998). Effects of mindfulness-based stress reduction on medical and premedical students.Journal of Behavioural Medicine,21(6), 581–599. Retrieved from http://www.ncbi.nlm.nih.gov/pubmed/9891256
Sinclair, S., Norris, J. M., McConnell, S. J., Chochinov, H. M., Hack, T. F., Hagen, N. A.,…Bouchal, S. R. (2016). Compassion: A scoping review of the healthcare literature.BMC Palliative Care,15(1), 6. doi:10.1186/s12904-016-0080-0
Sinclair, S., Russell, L. B., Hack, T. F., Kondejewski, J., & Sawatzky, R. (2016a). Measuring compassion in healthcare: A Comprehensive and critical review.The Patient, [Epub ahead of print]. doi:10.1007/s40271-016-0209-5
Singer, T., & Klimecki, O. M. (2014). Empathy and compassion.Current Biology,24(18), R875–R878. doi:10.1016/j.cub.2014.06.054
Smedley, B. D., Stith, A. Y., & Nelson, A. R. (2009).Unequal treatment confronting racial and ethnic disparities in health care. Washington: National Academies Press.
Treiblmaier, H., & Filzmoser, P. (2009). Exploratory factor analysis revisited: How robust methods support the detection of hidden mul-tivariate data structures in is research. Retrieved 29th May, 2015, from http://www.statistik.tuwien.ac.at/forschung/SM/SM-2009-5complete.pdf
Walker, I. (2008). Null hypothesis testing and effect sizes. Retrieved 29th May, 2015, http://staff.bath.ac.uk/pssiw/stats2/page2/page14/page14.html
Ward, J., Cody, J., Schaal, M., & Hojat, M. (2012). The empathy enigma: An empirical study of decline in empathy among undergraduate nursing students.Journal of Professional Nursing,28(1), 34–40. doi:10.1016/j.profnurs.2011.10.007
Woltin, K., Corneille, O., Yzerbyt, V. Y., & Förster, J. (2011). Narrowing down to open up for other people’s concerns: Empathic concern can be enhanced by inducing detailed processing.Journal of Experimental Social Psychology,47(2), 418–424. doi:10.1016/j.jesp.2010.11.006 World Health Organization Regional Office for Europe. (2010).How health systems can address health inequities linked to migration and ethnicity:
Briefing on policy issues produced through the WHO/European Commission equity project. Copenhage: WHO Regional Office for Europe. Yong, A. G., & Pearce, S. (2013). A beginner’s guide to factor analysis: Focusing on exploratory factor analysis.Tutorials in Quantitative Methods
A
ut
omatic
all
y
gener
at
ed
rough
by
Pr
oo
fCheck
fr
om
Ri
ver
V
alle
y
Tec
hnologies
Lt
d