Golden Rectangle Treemap
Liangfu Lu1,2, Shiliang Fan1, Maolin Huang3, Weidong Huang4 and Ruolan Yang1
1 School of Software, Tianjin University, Tianjin, P. R. China. 2 Mathematics Department, Tianjin University, Tianjin, P. R. China.
3 Faculty of Engineering and IT, University of Technology, Sydney, Australia. 4 School of Engineering and ICT, University of Tasmania, Tasmania, Australia.
Abstract. Treemaps, a visualization method of representing hierarchical data sets, are becoming more and more popular for its efficient and compact displays. Several algorithms have been proposed to create more useful display by controlling the aspect ratios of the rectangles that make up a treemap. In this paper, we introduce a new treemap algorithm, generating layout in which the rectangles are easier to select and hierarchy information is easier to obtain. This algorithm generates rectangles which approximate golden rectangles. To prove the effectiveness of our algorithm,at the end of this paper several analyses on golden rectangle treemap have been done on disk file system
1. Introduction
Hierarchical structures of information are widely used nowadays: computer program, family trees, directory structure and so on. It’s easy to locate information in small hierarchical structures, but large hierarchical structures are hard to handle. Several algorithms have been presented to solve this problem. Treemap[1] provide a method to generate rectangles recursively according to the given relations of nodes. This method enjoys the advantages such as high efficiency in generating layouts and great effectiveness in showing the size of final elements. But shortcomings are also significantly, emergence of thin and elongated rectangles and unclearness of hierarchical structures are the mutual problems of the treemap methods.
Among all the methods, Squarified treemaps algorithm generates the lowest aspect ratio on static data. Squarified treemaps[2] are introduced to solve the problem of thin and elongated rectangles, generating sub rectangles which approximate squares. In addition, this method makes full use of the display area.[3]
However, all of the traditional methods are focusing on improving space utilization and layout formation. Generated layout still has thin and elongated rectangles. In this paper, we combine traditional treemaps algorithms and golden rectangle to introduce the advantages of golden rectangle into traditional treemap algorithms. The golden rectangle has been known since ancient times as one having a pleasing shape. Many artists and architects have been fascinated by the presumption that the golden rectangle is considered aesthetically pleasing and balance. So we propose this method to generate a more aesthetically pleasing and rationally layout.
In geometry, a golden rectangle[4]is a rectangle whose side lengths are in the golden ratio. The golden ratio is a special number found by dividing a line into two parts so that the longer part divide by the smaller part is also equal to the whole length divided by the longer part. It is often symbolized
CCISP IOP Publishing
IOP Conf. Series: Journal of Physics: Conf. Series 787(2017) 012007 doi:10.1088/1742-6596/787/1/012007
International Conference on Recent Trends in Physics 2016 (ICRTP2016) IOP Publishing
using phi. In mathematical description, that is . [5][6][7]
2. Related work
Many methods are introduced to go through and display hierarchical structures which also known as tree. File browsers are the best known example[2][8], in which a listing of the file and directories are displayed, where the levels in the tree is showed by indentation. Only limited number of files and directory can be showed. Another well-known example is tree diagrams[1], it contains node and link. Elements are shown as node and relations are shown as links. However, these methods are not capable of giving overview of the whole structure[8]. Moreover, only limited information can be displayed via these methods.
In 1990s, treemaps[1] were firstly proposed to deal with the above problems, which use full use of the displaying area to show the tree content. Each node has a name and size. The size of leaves represents the size of related file. The size of non-leaf node is the summation of all its children nodes’ size. Treemaps are generated via recursive separation of rectangles.
Squarified treemaps were introduced to avoid the emergence of thin and elongated rectangle[2]. Generated square-like items are easier to detect and to compare in size. Besides, efficiency of space usage is improved. However, this algorithm does not work well with dynamic data.
In this paper, golden rectangle treemaps is proposed, which combines golden rectangle with Treemaps. In geometry, a golden rectangle[4] is a rectangle whose side lengths are in the golden ratio. The golden ratio is a special number found by dividing a line into two parts so that the longer part divide by the smaller part is also equal to the whole length divided by the longer part. And golden ratio
is calculated as . People have a long time using golden
rectangles, for example the Parthenon Temple. Figure 1 shows golden rectangle in Parthenon temple[9].
Kong’s experiment shows that not only extreme aspect ratio but also squares should be avoided in treemaps.[10] So using golden rectangle can also solve the problem of Squarified treemaps.
In this paper, we introduce aesthetic pleasing factors into treemaps methods. We generate layout in which rectangle approximate golden rectangle. And the presentation of nodes and leaves as golden rectangle has several advantages:
-efficient in display space using.
-easier to grasp relation between different nodes. -golden rectangles are easier to detect and point at
-size comparison is easier between rectangles which approximate golden rectangles. 3. Golden rectangle treemap
[image:2.595.85.296.451.588.2]During segmentation, we use heuristic algorithm to subdivide initial rectangle. The key idea is based on two thoughts. First, we don’t take all levels of a tree into consideration at a time. We treat siblings
Figure 1. Parthenon Temple[9]
CCISP IOP Publishing
at same level as a whole and fit these nodes in the rectangle which represent their parents’ node. Then we apply the same method recursively to next level of the tree. Thus the rectangles that the next level nodes divide into are golden-rectangle-like, which offers good chances for good separation. Second, we sort siblings in descending order according to their weight. When computing position for nodes to fit in, we choose the option that making golden rectangle parameter closer to 0.
We calculate the weight of as nodes follows: define tree in composed of N nodes. The root of has children.
(1)
And the tree have as root are defined as
are the whole siblings of tree . represent the weight of node . 3.1 Algorithm
Here we present our algorithm for golden rectangle treemaps. this algorithm is not capable of providing optimal result, because optimal result is time consuming. We decide to generate layout in reasonable time. So we use heuristic function during the whole algorithm,
(2)
This parameter is used to judge optimal situation during dividing. we think optimum is reached when adding next rectangle
(3)
refers to GRP after adding next rectangle, stands for GRP before adding next rectangle. In this situation, we think optimum is reached before this insertion. So we will stop adding this rectangle into the section which have already reached optimum. This rectangle is going to be added into (unprocessed domain of current processing rectangle). That means, when processing a rectangle, a decision is made between two alternatives. Either rectangle is added into current section, or current section is fixed or reaching optimum, new insertion should be started in the remaining area of current processing rectangles.
According to the shape of rectangle being processed, division is different. If parameter
(4)
represents the width of processing rectangle, stands for the height of processing rectangle, subdivision starts from the left part. And new rectangle will be added above original rectangle until reaching optimum. To subdivide a horizontal rectangle. We will add rectangles from bottom, and new rectangles will be added on the right of previous rectangles until reaching optimum in this section.
The whole algorithm can be summed up as following, Step1: Deciding processing rectangle shape.
(5)
And adding next rectangle into current section according to their shape. After adding in, compute parameter .
Step2: Add next rectangle into current section, and parameter will be computed. Then, decide whether current section has reached optimum before adding in this rectangle.
CCISP IOP Publishing
Step3: if current section has reached its optimum, then addition in step2 will be abandoned. And the rectangle to be added will be placed into remaining section. Then repeat step1 and step2.
Step4: optimum has not been reached in current section, keep repeating step2 until reaching optimum.
Stop condition: all the rectangles have been added into initial rectangle. This algorithm stops. 4. Experiments and results
To evaluate the performance of golden rectangle treemaps layout algorithms, we performed two experiments. The first experiment is visualizing disk file system, the original goal of designing treemaps. Our goal was to compare out algorithm with standard treemaps algorithm and Squarified treemaps algorithm. Besides, we also did a user study to compare layout readability between 6 algorithms.
4.1 Disk file system
[image:4.595.77.289.392.526.2]Visualizing file system is the original goal of treemaps. In this experiment, we read in file system information from folder A in local computer. Root folder A is composed of 12 folders and 13 files. One of its child folders D contains another 3 folders, so the data structure of folder A has 4 levels. Every file is represented with a rectangle and rectangle’s area shows the size of file. Structure of folder A is shown in Table 1.
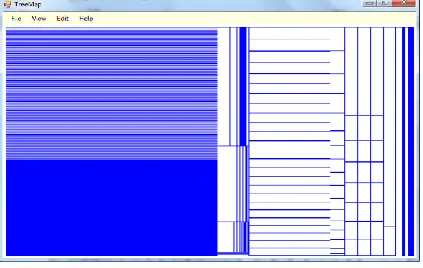
Figure 2 shows result of standard treemaps. In Figure 3 (a) (A) is the output of Squarified treemaps and (B) is the enlarged view of red region in (A).
Table 1. Structure of folder A
Folder Name
Parent
Folder Children
Folder Number
Contain File Number
A ―― 12 13
B A 0 229
C A 0 6
D A 3 10
E A 0 19
F A 0 1
G A 0 2
H1 A 0 8
H2 A 0 8
H3 A 0 8
I1 A 0 25
I2 A 0 25
I3 A 0 25
D1 D 0 10
D2 D 0 10
[image:4.595.292.524.419.654.2]D3 D 0 20
Figure 2. Standard Treemap Result
CCISP IOP Publishing
(A) (B) (b) Golden Rectangle Treemap Result
(A) (B)
[image:5.595.67.524.116.289.2](a) Squarified Treemap Result
Figure 3. Comparison Between Squarified Treemap and Golden Rectangle Treemap
[image:5.595.140.444.413.567.2]In Figure 3 (a)(B), it is hard to identify files 1, 2, ……, 8 belongs to which parent folder. So it loses structural hierarchical information. However, in Figure 3 (b)(B), we can tell easily that 1,2,3,4 and 5,6,7,8 belongs to different folders. (B) is enlarged view of (A). Besides, from Figure 3 (b)(A), we can see region A1 and A2 has the same structure and size. So is B1, B2, B3. Although Squarified treemap has this advantages, but it appears far less often than our algorithm.
Figure 4 shows the result of combining Cushion treemap[11] and our algorithm, using 3D effect highlights hierarchical structure.
5. Conclusions
In this paper, we proposed a new method to generate layout for hierarchical structures of information. We forced rectangles in the layout to be more golden rectangle like. This algorithm not only takes in advantages of squarified treemaps but also have two more advantages. First, our algorithm shows hierarchical structure more clearly. Second, comparison in size is more friendly. Size comparison between golden rectangles is easier than that between squares.
Acknowledgments
The authors wish to thank anonymous reviewers for spending valuable time in reviewing our paper and providing us with important comments to improve the paper. This work was supported in part by Science Foundation of Tianjin grant 15JCQNJC00200 and the FEIT Ph. D post thesis publication scholarship of University of Technology, Sydney, Australia.
Figure 4. Combine Cushion Treemap with Golden Rectangle Treemap
CCISP IOP Publishing
References
[1] Shneiderman B 1992 ACM Transactions on graphics (TOG)11(1) 92-99.
[2] Bruls M, Huizing K and Van Wijk J J 2000Data Visualization 2000. Springer Vienna2000 33-42.
[3] Marson F and Musse S R 2010 International Journal of Computer Games Technology2010 7. [4] Benjafield J 1976 The American journal of psychology
[5] Livio and Mario 2002 The Golden Ratio: The Story of Phi, The World's Most Astonishing Number (New York: Broadway Books)
[6] Piotr Sadowski 1996 The knight on his quest: symbolic patterns of transition in Sir Gawain and the Green Knight (University of Delaware Press) p 124
[7] Richard A Dunlap 1997 The Golden Ratio and Fibonacci Numbers (World Scientific Publishing) [8] R. Chimera, K. Wolman and B. Shneiderman 1991 Evaluation of three interfaces for browsing
hierarchical tables of contents (Technical Report Technical Report CAR-TR-539 CS-TR-2620 University of Maryland)
[9] The Parthenon and Phi, the Golden Ratio: http://www.goldennumber.net/parthenon-phi-golden-ratio/
[10] Kong N, Heer J and Agrawala M 2010 IEEE Trsnscations on Visualization and computer Grgapics16(6) 990-8.
[11] Van Wijk J J and Van de Wetering H 1999 Information Visualization1999 73-78.
CCISP IOP Publishing
![Figure 1. Parthenon Temple[9]](https://thumb-us.123doks.com/thumbv2/123dok_us/8409560.327455/2.595.85.296.451.588/figure-parthenon-temple.webp)
![Figure 4 shows the result of combining Cushion treemap[11] and our algorithm, using 3D effect](https://thumb-us.123doks.com/thumbv2/123dok_us/8409560.327455/5.595.140.444.413.567/figure-shows-result-combining-cushion-treemap-algorithm-effect.webp)
