University of Tasmania
Doctoral Thesis
Idiosyncratic risk assessment in the
mortgage market
Author:
Mar´ıa Bel´enYanotti
Supervisors: Dr. Mardi Dungey Dr. Graeme Wells Dr. Firmin Doko Tchatoka
A thesis submitted in fulfillment of the requirements for the degree of Doctor of Philosophy
in the
Discipline of Economics and Finance
Tasmanian School of Business and Economics
Declaration of Authorship
I, Mar´ıa Bel´enYanotti, declare that this thesis titled, ’Idiosyncratic risk assessment in
the mortgage market’ and the work presented in it are my own. I confirm that this work
was done wholly or mainly while in candidature for a research degree at this University.
Consultation of the published work of others has always been clearly attributed. Where
I have quoted from the work of others, the source is always given.
This dissertation consists of seven chapters: an introductory chapter, a literature and
market overview chapter, a data description chapter, three main research chapters, and
a concluding chapter. I am the single author of Chapters 2 and 3. Chapter 2 has been
adapted into a joint contribution with Dr. Judy Yates and will be published in a special
issue of the European Network of Housing Research (ENHR). Chapters 4, 5 and 6 are
co-authored with my supervisors. Chapters 4 and 5 has been submitted for publication.
Most data used in this thesis is confidential.
Earlier versions of Chapter 5 were presented at conferences at the Housing Market
Work-shop (University of Tasmania) in October 2012, at the Australian Mortgage Conference
(Sydney) in February 2013; at the ESAM meeting (University of Sydney) in July 2013;
at a EMF-ENHR Housing Finance Seminar (EMF, Brussels) in September 2013; at the
IFABS Conference (ISCTE - University Institute of Lisbon) in June 2014; at the ESAM
meeting (University of Tasmania) in July 2014; and at seminars at the University of
Tas-mania, the National University of Ireland - Maynooth in September 2012, the National
University of Tucum´an in November 2012, the Reserve Bank of Australia in November
2012, the University of Groningen in September 2013, and the University of Guelph in
October 2013.
This work has not previously been submitted in part or as a whole for any degree or any
other qualification at this University or any other institution. This thesis may be made
available for loan. This thesis may be made available for loan and limited copying and
communication in accordance with theCopyright Act 1968.
Signed:
Date:
ii
Abstract
This thesis investigates the role of borrower characteristics in revealing risk assessment
in the mortgage market. Two innovations make important contributions to the
inter-national literature. First, the thesis exploits a unique, detailed mortgage application
database which provides a means by which to investigate the role of individual
char-acteristic and personal circumstances in the variety of mortgage contracts found in the
market. Second, it takes advantage of the distinctive characteristics of Australian
fi-nancial markets to analyze contract choice in an environment where, due to the relative
underdevelopment of a mortgage securitisation market and absence of government
guar-antees, the risks of the mortgage contract are spread mainly between the originator (the
bank) and the mortgagee (the household).
As a result of the impact and spread of the global financial crisis of 2008-09, governments
and regulators are focusing their attention on macroprudential policy and systemic risk.
Results presented in this thesis demonstrate that underpinning these macroeconomic
concerns are important issues for the understanding of idiosyncratic mortgage risk. We
focus on these micro level problems by studying loan-level owner-occupier mortgage
ap-plication data. This work reinforces the relevance of assessing and pricing the risk for
borrowers and lenders based on the personal characteristics of the individual household.
In particular, the thesis investigates the role of borrower characteristics in the
deter-mination of: (i) mortgage product choice; (ii) loan-to-value ratios; and (iii) mortgage
interest rate.
The thesis brings together three substantive essays which are intended to be published
as separate papers, accompanied by two chapters which provide background to the
Aus-tralian financial sector (and the role of mortgage markets) and details on the micro
loan-level application data on which the subsequent empirical work is based. The first
essay aims to provide a formal clarification of the association between borrower
char-acteristics and types of mortgages by building typologies of borrowers based on their
characteristics and the type of mortgage they take. It introduces the use of Multiple
Correspondence Analysis techniques to household finance data. The empirical work finds
that young, low-income and low-wealth applicants deviate from the mean borrower, and
that households with high income but low wealth are associated with variable- or
fixed-rate mortgages, while households with low income but high wealth are associated with
home equity loans and discounted variable-rate mortgages. However, borrowers remain
heterogenous within mortgage types. Fixed-rate mortgages are taken by young,
iii
mortgages are taken by young (female) households, settled families and mobile first-time
buyers.
The second essay considers the empirical evidence on mortgage product choice with the
inclusion of a full range of variables representing mortgage costs, market conditions and
borrower characteristics, consistent with models proposed in the theoretical literature.
A discrete choice model is used to predict the marginal effect of borrower characteristics
on the probability of choosing a particular mortgage product. Moreover, it explores the
way mortgage choice effects are affected by loan-to-value ratio incentives given to banks
and imposed by the Australian regulatory body - in accordance with the Basel capital
requirements. It reveals a relationship between the prudential regulatory structures and
the mortgage choice at an individual-level. It finds that, contrary to popular wisdom, the
Basel capital adequacy rules play a ’sorting’ role in terms of the types of loan contracts
that emerge from the interaction between banks and borrowers. Although mortgage
choice is mainly determined by the relative cost of the mortgage and by a broad range
of borrower characteristics - which reveal life-cycle stage, income and wealth constraints
and uncertainty, risk-aversion, financial experience, and mobility expectations - these
borrower characteristics play different roles for different loan-to-value ratio levels.
The third essay addresses possible endogeneity and bias selection in estimating mortgage
choice. Endogeneity is addressed by predicting the loan-to-value ratio and instrumenting
the value of the property under the mortgage contract. Selection bias, which arises
from observing only the revealed preference of the borrower and not the alternatives in
the choice, is corrected by estimating the reduced form of the interest rate associated
with the mortgage. This chapter focuses on the effect borrower characteristics have
on interest rate and loan-to-value ratio determination. It finds that the value of the
property at the time of application is not statistically significant in determining the
loan-to-value ratio the bank offers to the borrower; however house price inflation and
expectations determine the loan-to-value ratio. Moreover, income and wealth levels
are strong factors determining both loan-to-value ratios and individual interest rates.
Importantly, borrower characteristics play the role predicted by theory in defining price
and terms of the mortgage at the individual level. This finding is necessary, but not
Acknowledgements
I would like to thank my supervisors, Professor Mardi Dungey, Associate Professor
Graeme Wells and Associate Professor Firmin Doko Tchatoka, for their guidance,
sup-port, inspiration and encouragement over the past years. I extend this gratitude to the
members of the Tasmanian School of Economics and Finance (TSBE) at the University
of Tasmania (UTAS) for collegiate assistance and support during my candidature.
My research has benefited from suggestions and comments by many academics, including
Associate Professor Judith Yates, Dr. Veronica Cacdac Warnock, Prof. Frank Warnock,
Associate Professor J. P. A. M. Jacobs, and Professor John Y. Campbell. I am grateful
for the helpful comments and suggestions from the thesis examiners. I would also like to
thank participants at the Housing Market Workshop (University of Tasmania) 2013; at
the Australian Mortgage Conference 2013; at the ESAM (University of Sydney) 2013;
at EMF-ENHR Housing Finance Seminar (European Mortgage Federation, Brussels)
2013; at the IFABS Conference (ISCTE - University Institute of Lisbon) 2014; at the
ESAM/ACE (University of Tasmania) 2014; and at seminars at the University of
Tas-mania, the National University of Ireland - Maynooth in September 2012, the National
University of Tucum´an in November 2012, the Reserve Bank of Australia in
Novem-ber 2012, the University of Groningen in SeptemNovem-ber 2013, and University of Guelph in
October 2013.
I am very grateful for scholarship and grant support. I acknowledge funding support
from Australian Research Council grant DP120100842, and from UTAS International
Postgraduate Research Scholarship and the Australian Postgraduate Award. I
acknowl-edge research assistance from Sharon Raymond.
I would also like to thank my lecturers and educators and administrative staff at
De-partamento de Econom´ıa, Facultad de Ciencias Econ´omicas, Universidad Nacional de
Tucum´an, Argentina, for their inspiration and dedication. Special thanks to Dr. Victor
Jorge El´ıas, Dra. Ana Mar´ıa Cerro and Osvaldo Meloni.
Finally, to my parents and siblings ‘gracias por educarme y darme su apoyo
incondi-cional’. To my husband, Marcus Salonen, for your love, companionship and support,
especially in accomplishing my goals. To my relatives and friends, thank you for the
encouragement and support.
Contents
Declaration of Authorship i
Abstract ii
Acknowledgements iv
Contents v
List of Figures vii
List of Tables viii
Abbreviations ix
1 Introduction 1
2 The Australian Mortgage Market 7
2.1 Introduction. . . 7
2.2 The Australian mortgage market: 20 years before the GFC . . . 8
2.2.1 Mortgage lenders - pre-GFC. . . 11
2.2.2 Australian demand for housing credit - pre-GFC . . . 16
2.3 The Australian mortgage market: The impact of the GFC . . . 23
2.3.1 Policy responses to the GFC . . . 24
2.3.2 Market reaction - supply of housing credit during the GFC . . . . 28
2.3.3 Market reaction - demand for housing credit during the GFC . . . 32
2.4 Current mortgage products in Australia . . . 34
2.5 Conclusion . . . 38
3 Data Description 40 3.1 Introduction. . . 40
3.2 Loan-level bank originated dataset . . . 41
3.2.1 Mortgage costs and the application process . . . 42
3.2.2 Borrower information . . . 48
3.2.3 Property under mortgage contract . . . 54
3.3 Data cleaning . . . 55
3.4 Owner-occupied mortgage products. . . 58
3.5 Residential investment property loans . . . 63
3.6 Other complementary data . . . 68
Contents vi
3.7 Conclusion . . . 70
4 Building Borrower Typologies in the Mortgage Market: Evidence from Australia 73 4.1 Introduction. . . 73
4.2 Mortgage products . . . 77
4.3 Method . . . 80
4.3.1 Multiple correspondence analysis (MCA) . . . 80
4.3.2 Cluster analysis: algorithm . . . 81
4.4 Borrower characteristics and type of mortgage. . . 82
4.4.1 Association between borrower characteristics and mortgage types . 83 4.4.2 Typologies of borrowers . . . 87
4.5 Conclusion . . . 96
5 Mortgage Choice Determinants: The Role of Risk and Bank Regula-tion 99 5.1 Introduction. . . 99
5.2 Background . . . 104
5.2.1 Australian market . . . 104
5.2.2 Mortgage choice determinants: predictions in previous literature . 105 5.3 Empirical specification . . . 107
5.4 Loan-level data . . . 109
5.5 Empirical results . . . 112
5.5.1 Mortgage costs and market conditions . . . 113
5.5.2 Borrower characteristics and risk categories . . . 115
5.6 Loan-to-valuation ratios (LTV) . . . 118
5.7 Robustness . . . 122
5.8 Conclusion . . . 123
6 Endogeneity in the Household Mortgage Choice 130 6.1 Introduction. . . 130
6.2 Existing literature . . . 132
6.3 Setup . . . 138
6.3.1 Empirical model specification . . . 138
6.3.2 Methodology . . . 140
6.3.3 Instrument selection . . . 141
6.4 Model estimation . . . 143
6.4.1 Mortgage choice . . . 143
6.4.2 Mortgage price and LTV . . . 145
6.5 Conclusion . . . 151
7 Conclusion 162
A Variable Definitions 170
List of Figures
2.1 Housing Finance Commitments (%, volume) . . . 10
2.2 Standard Variable Interest Rates . . . 14
2.3 Banks’ Liabilities (% of Total Liabilities, value) . . . 15
2.4 Standard Variable Interest Rates (Spread to RBA Cash Rate) . . . 17
2.5 Credit in Australia . . . 18
2.6 Home Price Indexes (Index, 2003-04 = 100) and Growth in Dwelling Index 20 2.7 Australian Housing Debt. . . 20
2.8 First-time Home Buyers in Australia . . . 21
2.9 The RBA’s Cash Rate . . . 25
2.10 Money Market Rates . . . 28
2.11 5-year Spread AA Credit Default Swaps . . . 30
2.12 Fixed-Rate Mortgages (%, volume) . . . 30
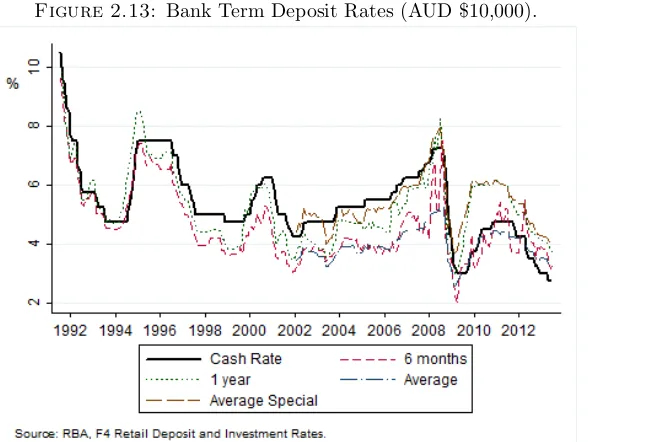
2.13 Bank Term Deposit Rates (AUD $10,000).. . . 31
3.1 Proportion of Mortgages by Purpose, Number of Mortgage Applications. . 44
3.2 Proportion of Mortgages by Purpose, Value of Dwellings under Finance Commitment. . . 44
3.3 Proportion of Mortgages by Type, Number of Mortgage Applications. . . 45
3.4 Proportion of Fixed-Rate Mortgages. . . 46
3.5 Average Interest Rates. . . 48
3.6 Mortgage Ratios, Histograms. . . 49
3.7 Average Monthly Mortgage Ratios. . . 49
3.8 Credit Scores, Histograms. . . 53
3.9 Average Monthly Credit Scores, Over Time. . . 54
3.10 Proportion of First-time Home Buyers (FHBs). . . 55
3.11 Property under mortgage. . . 56
3.12 Owner-occupier First-time Home Buyers (FHBs) . . . 60
3.13 Yield Spreads. . . 70
4.1 Multiple Correspondence Analysis. . . 85
4.2 Multiple Correspondence Analysis: Dimensions 1 and 2. . . 86
4.3 Multiple Correspondence Analysis: Sub-sets in Dimensions 1 and 2. . . . 88
4.4 Multiple Correspondence Analysis: Sub-sets in Dimensions 1 and 3. . . . 89
4.5 Cluster Analysis. . . 91
5.1 Distribution of Loan-to-Value Ratios (LTVs). . . 119
6.1 Endogeneity Diagram. . . 139
List of Tables
2.1 Authorized Deposit-taking Institutions (ADIs). . . 12
2.2 Assets and Liabilities of Some ADIs. . . 16
2.3 Securitized Assets of Some ADIs. . . 17
2.4 Loans to Households for Some ADIs. . . 23
3.1 Mortgage Products . . . 45
3.2 Mortgage Characteristics by Contract Stage . . . 47
3.3 Owner-occupier Home Loan Borrower Characteristics across Mortgage Products . . . 59
3.4 Home Loan Borrower Financial Position across Mortgage Products . . . 61
3.5 Home Loan Costs and Characteristics . . . 63
3.6 Residential Investment Property Loan (RIPL) Borrower Characteristics across Mortgage Products . . . 64
3.7 Residential Investment Property Loan (RIPL) Borrower Financial Posi-tion across Mortgage Products . . . 66
3.8 Residential Investment Property Loans (RIPL) Costs and Characteristics 67 4.1 Summary Statistics for Loan Characteristics across Loan Types . . . 78
4.2 Summary Statistics for Borrower Characteristics across Loan Types . . . 79
4.3 Clusters Overview: Risk Aversion . . . 90
4.4 Clusters Overview: Age and Mobility . . . 90
4.5 Clusters Overview: Income and Wealth Risks . . . 92
4.6 Borrower Typologies . . . 93
5.1 Summary Statistics by LTV . . . 111
5.2 Average Partial Effects: LTV sub-samples . . . 126
6.1 IV Diagnostic Tests . . . 155
6.2 Mortgage Choice . . . 156
6.3 LTV and Interest Rate Results . . . 159
A.1 Definitions for Variables . . . 171
A.2 Borrower characteristic variables used in MCA. . . 175
Abbreviations
ABS AustralianBureau of Statistics
ACT AustralianCapitalTerritory
ADIs AuthorisedDeposit-taking Institutions
AMP Alternative MortgageProduct
ANZ AustralianNew Zealand Banking Group Limited
AOFM AustralianOffice of Financial Management
APRA AustralianPrudential Regulation Authority
ARM Adjustable-RateMortgage
ASIC AustralianSecurities andInvestment Commission
CBA Commonwealth Bank of Australia
CDS Credit Default Swap
CGS Commonwealth GovernmentSecurities
CM Complex Mortgage
CPI Consumer Price Index
CRAA Credit ReferenceAssociation of Australia
DSR DebtServicingRatio
FCS Financial Claims Scheme
FHOG FirstHomeOwnerGrant
FHB First-timeHomeBuyer
FRM FixedRateMortgage
GFC GlobalFinancial Crisis
GSE GovernmentSponsored Enterprises
HE HomeEquity Loans
HM ‘Honeymoon’ Mortgage (discounted variable-rate mortgage)
ICA InsuranceCouncil of Australia
Abbreviations x
IMF InternationalMonetary Fund
LCR Liquidity Coverage Ratio
LMI Loan MortgageInsurance
LTV Loan-to-ValueRatio
MBS Mortgage-BackedSecurities
MCA Multiple CorrespondenceAnalysis
NAB NationalAustralia Bank
NSW NewSouthWales
NT NorthernTerritory
OIS OvernightIndex Swap
PCA PrincipalComponent Analysis
PTIR Payment-To-Income Ratio
QLD Queensland
RBA ReserveBank of Australia
RIPL ResidentialInvestment Property Loan
RMBS ResidentialMortgage-BackedSecurities
SA SouthAustralia
SFRM Short-term Fixed-RateMortgage
TAS Tasmania
UMI Uncommitted Monthly Income
VIC Victoria
VRM Variable-RateMortgage
Chapter 1
Introduction
Mortgages are complex contracts committing the parties involved to a long-term
trans-action agreement, and financing a good with both consumption and investment
charac-teristics. Property investment has been stimulated by the growth in asset prices during
the last quarter of the century, and modern mortgage instruments allow some level of
consumption smoothing for the borrower over the life cycle of a mortgage contract.1 The
uncertainties associated with long-term loans generate a series of risks for all parties
in-volved in the contract, and the mortgage products offered may hedge some of those
risks for some parties.2 In a world of certainty, the value of a mortgage from the lender’s
perspective is the expected present value of its future stream of benefits, discounted
at an appropriate rate. However, mortgage design and pricing is more challenging in
a stochastic economic environment with incomplete and asymmetric information,
po-tential moral hazard and adverse selection.3 The future value of the mortgage cannot
be known with certainty and, for this reason, preferences enter into valuations through
differing risk attitudes and business strategies.
1Elsinga [84] notes that modern mortgage instruments allow borrowers to extract the equity of their
home earlier than they typically used to through mortgage equity withdrawal contracts, for example.
2
The parties in a mortgage contract are the borrower(s) and lender, but other parties are also involved in this transaction such as mortgage insurance providers (in some jurisdictions government provided), investors in residential mortgage backed securities (RMBS) in the securitization market, and, potentially, mortgage brokers or intermediaries – such as lawyers and real estate agents.
3
For example, Dunn and Spatt [79] and Stanton and Wallace [174] argue that lenders may know the distribution of borrowers’ types and design mortgage contracts accordingly, however they can not observe the borrower individual type, which leads to potential adverse selection. Spiegel and Strange [173] argue that borrowers with high mortgage repayments have less incentive to care and maintain the house under the contract mortgage, which in turn affect the expected housing excess returns leading to adverse selection.
Introduction 2
This thesis focuses on understanding the role of borrower characteristics and individual
circumstances – which reveal borrowers’ preferences and risk attitudes – in the mortgage
product selection and pricing. In the next chapter I present an overview of the Australian
market to contextualize the background of the database used throughout this study.
The Australian mortgage market has many similarities with other mortgage markets
around the world. The predominant owner-occupier home loans offered in Australia are
variable-rate mortgages (VRMs), short-term fixed-rate mortgages (SFRMs), discounted
variable-rate or ‘honeymoon’ mortgages (HMs), and home equity loans (HEs). In the
third chapter I describe the rich proprietary database on owner-occupier mortgage
ap-plications used in this thesis. In the fourth chapter I explore borrower characteristics in
a non-parametric manner by building borrower typologies based on the type of mortgage
product selected, through the application of multiple correspondence analysis (MCA)
and cluster analysis. Initial results show that households with high income but low
wealth are more likely to take VRMs and SFRMs, while households with high wealth
but low income prefer products such as ‘honeymoon’ mortgages (HMs) and home equity
loans (HEs). I construct six distinctive borrower typologies in the Australian market.
In subsequent chapters, I predict the conditional probability of observing a borrowers’
application for a VRM and the determinants of that outcome, with particular focus on
borrowers’ individual characteristics. I find strong evidence of multiple borrower
char-acteristics playing a role in the mortgage product choice. In addition, I investigate the
role of regulatory capital requirements in an environment where banks hold mortgage
risk on their balance sheet and find that the capital requirement discounts based on
loan-to-valuation ratios (LTVs) divide otherwise similar borrowers between VRM and
other product choices. These findings are very timely given the current international
discussion on the adoption (and assessment) of maximum LTV regulations and capital
requirement incentives. The last chapter disentangles the impact of borrower
character-istics on mortgage product choice into a direct effect on mortgage product choice and
an indirect effect through mortgage price determination. It addresses the endogeneity
between interest rate and LTV determination.
The recent international developments that resulted in a global financial crisis provide
evidence of the consequences misunderstanding and mis-measurement of financial risks
have for the real economy. Governments and regulators are currently focusing their
Introduction 3
risk and the interactions between financial players in spreading the crisis, the
idiosyn-cratic risks in financial tools – such as mortgage products – become paramount not only
in triggering a crisis but also in its impact on the real economy, as was recently
experi-enced. Mortgages and mortgage-backed securities were at the center stage of the recent
global financial crisis. Many governments and banking regulators around the world have
taken, or are in the process of taking, actions to reduce the vulnerability of the banking,
mortgage and securitization markets.4 The relevance of understanding the individual
risk-sharing mechanism in a mortgage contract is then timely.
Borrowers face diverse risks when committing to a long-term contract such as a mortgage;
see Campbell and Cocco [43].5 Employment probability and real income growth and
volatility lead to income risk, which translates into the possibility of not being able to
meet scheduled mortgage repayments or, alternatively, being able to repay the loan at an
earlier date than contracted.6 Changes in borrower’s net wealth and equity lead to wealth
risk, which affects the probability of early prepayment or default. The possibility that
the borrower will hold the property under the mortgage contract only for a short period
relative to the term of the contract is defined as mobility risk, and can be impacted
by changes in family size and work mobility. In addition, borrowers face limitations
through risk-aversion, low financial literacy, and income and wealth constraints.
From the lender’s perspective, mobility risk and positive shocks on wealth or income can
be interpreted as prepayment risk. The possibility that borrowers prepay their mortgages
ahead of schedule may signify a mismatch between short- and long-term obligations and
rollover costs for the lender. Negative shocks on income and wealth are translated into
default risk, and eventually recovery risk.
Each risk has a systemic and an idiosyncratic component. Market risks affect borrowers’
and lenders’ individual risks. Interest rate risk is expected to be correlated with real
income risk for the borrower (and in some cases wealth risk), and affects costs of debt
funding for the lender; inflation will affect both income and wealth risks; the aggregate
4For a review of macroprudential policies in different countries see IMF [117]. For example, Australia
has put in place a Financial System Inquiry, is implementing Basel III capital accords, and it is opening a credit liquidity facility (CLF) to meet total liquidity needs. This facility will implement a system of data collection and publication with comprehensive information on securitized mortgages, in order to enhance transparency.
5
See also Piskorski and Tchistyi [153], Stanton and Wallace [174], and Dunn and Spatt [80].
6
Introduction 4
unemployment rate may affect income risk and mobility risk. The idiosyncratic
compo-nent of the borrower’s risk is mainly determined by the individual characteristics and
circumstances of the borrower. This thesis concentrates on understanding the latter.
Many economic and financial studies consider the risk-sharing structure between
bor-rowers and lenders. Relevant topics on mortgage contracts are: (1) mortgage choice,
(2) mortgage price determination, (3) mortgage termination (prepayment and default
behavior),7 and (4) refinancing options. In addition, mortgage contracts are pooled
into asset-backed securities and sold in the secondary market. Mortgage-backed security
(MBS) valuation, determined by prepayment and default options, is also relevant in the
study of mortgages in the securitization market.
A series of papers study the choice of taking a mortgage as a financing method for
residential property.8 However, most of the work on mortgage choice studies mortgage
product selection, concentrating traditionally on the choice between fixed-rate mortgages
(FRMs) and adjustable-rate mortgages (ARMs); see Campbell and Cocco [43], Baesel
and Biger [19], Alm and Follain [7].9 However, research has expanded to a variety of
newer and increasingly popular mortgage products.10
Home loan borrowers also consider the loan size, the term of the mortgage,11 whether
to contract a mortgage with the mortgage originator or with an intermediary party
(such as mortgage managers and brokers), and whether to take available private or
public mortgage insurance. Research on the size of the home loan estimates the joint
determination of mortgage debt and the value of the residential property under the
mortgage contract; see for example Ling and McGill [139]. Research on loan-to-value
ratios (LTV) has become increasingly popular with the emergence of the global financial
crisis and the resulting trend towards macroprudential policy.12
Lenders asses the design of mortgage products to offer and price them accordingly, with
much variability across jurisdictions. A series of studies concentrate on mortgage price
7
For a review on mortgage default see Quercia and Stegman [156]. See also Zorn and Lea [194].
8See for example Haurin et al. [107], Paiella and Pozzolo [150], Ehrmann and Ziegelmeyer [82]. 9
For existing empirical research on mortgage product choice see Brueckner and Follain [34], Dhillon et al. [73], Paiella and Pozzolo [150], Sa-Aadu and Sirmans [162], Coulibaly and Li [54], Vickery [183], and Ehrmann and Ziegelmeyer [82].
10See for example Amromin et al. [10], Scanlon et al. [166] and Cocco [50]. 11
See for example Dhillon et al. [74].
12
Introduction 5
determination; in particular, they predict mortgage interest rates,13but also investigate
bank fees and points.14 Part of this literature addresses the impact of GSEs on mortgage
rates and mortgage choice.15 The study of mortgage interest rates and product selection
has also included social issues such as racial or gender discrimination in mortgage
lend-ing.16 However, Berkovec et al. [24] and Cavalluzzo and Cavalluzzo [48] argue that it is
difficult to separate the effect of risk from that of market power in the formation of
inter-est rates; if market power is present, standard price discrimination can in turn become
the explanation for differential treatment, without necessarily reflecting the presence of
prejudice.17 Financial literacy in the mortgage market also plays a critical role.18
Mortgage choice has important macroeconomic implications. Mortgages are, in many
countries, a channel of monetary policy transmission. The distribution of risk in the
economy could have a relationship with the spread and magnitude of a shock; Landier
et al. [131]. Debelle [65] argues that a larger stock of household debt increases the
sensitivity of the household sector to fluctuations in income, interest rates and house
prices, and adds that countries with predominant share of VRMs have displayed higher
house price growth and volatility than countries with mainly FRMs.
Finance literature on mortgages generally apply option-based theory to mortgage
val-uation. The evolution of a mortgage over time is of particular interest for mortgage
and insurance providers, and for investors in mortgage-backed securities; see Dunn and
McConnell [78]. The option-based approach, however, understates the role of borrower
preferences and characteristics; see Kau and Keenan [120].19 In particular, interest lies
on mortgage performance and the prepayment and default options.20
13
See for example Rosenthal and Zorn [159], Ambrose et al. [8] and Gary-Bobo and Larribeau [94].
14See for example Kau and Keenan [119] and Yang [190]. 15
See Hendershott and Shilling [110], Hendershott et al. [109], McKenzie [142], Ambrose et al. [9], Passmore et al. [151], and Fuster and Vickery [92].
16
See for example Munnell et al. [148], Schafer and Ladd [167], and Ladd [129].
17
See also Yezer et al. [193].
18See Gerardi et al. [97], Lusardi [141], and Miles [143]. 19
Kau and Keenan [120] argue that the accomplishment of the option theory is to show that the role of preferences is actually quite limited when applied to derivative assets.
20
Introduction 6
This thesis concentrates on mortgage product choice and price, with particular focus on
the role of borrower characteristics. Although lenders assess borrower preferences and
risks through the collection of personal demographic and financial (both soft and hard)
information, borrowers have power in choosing and negotiating rates based on their
preferences and private information. In an era where technological advancement allows
rapid and inexpensive collection and storage of individual information, the impact that
borrower characteristics have on mortgage product choice and price become relevant.
The thesis is organized as follows. Chapter 2 presents the background review on the
Australian market. Chapter3 follows by describing the rich bank-generated dataset on
mortgage applications. Chapter 4builds owner-occupier borrower typologies to explore
their characteristics further. Chapter 5 predicts conditional probabilities of VRM
ap-plications, and its determinants. This chapter contributes in distinguishing the relevant
borrower characteristics in mortgage product selection for different LTV levels, as
de-fined by the capital requirement discount incentives to the banking sector. Chapter 6
addresses endogeneity in the mortgage product choice specification, with special focus
on mortgage interest rate and LTV determination. In particular, chapters4-6have been
written as stand-alone papers and may repeat some of the descriptive material. The last
Chapter 2
The Australian Mortgage Market
2.1
Introduction
During the 1980s, Australia experienced a series of reforms that would transform its
economy. From the early 1980s to 1996, financial markets were freed from price controls,
entry was liberalized, and the regulatory structure was renovated. By 1996, the
transi-tion from discretransi-tionary monetary policies to an inflatransi-tion-targeting regime was complete;
see de Brouwer [62].
The first major reform was in December 1983, when the Australian government decided
to float the exchange rate and remove most capital controls; since then, the Reserve
Bank (RBA) has only intervened in foreign exchange markets to prevent ‘disorderly’
market behavior. The second step was the process of deregulation and opening capital
markets. Interest rate controls on loans were removed in April 1985.1 Restrictions on
the entry of foreign banks were relaxed in the previous year, allowing fifteen new overseas
banks to be licensed and participate in the Australian financial market.2
By 1988, Australia had the foundations of the modern economic and financial era,
char-acterized by freer trade, deregulated markets, lower tax rates, low inflation, and a more
1
Controls over interest rates on certificates of deposits and other bank deposits were removed in 1973 and 1980, respectively.
2
Before 1985, only two foreign institutions operated as authorized banks in Australia in the post-war period. Since 1985, most overseas banks have assumed subsidiary status (rather than a branch structure), which requires capital to be held locally. For more details see ‘Box C: Foreign-owned banks in Australia’, Reserve Bank of Australia Financial Stability Report, March 2007,http://www.rba.gov. au/publications/fsr/boxes/2007/mar/c.pdf.
Chapter 2. The Australian Mortgage Market 8
market-oriented economy; see Kelly [122]. Deregulation was expected to deliver more
effective monetary policy, and increase access to credit and financial innovation.
However, the foundations for a modern and stable financial system were incomplete
without a modern regulatory regime. The large losses experienced by several banks in
the late 1980s and the beginning of the 1990s highlighted weaknesses in risk management
within financial institutions. As a consequence, the 1990s saw the beginning of new
arrangements for prudential supervision of these institutions. During the first half of
that decade, the RBA conducted targeted, risk-based, on-site bank reviews. TheWallis
Inquiry in 1996 set the basis for the development of the structure of a prudentially
regulated financial system.
The last major reform was the formal adoption of an inflation-targeting regime. After
a period of unsatisfactory discretionary monetary policy, the RBA, in agreement with
the Federal Treasurer, announced in 1996 it would target a 2-3 percent inflation rate.
For more discussion on deregulation in these early stages, and in particular a detailed
timeline of the reforms, see de Brouwer [62]. By 1998, with the implementation of
inflation targeting and the establishment of a regulatory oversight of risk-taking by
banks and other financial institutions, the main features of Australia’s modern financial
markets were in place.
The rest of this chapter proceeds as follows. Section 2.2presents a review of the
Aus-tralian mortgage market during the twenty years prior to the global financial crisis
(GFC), with particular focus on the demand for, and supply of, housing credit.
Sec-tion 2.3discusses the impact of the GFC on the mortgage market. It first concentrates
on relevant policy responses to the global turmoil and then analyzes the demand for,
and supply of, mortgages during the crisis period. Section 2.4 provides an overview
of mortgage products currently offered in Australia. Section 2.5 presents concluding
remarks.
2.2
The Australian mortgage market: 20 years before the
GFC
As previously stated, some of the modern features of Australia’s financial system were
Chapter 2. The Australian Mortgage Market 9
Deregulation increased the number of financing institutions and was accompanied by
new financial products. Greater competition and easier access to funds facilitated rapid
growth in the balance sheets of institutions, along with a rapid expansion of credit,
particularly for commercial property investment. At the same time commercial
prop-erty prices were increasing rapidly. However, prudential standards did not keep pace
with these market developments, and in 1989, high interest rates and a deceleration of
commercial property prices contributed to exposing risky loans. The economy fell into
recession between 1990 and 1992, and several financial institutions experienced large
losses; see Gizycki and Lowe [98].3
This experience uncovered the need for regulatory reform and motivated theFinancial
System (‘Wallis’) Inquiry in June 1996; see Harper [106]. The Wallis Inquiry set the
basis for a tightening of regulatory oversight of risk-taking financial institutions; in this
way, all banks were set to manage risk on a consolidated basis.
Since 1998, Australian financial institutions have been regulated by the Australian
Pru-dential Regulation Authority (APRA),4 which assumed prudential regulation functions
previously undertaken to some degree by the RBA. While APRA focuses on the stability
of authorized deposit-taking institutions (ADIs),5 since 2001 the Australian Securities
and Investment Commission (ASIC) has been responsible for the regulation of financial
products. The RBA retains responsibility for monetary policy and systemic stability
in the whole financial system.6 Senior representatives of the RBA, APRA, ASIC and
Department of the Treasury comprise the Council of Financial Regulators, which is the
coordinating body for Australia’s main financial regulatory agencies.
3
Total individual losses in the banking system represented 36% of the aggregate level of shareholders’ funds. In particular, state government owned banks’ individual losses represented 187% of shareholders’ funds. Some major banks, such as Westpac and ANZ, also experienced significant losses.
4APRA regulates banks, general and life insurance companies, superannuation funds, credit unions,
building societies, and friendly societies to ensure that these institutions remain financially sound and able to meet their obligations to depositors, fund members, and policy holders. www.apra.gov.au
5ADIs are institutions that are licensed and regulated by APRA under theBanking Act1959. APRA
has focused on the balance sheet soundness of these financial institutions through specific balance sheet requirements such as capital adequacy rules and general supervisory oversight following Basel Committee recommendations.
6A Payments System Board was established within the RBA with the responsibility to promote safety,
Chapter 2. The Australian Mortgage Market 10
After the financial instability of the early 1990s, banks shifted their focus toward lower
risk-weighted assets such as housing loans. Prior to 1980, banks held on average 60
percent of owner-occupier housing finance commitments; this share rose through the
1980s and 1990s. By 1994, the domestic banking system provided 92 percent of the
[image:21.596.147.501.198.442.2]residential housing credit; see Figure 2.1.
Figure 2.1: Housing Finance Commitments (%, volume)
During the second half of the 1990s, competition increased with the introduction of
new players in the market. International lenders, who entered the market between
1985 and 1993, and wholesale mortgage originators and mortgage brokers,7 who joined
around 1996, further stimulated competition. Financial deregulation and the entry of
new lenders gave rise to a wider range of financial products offered. During this period,
most mortgages were a fully documented, full-recourse, variable-rate loan; fixed-rate
7Wholesale mortgage lenders originate and service loans, and sell them to the secondary market,
and have contracting functions performed for them by mortgage brokers; seehttp://www.abs.gov.au/ Ausstats/abs@.nsf/glossary/5609.0. In particular, a mortgage manager is a licensee who manages a mortgage relationship between a credit provider and a consumer under his own branded name; see
National Consumer Credit Protection Legislation (NCCP),Regulation 26. Mortgage managers are
Chapter 2. The Australian Mortgage Market 11
mortgages (FRM) represented less than a quarter of the mortgage market.8 Non-bank
lenders introduced low-documentation loans, along with riskier loans such as
interest-only loans and revolving credit lines. Home equity loans9 were introduced to the market
around 1996 but grew in popularity from 2003.
Lending standards relaxed over the period. Before deregulation, lending standards were
quite conservative, with a maximum debt service-to-income ratio of 30 percent10 and
loan-to-value ratios (LTVs) of a maximum of 80 percent. As a result of deregulation and
increased competition, measures of disposable income and property valuation methods
were redefined and relaxed. Higher LTVs were available, backed by private loan
mort-gage insurance (LMI). The increase in the number of loan arrears in the first part of the
twenty-first century could be attributed to the relaxation of lending standards;
never-theless, loan arrears in Australia are very low relative to international standards.11
The overall effect of deregulation for the financial system was an increase in the supply
of credit and a reduction in the cost of credit. In the next section, I focus on the players
in the housing credit market before the GFC, first discussing the providers of housing
credit and then giving an overview of the demand for housing loans.
2.2.1 Mortgage lenders - pre-GFC
The housing credit market has played an important role in Australia’s financial system.
Historically, mortgage originators, principally ADIs, held around half of the total assets
in the financial system; see IMF [115] and IMF [116].
ADIs comprise domestic and foreign banks, building societies, and credit unions,
al-though banks hold around 96 percent of the total assets held by ADIs. The first panel
of Table 2.1 provides a snapshot of the evolution of the number of ADIs in the
Aus-tralian mortgage market. For the last twenty-five years, the AusAus-tralian banking system
8In the Australian context, fixed-rate mortgages are loans with a set interest rate for a minimum
period of two years; see ABS, Housing Finance Commitments 5609.09a, http://www.abs.gov.au/ AUSSTATS/abs@.nsf/DetailsPage/5609.0Aug%202014?OpenDocument. These type of loans are discussed further in this chapter and following chapters.
9Described in Section2.4. 10
This was a ‘rule of thumb’ of lenders, and not a regulation.
11
Chapter 2. The Australian Mortgage Market 12
has been concentrated around four major domestic banks.12 During the fifteen years
leading up to 2007, the major Australian banks held over 60 percent of ADI assets.
The second panel of Table2.1shows the share of total ADI assets by type of institution.
After 1990, the demutualization of building societies, together with mergers among both
small and major deposit-taking institutions of all types, transformed the composition
of ADIs in the credit market. In general, foreign banks operating in Australia have
shown relatively little interest in retail banking, focusing mainly on wholesale funding
[image:23.596.168.464.283.566.2]and funds management.
Table 2.1: Authorized Deposit-taking Institutions (ADIs). Number 1990 1999 2005 2010
Major Australian banks 4 4 4 4 Other domestic banks 13 8 9 7 Building societies and credit unions 330 238 170 116 Foreign-owned banks
- subsidiaries 15 11 11 9 - branches 3 25 28 34 Total 365 286 222 170
Proportion of total assets (value) 1990 1999 2005 2010
Major Australian banks 59% 63% 65% 75% Other domestic banks 21% 17% 14% 9% Building societies and credit unions 9% 5% 4% 3% Foreign-owned banks
- subsidiaries 10% 6% 7% 4% - branches 1% 10% 10% 9%
Sources: Gizycki and Lowe [98]; Donovan and Gorajek [75].
Prior to 1980, while 60 percent of owner-occupier housing finance commitments were held
by banks, building societies held a further 25 percent (see Figure2.1) and were offering
larger average loan sizes relative to banks.13 During the 1980s, with the introduction of
foreign banks into the market, banks became even more dominant. By 1996, mortgage
managers took over part of the market share previously held by building societies and
12The four major banks, in alphabetical order, are as follows: Australian and New Zealand Banking
Group Limited (ANZ), Commonwealth Bank of Australia (CBA), National Australia Bank (NAB), and Westpac Bank Corporation (WBC).
13
Chapter 2. The Australian Mortgage Market 13
credit unions. As already shown in Figure 2.1, the non-banking sector composition
changed; prior to 1996, building societies provided the majority of loans originated in
this sector but were overtaken by wholesale lenders thereafter. Many building societies
and credit unions became banks or merged with banks; thus, by mid-1990s, the domestic
banking system provided 92 percent of the residential housing credit. Wholesale lenders
also captured some bank-originated loans by offering, on average, larger mortgages than
banks did.
By the early twenty-first century, while major banks approved around 60 percent of
owner-occupier home loans, smaller banks held around 20 percent of residential home
loan approvals; credit unions and building societies had less than 10 percent of the
market share, and wholesale mortgage originators had a little bit over 10 percent; see
Davies [60].
Mortgage managers have been in the market since the 1960s, holding only around 1
percent of total loan approvals until 1992.14 Around 1995, their participation in the
market grew to holding between 8-10 percent of new housing loans; see Edey and Gray
[81]. A likely reason for the increasing share of the mortgage market appropriated
by wholesale mortgage originators and mortgage brokers post-1996 – in particular, their
rising share of refinanced mortgages – was the lower level of interest rates in the wholesale
money market (their main source of funds) after the high inflation/high interest rate
period. Lower inflation and the development of markets for securitized assets facilitated
their funding activities. They were able to offer, on average, larger loans accompanied
by lower lending rates – see Figure 2.2 – and to introduce low-documentation loans,
interest-only loans, and revolving credit lines.
The participation of wholesale mortgage originators in the market was enhanced not
only with technological advances but also, in particular, with the growth of the
resi-dential mortgage-backed securities (RMBS) market, which provided a relatively cheap
funding source. State governments in Australia developed the first MBS programs in the
mid-1980s to finance loans to low-income households. The RMBS15 market developed
14
See RBA, ‘Box 5: Competition in Housing Finance’, Reserve Bank of Australia Bulletin, Semi-Annual Statement on Monetary Policy, May 1997, Graph 3, http://www.rba.gov.au/publications/ smp/boxes/1997/may/5.pdf.
15Australian RMBS are prime loans covered by mortgage insurance and excess spreads; see RBA,
‘The Performances of Australian Residential Mortgage-backed Securities’, Reserve Bank of Australia
Financial Stability Review, March, 63-68, 2006,http://www.rba.gov.au/publications/fsr/2006/mar/
Chapter 2. The Australian Mortgage Market 14
Figure 2.2: Standard Variable Interest Rates
further with the growth of wholesale mortgage managers. The Australian securitization
market expanded rapidly between the mid-1990s and the recent financial crisis, reaching
up to 7 percent of the total assets in the financial system by mid-2007. During this
period, 23 percent of outstanding housing loans had been securitized; see Davies [60].
Securitizing some part of on-balance sheet residential mortgage loans also helped ADIs
to manage credit risk, release capital, and manage shareholder return to investment.
However, the share of securitization in the funding composition of ADIs was always
be-low 8 percent. The secondary market played an important role in mortgage funding for
wholesale mortgage originators and, to a lesser degree, for small ADIs.
The major banks sourced most of their funding from deposits – see Table 2.2, but the
expansion of household demand for credit and the reduction in the growth of deposits
forced financial institutions to increasingly rely on wholesale markets for funding, mainly
by issuing debt securities to non-residents. The share of the banking system’s total
liabilities owned by non-residents rose from below 10 percent in 1990 to over 25 percent
in 2007; see Figure 2.3.
The first panel in Table2.2presents total deposits as a share of total resident assets for
the four major banks and for some smaller domestic banks.16 Major banks funded over
40 percent of resident assets with deposits; smaller banks relied more on deposits as a
16
Chapter 2. The Australian Mortgage Market 15
Figure 2.3: Banks’ Liabilities (% of Total Liabilities, value)
source of funding. The second panel displays the proportion of household deposits held
by banks. One third of major banks’ deposits were household deposits – except for the
CBA. Table2.3shows the proportion of securitized assets held by banks relative to total
resident assets. As evidenced in the table, securitized assets represent a marginal share
of the major banks’ resident assets; however, that is not the case for regional banks.
Deans and Stewart [64] show that between the years 2000 and 2005, banks sourced 45
percent of their funding from domestic deposits, 30 percent from short-term wholesale
debt, and 15 percent from long-term wholesale debt. Regional banks, small credit unions,
and building societies relied mainly on deposits, but had been active in sourcing their
funding from the securitization market.
A narrowing in the spread between the standard variable housing loan interest rate
and the RBA cash rate – together with decreasing profit margins of banks and the
proliferation of new mortgage products – suggests evidence of increased competition in
the housing mortgage market. As shown in Figure2.4, the spread between the standard
variable home loan interest rate and the cash rate fell from over 400 basis points in
1993-1994 to 180 basis points between 1997 and 2008 (prior to the GFC). In addition,
Chapter 2. The Australian Mortgage Market 16
Table 2.2: Assets and Liabilities of Some ADIs.
Deposit-to-resident assets ratio 2002 2005 2007 2009 2012
ANZ 49.5% 49.6% 49.1% 54.2% 60.5%
CBA 64.1% 55.4% 52.9% 56.9% 58.8%
NAB 43.0% 45.2% 41.6% 49.5% 53.7%
WBC 53.6% 54.7% 55.7% 52.7% 52.6%
Adelaide Bank 87.2% 81.5% 75.6% (a) (a)
Bank of Queensland 80.6% 74.4% 78.0% 79.7% 80.2%
Bendigo Bank 78.5% 78.1% 78.2% 77.3% 85.7%
Macquarie Bank 37.8% 31.3% 30.1% 35.4% 67.7%
St. George Bank 69.6% 63.8% 64.2% 53.3% (b)
Suncorp 56.7% 60.4% 55.8% 41.4% 63.7%
Percent of deposits from households 2002 2005 2007 2009 2012
ANZ 34.4% 29.2% 27.2% 31.9% 33.2%
CBA 53.4% 57.0% 52.7% 45.3% 43.5%
NAB 33.6% 32.0% 33.0% 29.6% 30.6%
WBC 36.2% 33.3% 31.1% 29.4% 39.5%
Adelaide Bank 43.0% 31.8% 28.2% (a) (a)
Bank of Queensland 39.0% 48.5% 54.4% 61.4% 55.0%
Bendigo Bank 63.5% 58.3% 56.8% 54.0% 47.3%
Macquarie Bank 4.8% 6.0% 2.8% 13.2% 20.8%
St. George Bank 55.6% 55.2% 49.7% 57.3% (b)
Suncorp 39.9% 41.1% 36.0% 43.6% 41.9%
Source: APRA.
(a) In November 2007, Adelaide Bank merged with Bendigo Bank, forming Bendigo and Adelaide Bank Limited.
(b) In November 2008, St. George Bank and its branch, Bank of South Australia, became part of the Westpac Group (WBC). In 2011, WBC announced the relaunch of its subsidiary Bank of Melbourne, which replaced St. George Bank in Victoria.
net interest margins17had been falling between 1996 and 2007, from above 4 percent to
just above 2 percent for major banks, and from 3 percent to under 2 percent for smaller
banks; see Deans and Stewart [64].
2.2.2 Australian demand for housing credit - pre-GFC
Home ownership in Australia has been around 70 percent for more than two decades;18
25 percent of Australians are renters, and 5 percent live in public housing arrangements.
17
The net interest margins are calculated as the difference between the interest income generated by a financial institution and the amount of interest paid out to their lenders, relative to the interest-earning assets.
Chapter 2. The Australian Mortgage Market 17
Table 2.3: Securitized Assets of Some ADIs.
Securitized assets-to-resident assets 2002(c) 2005(c) 2007(d) 2009(d) 2012(d)
ANZ 1.7% 1.0% 0.4% 0.1% 0.0%
CBA 4.0% 5.3% 7.2% 1.7% 0.7%
NAB 0.6% 0.9% 1.9% 0.5% 0.1%
WBC 2.8% 1.4% 2.8% 0.9% 1.1%
Adelaide Bank 41.9% 49.2% 47.7% (a) (a)
Bank of Queensland 18.9% 21.6% 25.4% 18.2% 7.6%
Bendigo Bank 12.4% 3.7% 2.4% 15.6% 13.6%
Macquarie Bank 37.2% 57.0% 46.8% 27.3% 14.1%
St. George Bank 10.0% 15.6% 21.0% 9.2% (b)
Suncorp 1.9% 9.7% 14.6% 6.5% 4.3%
Source: APRA.
(a) In November 2007, Adelaide Bank merged with Bendigo Bank, forming Bendigo and Adelaide Bank Limited.
(b) In November 2008, St. George Bank, and its branch Bank of South Australia, became part of Westpac Group (WBC). In 2011 WBC announced the relaunch of its subsidiary Bank of Melbourne, which replaced St. George Bank in Victoria.
Chapter 2. The Australian Mortgage Market 18
Half of homeowners hold a mortgage. Housing debt accounts for three quarters of
the personal sector borrowings,19 and at any one time, approximately one third of the
housing stock is financed by a mortgage.
Australia has experienced a period of exceptional expansion over the past twenty years.
There have been no recessions since 1990-1992, inflation has remained low and stable
along with nominal interest rates, and unemployment fell from 11 percent in 1993 to
4.3 percent in 2006.20 Over the same period, household assets relative to disposable
income increased from 500 percent to 760 percent; see the left panel of Figure 2.5. In
the two decades prior to 2007, the household debt-to-income ratio increased from below
50 percent to around 150 percent, and has since stabilized at that value; see the right
panel of Figure2.5. Most of the household debt accumulation was housing debt. More
precisely, property debt accounted for 84 percent of all household debt in the mid-2000s.
During the same period, 60 percent of total household assets were held in residential
property; see Kohler and Rossiter [123].
Figure 2.5: Credit in Australia
Household income growth can explain part of the rise in debt and assets held on
house-hold balance sheets. Between 1980 and 1990, real net national disposable income grew
by 3.1 percent per annum on average, while between 2002 and 2011, it grew by 4.1
per-cent per annum on average.21 Households who experienced higher income were prepared
to increase their spending on housing. However, Fox and Finlay [89] report that
dur-ing this latter period, the dwelldur-ing price-to-income ratio had doubled, suggestdur-ing that
19
See Edey and Gray [81].
20See ABS, Labour Force, Australia, July 2013, 6202.0.
21
Chapter 2. The Australian Mortgage Market 19
the growth in income was not explaining all the increase in household balance sheet
accumulation.
The rise in household asset (and debt) accumulation was potentially due to increasing
valuation of assets such as housing and equities. Between 1980 and 1995, the average
annual real house price growth was 1.1 percent, but between 1995 and 2005 this average
annual growth rate was 6 percent; see Yates [191].22 As in other countries, housing prices
have risen faster than consumer prices; see Figure2.6. Australia’s nominal house prices
rose by 63 percent between 2003 and 2009. Bank lending for housing finance increased
by 85 percent (14.2 percent per annum) during the same period. Ellis [83] argues that as
a result of disinflation, deregulation, and financial innovation, the housing credit growth
resulted in an increase in housing demand, which in turn increased housing prices in
the face of a highly inelastic supply. Caldera S´anchez and Johansson [39] estimate the
long-run price-elasticity of new housing supply in Australia to be around 0.52. The rise
in house prices was channeled through an increase in construction costs, increase in the
price of existing dwellings, and mainly an increase in the price of land; it also reflects a
higher average quality of dwellings.23 At the same time, higher housing prices generated
a demand for greater housing credit in an environment of rising housing equity and low
interest rates. The RBA had noticed this vicious cycle and began increasing interest
rates as early as 2002, in an attempt to cool the housing market down and deflate a
potential housing bubble.24
Households increasingly invested in housing wealth, with little evidence of other
house-hold savings, with the net savings rate as low as -2 percent as a proportion of disposable
income during this period.25 Household savings have more often been oriented toward
managed funds than to bank deposits, as a consequence of compulsory superannuation
and tax incentives for voluntary contributions; see Connolly and Kohler [53].
Households’ greater willingness to take on debt can then be explained by rising house
prices simultaneously accompanied by the expansion of housing credit and the low and
22
According to Hansen [105],nominalhouse prices were growing on average at an 8 percent rate per annum between 1993 and 2005.
23
Hsieh et al. [113] and Kulish et al. [126] discuss supply side rigidity of housing in Australia.
24On the 8th May 2002, the RBA announced an increase in its cash rate on the basis of overheating of
the housing market, among other concerns; see RBA, ‘Statement by the Governor, Mr Ian Macfarlane: Monetary Policy’,http://www.rba.gov.au/media-releases/2002/mr-02-10.html.
25
Chapter 2. The Australian Mortgage Market 20
Figure 2.6: Home Price Indexes (Index, 2003-04 = 100) and Growth in Dwelling
Index
stable nominal interest rates environment - which reduced the initial real repayments
for standard mortgage loans and increased borrowing capacity, see Ellis [83]. Aggregate
household debt-to-gross assets rose from around 12 percent in 1995 to 25 percent in 2008.
The debt service-to-income ratio (DSR) rose from 7 percent to 13 percent between 1995
and 2007, although interest rates had been falling; see Figure2.7.
Figure 2.7: Australian Housing Debt
In addition, the Australian tax system provides incentives for households to make
lever-aged investments when asset prices are expected to increase, making owner-occupied
housing and, in particular, residential investment attractive. It gives property investors
incentives to participate in the housing market through the ‘negative gearing’ of related
expenses against other income.26 Since 1999, the capital gains tax for investors applies
to nominal gains at 50 percent of the capital gains at their marginal tax rate for housing
26
Chapter 2. The Australian Mortgage Market 21
assets held for at least a year. Investors can deduct the interest on mortgage payments
and other non-cash depreciation expenses from their taxable income. Owner-occupiers
have no mortgage interest deductibility but do not have to pay capital gains tax, and
imputed rent is non-taxable. State stamp duty tax was levied both on the value of a
purchased dwelling and on the mortgage contract, however mortgage duties have been
abolished in most states; see Dungey, Wells and Thompson [77]. Many state and
ter-ritory governments have provided stamp duty concessions to first-time home buyers to
facilitate the latter’s introduction to homeownership.
A number of other policy efforts have been implemented to promote homeownership.
The Australian government introduced the First Home Owner Grant (FHOG) in July
2000, initially to offset the introduction of the goods and services tax. Under this scheme,
first-time home buyers could access an AUD $7,000 cash grant when buying or building
a dwelling. This Federal grant was then supplemented by state and territory government
additional grants, and in some cases stamp duty concessions; for a review of first-time
home buyer government assistance in Australia, see Dungey et al. [77]. The FHOG
amount has varied over the years, giving preference to new buildings over existing ones,
particularly in less urbanized areas; see Figure2.8.
Figure 2.8: First-time Home Buyers in Australia
The proportion of dwellings financed for first-time home buyers was around 22 percent
between the beginning of the 1990s until the end of 2002, as shown in Figure 2.8.
Wood et al. [188] suggest that the major contribution of the FHOG was that it relaxed
Chapter 2. The Australian Mortgage Market 22
lenders who relaxed borrower savings requirements, allowing part of the deposit to be
the FHOG.27
However, existing homeowners constituted the main actors in the lending boom in
Aus-tralia. These borrowers purchased higher valued properties with larger loans or became
residential investors following the incentives given by the rise in house prices and the
tax system. Most of them were aged in their 40s and had low levels of debt and a
strong capacity to service new debt; see Yates [192]. In fact, the RBA reports that the
arrears rate in Australia for banks’ non-performing housing loans has remained under
0.5 percent since the mid-1990s.28 At the end of March 2007, only 0.38 percent of banks’
housing loans were not performing, and by the end of April of the same year, the 90-day
arrears rate on securitized housing loans represented around 0.47 percent of outstanding
loans; see Davies [60].29
Rising dwelling prices and the negative gearing incentives provided by the tax system
led to growth in bank lending to investors at an annual rate of 21 percent in the 1990s,
compared to 13.5 percent for lending to owner-occupiers.30 Around the mid-1990s, the
spread between the interest rates charged on investor loans and owner-occupier loans
practically disappeared. A sizable share of financing products taken by investors has
been interest-only loans. Table2.4shows housing loans for owner occupiers and investors
as a proportion of total ADI loans to households during the last decade. Major banks
oriented around 40 percent of their loans to households on residential housing, and 20
percent on investment housing. Smaller banks followed a similar pattern.
Overall, during the two decades prior to the GFC, Australian households and investors
increased their housing credit demand as a consequence of deregulation (along with
competition between lenders, and greater access to credit and new products), a stable
27
LMI credit parameters normally require the borrower to have at least 3-5 percent genuine equity to contribute toward the purchase, as evidence of genuine saving capabilities. In 2000, LMI companies agreed to recognize the FHOG as genuine equity for the purposes of their credit parameters.
28
See RBA, ‘Box B: Measurement of Housing Arrears’, Reserve Bank of Australia Financial Stability Review, September 2009,http://www.rba.gov.au/publications/fsr/boxes/2009/sep/b.pdf.
29
See also the House of Representatives Standing Committe on Economics, Finance and Pub-lic Administration, ‘Joint RBA-APRA Submission to the Inquiry into Home Lending Practices and Processes’, 8 August 2007,http://www.rba.gov.au/publications/submissions/inquiry-home-lend/ pdf/inquiry-home-lend.pdf. In Australia, housing loans are defined as non-performing if they are either ‘past due’ (repayments are at least 90 days past due, but the loan is well covered by collateral) or ‘impaired’ (at least 90 days past due or not in arrears but otherwise doubtful, and the loan is not well covered by collateral).
30
See RBA, ‘Recent Developments in Housing: Prices, Finance and Investor Attitudes’, Reserve
Bank of Australia Bulletin, July 2002, http://www.rba.gov.au/publications/bulletin/2002/jul/
Chapter 2. The Australian Mortgage Market 23
Table 2.4: Loans to Households for Some ADIs.
Housing loans to owner-occupiers 2002 2005 2007 2009 2012
ANZ 38.7% 39.9% 40.8% 40.1% 43.1%
CBA 43.7% 44.4% 42.1% 47.1% 47.2%
NAB 31.9% 35.8% 34.2% 34.7% 39.0%
WBC 46.8% 41.2% 38.3% 35.1% 41.5%
Adelaide Bank 54.7% 50.2% 47.2% (a) (a)
Bank of Queensland 55.7% 45.5% 41.5% 42.3% 43.5%
Bendigo Bank 42.6% 40.2% 37.9% 43.2% 41.8%
Macquarie Bank 4.1% 3.5% 5.6% 8.6% 19.9%
St. George Bank 51.4% 49.5% 51.1% 51.3% (b)
Suncorp 43.1% 36.0% 30.8% 32.5% 49.9%
Housing loans to investors 2002 2005 2007 2009 2012
ANZ 16.5% 18.0% 17.1% 15.8% 16.4%
CBA 18.0% 24.6% 22.6% 21.8% 22.0%
NAB 17.1% 21.5% 20.2% 18.6% 15.8%
WBC 21.2% 21.1% 19.5% 25.6% 29.7%
Adelaide Bank 22.1% 30.9% 32.4% (a) (a)
Bank of Queensland 3.2% 21.1% 27.8% 31.5% 36.0%
Bendigo Bank 16.1% 15.4% 16.2% 22.0% 25.8%
Macquarie Bank 3.2% 3.2% 5.2% 5.5% 13.0%
St. George Bank 19.8% 23.5% 22.0% 29.0% (b)
Suncorp 12.3% 15.1% 15.2% 16.5% 19.5%
Source: APRA.
(a) In November 2007, Adelaide Bank merged with Bendigo Bank, forming Bendigo and Adelaide Bank Limited.
(b) In November 2008, St. George Bank, and its branch Bank of South Australia, became part of Westpac Group (WBC). In 2011, WBC announced the relaunch of its subsidiary Bank of Melbourne, which replaced St. George Bank in Victoria.
economic environment (reflected in low inflation and low nominal interest rates, low
unemployment, and rising incomes and wealth accompanied by rising house price
ex-pectations), attractive taxation arrangements, and, arguably, national housing policies.
However, there has been no sign of deterioration in credit quality during this period.
2.3
The Australian mortgage market: The impact of the
GFC
Australia avoided a recession following the GFC, an outcome often attributed to a strong