Attitudes and behaviour towards food attributes and
organic food – a triangular methodological investigation of
occasional organic consumers
HANNA STOLZ
Dissertation at the University of Kassel
Year of publication: 2011
Author: Hanna Stolz
Dissertation an der Universität Kassel
Fachbereich Ökologische Agrarwissenschaften
Dissertation zur Erlangung des akademischen Grades eines Doktors der Agrarwissenschaften (Dr. agr.)
Declaration of originality
This PhD thesis contains a collection of papers that have been submitted to different peer-reviewed journals as follows:
Chapter 4 contains paper 1, which was published in German language by the peer-reviewed journal ‘Berichte über Landwirtschaft’ as Stolz, H., Bodini, A., Stolze, M., Hamm, U. and Richter, T. (2009) Lebensmittelqualität aus der Verbraucherperspektive – eine Synthese qualitativer Studien zur Wahrnehmung und Beurteilung verschiedener Qualitätskriterien bei Öko-Produkten. Berichte über Landwirtschaft 87, 153-182.
Chapter 5 includes paper 2, which has been submitted as Stolz, H., Janssen, M., Hamm, U. and Stolze, M. Preferences and determinants for organic, conventional and conventional-plus products – the case of occasional organic consumers. The paper has been accepted with major revisions, revised, and resubmitted to the peer-reviewed journal ‘Food Quality and Preference’ on May 26, 2011.
Chapter 6 contains paper 3, which was submitted to the peer-reviewed journal ‘Wageningen Journal of Life Science’. The paper has been accepted for publication in October 2010 as Stolz H., Stolze, M., Hamm, U., Janssen, M. and Ruto, E. (2010) Consumer attitudes towards organic versus conventional food with specific quality attributes. Wageningen Journal of Life Science, doi:10.1016/j.njas.2010.10.002.
4). The data collection and a first analysis for the second study was conducted by Antonella Bodini and Toralf Richter at the Research Institute of Organic Agriculture, Switzerland (study 2-CH, chapter 4). The synthesis of the three studies and paper writing was done on my own, while the co-authors Antonella Bodini, Toralf Richter, Ulrich Hamm and Matthias Stolze provided feedback on the paper.
Papers 2 and 3, which are presented in chapters 5 and 6, contain the results of a quantitative empirical study, which was also part of the European Commission funded project QLIF. I developed the design of the quantitative study. The data collection in Germany was accomplished by the project partner and co-author Meike Janssen, while the data collection in Switzerland was done by me. I conducted the data analysis over the two countries and wrote papers 2 and 3. The project partners and co-authors Matthias Stolze, Ulrich Hamm and Meike Janssen provided feedback on paper 2. The project partners and co-authors Matthias Stolze, Eric Ruto, Ulrich Hamm and Meike Janssen provided feedback on paper 3.
I declare that I prepared the present dissertation on my own. Information derived from the published and unpublished work of others has been acknowledged in the text and a list of references is given. This PhD thesis has not been previously presented at any university or other institute of tertiary education or published elsewhere.
Contents
LIST OF TABLES ... VIII
LIST OF FIGURES ... IX
LIST OF ABBREVIATIONS ... IX
1 INTRODUCTION AND PROBLEM STATEMENT ... 1
1.1 RESEARCH QUESTIONS AND OBJECTIVES ... 2
1.2 PROCEDURE ... 3
2 THEORETICAL FRAMEWORK ... 4
2.1 ECONOMIC THEORIES ... 5
2.1.1 Overview of economic theories ... 5
2.1.2 Random Utility Theory ... 8
2.2 PSYCHOLOGICAL THEORIES ... 9
2.2.1 Overview of psychological theories ... 9
2.2.2 Neobehaviouristic Theory and Stimuli-Intervention-Response models ... 10
2.3 CLASSIFICATION OF MODELS ... 13
3 METHODOLOGY ... 14
3.1 DATA COLLECTION ... 15
3.1.1 Qualitative data collection methods ... 16
3.1.2 Quantitative data collection methods ... 19
3.2 DATA ANALYSIS ... 24
3.2.1 Qualitative data analysis methods ... 24
3.2.2 Quantitative data analysis methods ... 29
4 FOOD QUALITY FROM THE CONSUMER PERSPECTIVE – A SYNTHESIS OF QUALITATIVE STUDIES OF CONSUMER PERCEPTIONS AND EVALUATION OF VARIOUS QUALITY CRITERIA FOR ORGANIC PRODUCTS ... 35
4.1 ABSTRACT ... 35
4.2 INTRODUCTION ... 37
4.3 DATA COLLECTION ... 39
4.3.1 Focus group discussion ... 39
4.3.2 Design of the individual studies ... 40
4.4 DATA ANALYSIS ... 44
4.4.1 Qualitative content analysis ... 44
4.4.2 Cross-case comparison analysis ... 46
4.5.2 Assessment of organic production ... 61
4.6 DISCUSSION OF RESULTS ... 65
4.7 CONCLUSIONS ... 69
4.7.1 For providers of organic food ... 69
4.7.2 For decision-makers in the field of agricultural policy ... 71
4.8 ACKNOWLEDGEMENTS ... 71
5 PREFERENCES AND DETERMINANTS FOR ORGANIC, CONVENTIONAL AND CONVENTIONAL-PLUS PRODUCTS – THE CASE OF OCCASIONAL ORGANIC CONSUMERS ... 72
5.1 ABSTRACT ... 72
5.2 INTRODUCTION ... 73
5.3 THEORETICAL FRAMEWORK ... 74
5.4 MATERIAL AND METHODS ... 76
5.4.1 Design of the purchase simulation ... 76
5.4.2 Data collection ... 77
5.4.3 Data analysis ... 78
5.5 RESULTS ... 79
5.5.1 Composition of the sample ... 79
5.5.2 Outcomes of the buying simulations ... 80
5.5.3 Attitude scales ... 82
5.5.4 Results of the multinomial logit models ... 84
5.6 DISCUSSION AND CONCLUSIONS ... 87
5.7 ACKNOWLEDGEMENTS ... 89
6 CONSUMER ATTITUDES TOWARDS ORGANIC VERSUS CONVENTIONAL FOOD WITH SPECIFIC QUALITY ATTRIBUTES ... 90
6.1 ABSTRACT ... 90
6.2 INTRODUCTION ... 91
6.3 THEORETICAL FRAMEWORK ... 93
6.4 MATERIALS AND METHODS ... 94
6.4.1 Design ... 94
6.4.2 Data collection ... 96
6.5 RESULTS ... 97
6.5.1 Sample ... 97
6.5.2 Consumer attitudes relating to food quality ... 97
6.6 DISCUSSION ... 101
6.7 ACKNOWLEDGEMENTS ... 102
7 SYNTHESIS ... 103
7.1 SYNTHESIS OF THE RESULTS ... 103
7.1.1 Results related to objective 1 and associated research questions ... 103
7.1.2 Results related to objective 2 and associated research questions ... 105
7.1.3 Results related to objective 3 and associated research question ... 106
7.1.4 Results related to objective 4 and associated research questions ... 107
7.2 REFLECTION ON THE THEORETICAL FRAMEWORK ... 108
7.3 REFLECTION ON THE METHODOLOGICAL APPROACH ... 109
8 CONCLUSIONS AND RECOMMENDATIONS ... 111
8.1 CONCLUSIONS ... 112
8.2 RECOMMENDATIONS FOR PROVIDERS OF ORGANIC FOOD ... 113
8.2.1 Communication strategy ... 113
8.2.2 Product mix strategy ... 115
8.3 RECOMMENDATIONS FOR DECISION-MAKERS IN THE FIELD OF AGRICULTURAL POLICY ... 116
8.4 RECOMMENDATIONS FOR FURTHER RESEARCH ... 116
SUMMARY ... 118
ZUSAMMENFASSUNG ... 120
ACKNOWLEDGEMENTS ... 124
REFERENCES ... 125
APPENDIX ... 137
APPENDIX I:FOCUS GROUP DISCUSSION GUIDELINES OF STUDY 1-DE PRESENTED IN CHAPTER 4 ... 137
APPENDIX II:FOCUS GROUP DISCUSSION GUIDELINES OF STUDY 2-DE AND 2-CH PRESENTED IN CHAPTER 4 ... 142
LIST OF TABLES
TABLE 1:OVERVIEW OF MAIN CHARACTERISTICS OF QUALITATIVE AND QUANTITATIVE
METHODS ... 15
TABLE 2:QUALITATIVE CONTENT ANALYSIS ... 26
TABLE 3:OVERVIEW OF QUALITATIVE CONTENT ANALYSIS TECHNIQUES ... 27
TABLE 4:CROSS-CASE COMPARISON ANALYSIS ... 28
TABLE 5:EXPLORATORY FACTOR ANALYSIS ... 30
TABLE 6:MULTINOMIAL LOGIT MODEL ... 33
TABLE 7:LATENT CLASS MODEL ... 34
TABLE 8:DESIGN AND CONTENT OF THE FOCUS GROUP DISCUSSIONS... 43
TABLE 9:RELEVANCE OF INGREDIENTS SUMMARISED BY COUNTRY AND PRODUCT ... 47
TABLE 10:RELEVANCE OF INDIVIDUAL ADDITIVES SUMMARISED BY COUNTRY AND PRODUCT . 48 TABLE 11:RELEVANCE OF SENSORY PROPERTIES SUMMARISED BY COUNTRY AND PRODUCT ... 51
TABLE 12:RELEVANCE OF INDIVIDUAL ASPECTS OF PRODUCTION AND PROCESSING SUMMARISED BY COUNTRY AND PRODUCT ... 54
TABLE 13:RELEVANCE OF GEOGRAPHICAL ORIGIN SUMMARISED BY COUNTRY AND PRODUCT . 58 TABLE 14:RELEVANCE OF PRICE AND PRICE-PERFORMANCE RATIO SUMMARISED BY COUNTRY AND PRODUCT ... 60
TABLE 15:ASSESSMENT OF THE ORGANIC PRODUCTS IN TERMS OF INDIVIDUAL CRITERIA ... 61
TABLE 16:CHARACTERISTICS OF THE SAMPLES IN SWITZERLAND AND GERMANY AND OTHER CHARACTERISTICS ... 80
TABLE 17:SHARES OF PRODUCT ALTERNATIVES CHOSEN IN THE BUYING SIMULATIONS IN SWITZERLAND AND GERMANY ... 81
TABLE 18:COMPARISON OF ALTERNATIVES CHOSEN AND STATED USUAL PREFERENCES ... 82
TABLE 19:ATTITUDE SCALES AND CORRESPONDING ITEMS ... 83
TABLE 20:MULTINOMIAL LOGIT MODELS FOR MILK, FRUIT YOGHURT AND APPLES IN GERMANY WITH PARAMETERS OF THE EXPLANATORY VARIABLES (BASE CATEGORY: CONVENTIONAL ALTERNATIVE) ... 84
TABLE 21:MULTINOMIAL LOGIT MODELS FOR MILK, FRUIT YOGHURT AND APPLES IN SWITZERLAND WITH PARAMETERS OF THE EXPLANATORY VARIABLES (BASE CATEGORY: CONVENTIONAL ALTERNATIVE) ... 86
TABLE 22:ATTITUDINAL FACTORS RELATED TO FOOD PRODUCTION AND QUALITY ... 97
LIST OF FIGURES
FIGURE 1:THE STIMULI-INTERVENTION-RESPONSE-MODEL ... 11 FIGURE 2:TRIANGULAR METHODOLOGICAL APPROACH ... 23
LIST OF ABBREVIATIONS
BIC Bayesian information criterion cf. confer (compare)
CH Switzerland
DE Germany
EC European Commission
EU European Union
EUR Euros
€ Euros
IIA independence of irrelevant alternatives I intervention
IP integrated production LCM latent class model
LL log-likelihood
MNLM multinomial logit model n number of observations n.a. not assessed
% percent
p probability value
PhD philosophiae doctor (Doctor of Philosophy) POS point of sale
QLIF Improving quality and reduction of costs in the European organic and low-input food supply chains (Acronym for an EU research project)
regression coefficient (parameter) R response
RUT Random Utility Theory
S-I-R Stimuli-Intervention-Response S stimuli
1 INTRODUCTION AND PROBLEM STATEMENT
The European organic market has grown continuously during the past two decades and has experienced average annual growth rates of more than 10 % since 2005 (Willer, 2010; Padel et al., 2009; Padel et al., 2008; Willer and Yussefi, 2007). Germany was the country with the largest organic market turnover in Europe in 2009 at 5800 million EUR, followed by France at 3041 million EUR, and the UK at 2065 million EUR (Schaack et al., 2011). The highest market shares of organic products of approximately five % were found in Denmark, Austria and Switzerland (Schaack et al., 2011). Food scandals at the beginning of this millennium in particular, and a growing consumer awareness of sustainable food production and consumption have led to an increase in consumer demand for organic food (Zanoli et al., 2004).
With the continuous market growth, the organic market has left its niche existence since organic food is increasingly sold in conventional retail outlets (BÖLW, 2010). There, organic products are offered alongside with various other types of products and compete mainly with conventional and the so-called conventional-plus products. The latter are conventional products displaying particular quality attributes on the product packaging, such as ‘no artificial additives’, or ‘from animal welfare husbandry’. Often, these quality attributes also apply to organic products. Occasional organic consumers might prefer such conventional-plus alternatives that are perceived to be ‘between’ organic and conventional products. This is expected because this consumer group holds a certain awareness of food production and processing while being less committed either to organic or to conventional food. Furthermore, conventional-plus products are often cheaper than organic products and therefore might attract the attention of this consumer group.
conventional and plus products. It is important to analyse whether conventional-plus products are more preferred than organic products and to examine the price impact on occasional organic consumers’ buying behaviour since conventional-plus products are often cheaper than organic products and therefore might be preferred.
1.1 Research questions and objectives
Against this background, the overall objective of this PhD thesis is to provide information about the segment of occasional organic consumers. In particular, the thesis focuses on consumers’ perceptions and attitudes towards the quality of, and preferences for, organic, conventional and conventional-plus products in two countries: Germany and Switzerland. In the following, an overview of the objectives and corresponding research questions of this PhD thesis is provided.
Objective 1: Exploration of occasional organic consumers’ perceptions and attitudes towards various quality criteria for organic products.
Research question 1.1: Which product- and country-specific quality criteria are important when evaluating food?
Research question 1.2: How do consumers assess organic production compared to conventional production?
Objective 2: Analysis of occasional organic consumers’ buying behaviour towards organic, conventional and conventional-plus products.
Research question 2.1: Which alternatives are preferred in a choice situation? What is the share of the ‘in-between’ conventional-plus products?
Research question 2.2: Are conventional-plus products preferred by consumers who choose organic quality products in everyday-life more than by consumers who choose conventional products in everyday-life?
Research question 2.3: What is the impact of varying price levels for organic, conventional and conventional-plus products on occasional organic consumers’ buying behaviour? Objective 3: Identification of determinants that explain occasional organic consumers’
preferences for organic, conventional-plus and conventional products. Research question 3: Which variables determine consumers’ preferences for
Objective 4: Investigation of preference heterogeneity among occasional organic consumers regarding organic, conventional and conventional-plus products.
Research question 4.1: Are there different segments within the group of occasional organic consumers?
Research question 4.2: If so, what distinguishes consumers in different segments from each other?
The findings and conclusions are addressed to providers of organic food and will contribute to increasing the knowledge about the target group of occasional organic consumers. In addition, this thesis aims to support providers of organic food in developing marketing strategies targeted to occasional organic consumers’ demand. Furthermore, the findings and conclusions are dedicated to decision-makers in the field of agricultural policy and will contribute to developing adequate policy instruments to support organic farming.
1.2 Procedure
A triangular methodological approach was chosen to achieve the objectives of this PhD thesis. To realise objective 1 (cf. chapter 1.1), qualitative studies were conducted to explore occasional organic consumers’ perceptions of, and attitudes towards, various quality criteria for organic products. The studies are presented in paper 1 (cf. chapter 4). To achieve objectives 2, 3 and 4 (cf. chapter 1.1), a quantitative study was conducted. The quantitative study was a combination of a choice experiment (buying simulation) and a quantitative survey. The quantitative study was aimed at investigating occasional organic consumers’ preferences and buying behaviour towards organic, conventional and conventional-plus products (objective 2). In addition, the quantitative study was aimed at identifying determinants of the observed buying behaviour (objective 3) and to segment occasional organic consumers according to their preferences for organic, conventional and conventional-plus products (objective 4). The quantitative research is presented in papers 2 and 3 (cf. chapter 5 and chapter 6).
evolution of consumers’ buying behaviour. In particular, the project focussed on consumers’ expectations, perceptions and actual buying behaviour towards different production systems to enable such farming systems to be developed ‘in tune’ with consumers’ expectations. This PhD thesis is structured as follows: after this introduction, the theoretical framework of the thesis is included in chapter 2. In chapter 3, the data collection and analysis methods are presented. Subsequently, the qualitative study presented in paper 1 is provided in chapter 4. The quantitative study presented in the papers 2 and 3 is included in chapters 5 and 6 respectively. Chapter 7 includes a synthesis of the results as well as reflection on the theoretical framework and the methodological approach. The PhD thesis closes in chapter 8 with conclusions and recommendations for providers of organic products and decision-makers in the field of agricultural policy as well as with recommendations for further research.
2 THEORETICAL
FRAMEWORK
The quantitative study, which was conducted to investigate occasional organic consumers’ buying behaviour, was based on a behavioural theoretical framework: the Random Utility Theory (RUT), extended by elements of Stimuli-Intervention-Response (S-I-R) models derived from Neobehaviouristic Theory. In contrast, the qualitative research that was conducted as an exploration was not theory-based. Since explorations – such as the exploration conducted within this thesis – are aimed at identifying a priori unknown structures or processes, they are usually not based on prior assumptions (Decker and Wagner, 2002). To illustrate how the RUT and S-I-R models were chosen, an overview of behavioural theories is provided, which were developed in the fields of economics, psychology and sociology. In this overview, the focus is on the economic and psychological theories in chapters 2.1 and 2.2 respectively. Sociological theories, in contrast, are not considered in this overview. The reason is that sociological theories emphasise social aspects of behaviour (Foscht and Swoboda, 2007), and particularly:
Characteristics of society,
Causes of social progress or stagnation, and
Given the strong focus on society and societal structures and phenomena, sociological theories were less suitable to serve as the framework for the research on consumer behaviour. After the overview of economic and psychological theories, a classification of models is provided in chapter 2.3 since in this PhD thesis, several models were considered and applied.
2.1 Economic theories
Economic theories are mathematical approaches (Ben-Akiva and Lerman, 1985), which either belong to macroeconomics or microeconomics. Microeconomic theories focus on economic decisions of individuals, while macroeconomic theories refer to the aggregated behaviour of communities (Schumann et al., 1999). The following overview focuses on microeconomic theories because the aim within this thesis was to investigate the behaviour of individuals (consumers) rather than the behaviour of communities. Furthermore, the overview is focussed on neoclassical economics, since it is the dominant paradigm in economics (Novy, 2005).
2.1.1 Overview of economic theories
Koutsoyiannis (1979) distinguishes between three major groups of economic theories: Theory of Demand,
Theory of Production, and Theory of Costs.
Theory of Demand is underpinned by the following assumptions (Ben-Akiva and Lerman, 1985; Koutsoyiannis, 1979):
Assumption of rationality: a consumer performs ‘a consistent and calculated decision process in which the individual follows his or her own objectives […]’ (Ben-Akiva and Lerman, 1985),
Assumption of complete information: a consumer has complete information on all products, and
Assumption of utility maximisation: a consumer attempts to achieve the highest possible utility from a buying decision.
As the Theory of Demand attempts to explain consumer behaviour (or demand) with determinants, such as price, consumer income, etc., it was a suitable approach to meet objectives 2, 3 and 4 of this thesis (cf. chapter 1.1). Furthermore, given that the aim was to investigate consumer behaviour quantitatively (cf. chapter 3.1.2), a mathematical theoretical framework was chosen.
However, to investigate consumer behaviour towards different types of products, another important precondition for the theoretical framework was its suitability to explain discrete choices between different product alternatives (organic, conventional and conventional-plus products). Therefore, a Discrete Choice Theory (Ben-Akiva and Lerman, 1985) was chosen from among the Theories of Demand as the suitable theoretical framework. Discrete Choice Theories are distinguished according to the underlying decision rule:
Dominance, Satisfaction,
Lexicographic rules, and
Utility (Ben-Akiva and Lerman, 1985).
Utility Theory, which is based on the decision rule of utility,
‘[…] is most extensively used in the predictive models of discrete choice behaviour’ (Ben-Akiva and Lerman, 1985).
for decision-making (Ben-Akiva and Lerman, 1985). Due to this strength, Utility Theory was chosen as the theoretical framework for this thesis.
An important step in developing Utility Theory was achieved by Lancaster (1966) who defined utility in terms of the attributes of the commodities. According to Lancaster,
‘the chief technical novelty (of this extension) lies in breaking away from the traditional approach that goods are the direct objects of utility and, instead, supposing that it is the properties or characteristics of the goods from which utility is derived’ (Lancaster, 1966).
This development allowed the investigation of the relationships between products and their attributes. However, a weakness of Utility Theory was the unsolved discrepancy between the observed behaviour and the behaviour predicted by the utility function (Ben-Akiva and Lerman, 1985). This gap was closed by the development of the Random Utility Theory (RUT). The theory accounts for such discrepancies between observed and predicted behaviour by including a random component in the utility function as defined by Manski in 1977 (Ben-Akiva and Lerman, 1985).
determinants could be considered, which led to a certain amount of not determinable (random) behaviour.
2.1.2 Random Utility Theory
According to the Random Utility Theory, individuals are assumed to prefer the alternative with the highest perceived utility. Hence, a consumer n will choose alternative i from a set of j product alternatives only if this alternative has the highest perceived utility Uni.
The probability Pni that a consumer will choose the product alternative i from a choice set J
(in this thesis a choice set of three alternatives: organic, conventional and conventional-plus) is:
ni ni PUP >P
Unj for all j iUtility Uni is split into two portions, a systematic portion Vni and a random component ni,
which captures unobserved variation: Uni = Vni + ni.
The systematic and measurable portion of the utility function Vni is generated by measurable
2.2 Psychological theories
2.2.1 Overview of psychological theories
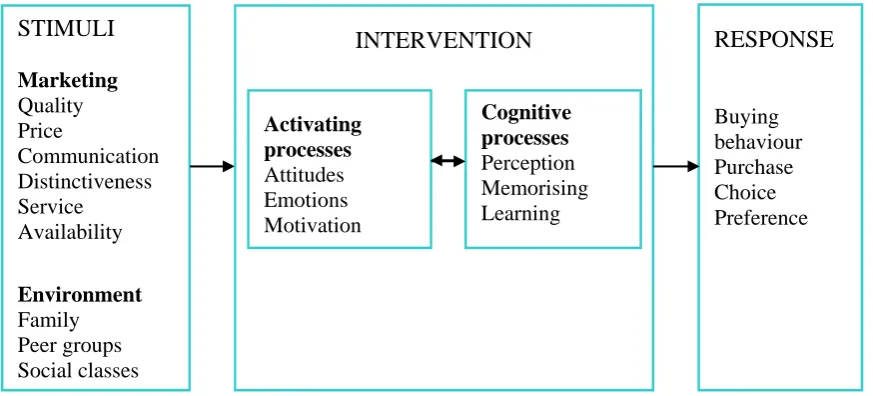
Psychological theories trace back to Behaviourism, which was established by Watson and other psychologists at the beginning of the twentieth century (Wozniak and College, 1997). According to Wozniak and College (1997), Behaviourism was one of the first psychological theories that aimed at objectively measuring the behaviour of humans and animals by scientific methods. Kroeber-Riel and Weinberg (2003) describe Behaviourism as an attempt to explain behaviour as a response (R) caused by external and directly measurable stimuli (S). However, S-R models of Behaviourism do not consider psychological processes within an individual and thus do not sufficiently explain complex decision-making processes (Foscht and Swoboda, 2007), such as buying behaviour. Neobehaviouristic Theory and the derived S-I-R models were introduced in the 1930s and closed this gap by focussing on psychological processes of intervention (I) (see Figure 1) in addition to stimuli and response (Kroeber-Riel and Weinberg, 2003). Apart from Neobehaviouristic Theory, five other main psychological theories are included in the overview given by Foscht and Swoboda (2007):
In-depth psychological approaches, Biological approaches,
Comparative behavioural approaches, Cognitive psychological approaches, and Social approaches.
and Swoboda, 2007). Extrapolation of animal behaviour to explain buying behaviour is not suitable for this study since there is little evidence that animals are capable of considering the trade-offs that are necessary for making rational buying decisions.
Cognitive approaches focus on cognition as a mental process (Brandimonte et al., 2006), and particularly focus on perception, memorising and learning processes as well as on knowledge (Foscht and Swoboda, 2007). In such mental processes, external or internal input is transformed, reduced, elaborated, stored, recovered, and used (Brandimonte et al., 2006). The mental processes are split into several stages of perception, evaluation and retaining of information (Foscht and Swoboda, 2007). Although cognitive approaches are highly suitable for explaining single steps of psychological processes in decision-making, their applicability in the context of the quantitative research of this thesis was limited, since neither the single steps and their linkages nor learning processes were within the main scope in this thesis.
In contrast, S-I-R models derived from Neobehaviouristic Theory feature the major components of a buying situation: the environment of the buying decision, the attributes of the products available, as well as the attributes of the decision-maker including the socio-demographic and psychological aspects described by Kroeber-Riel and Weinberg (2003) (cf. Figure 1). Due to these strengths, the approach was considered to be suitable for capturing the attributes of the products investigated in the thesis, which are the production system (organic, conventional and conventional-plus) and the price level, and thus to meet objective 2 (cf. chapter 1.1). Besides this, the approach addresses various potentially relevant determinants of buying behaviour (cf. chapter 2.2.2) and is thus suitable for achieving objective 3 (cf. chapter 1.1). Against this background, the Neobehaviouristic Theory and corresponding S-I-R models were chosen as an additional framework to extend the RUT by including a set of potentially relevant determinants and aspects of buying behaviour.
2.2.2 Neobehaviouristic Theory and Stimuli-Intervention-Response models
measurable stimuli. In contrast, the psychological processes within the organism are only indirectly measurable by means of psychological constructs, such as attitudes, motivation and emotion towards a commodity (Kroeber-Riel and Weinberg, 2003). Depending on the attitudes, motivation and emotion towards the product, it is liked or disliked. Besides this, psychological processes include perception, learning and memorising processes (Kroeber-Riel and Weinberg, 2003) and are therefore linked with cognitive approaches (cf. chapter 2.2.1). Both stimuli (S) and psychological intervention processes (I) result in a consumer response (behaviour) (R), such as the purchase of a certain product (Nieschlag et al., 1997). A simplified S-I-R model is presented in Figure 1. In this model, intervention is split into activating and cognitive processes within the organism. Activating processes include attitudes, motivations and emotions (Kroeber-Riel and Weinberg, 2003). The cognitive component includes the perception and memorising of information as well as learning processes.
Figure 1: The Stimuli-Intervention-Response model
SOURCE: OWN ILLUSTRATION BASED ON KROEBER-RIEL AND WEINBERG (2003)
Of the intervention variables described in S-I-R models, consumer attitudes towards food are of particular interest in this study as determinants of the observed buying behaviour. This focus is in accordance with previous empirical research, which has revealed the relevance of consumer attitudes as determinants for organic food preferences (cf. Aertsens et al., 2009; Magistris and Gracia, 2008; Michaelidou and Hassan, 2008; Onyango et al., 2007; Krystallis and Chryssohoidis, 2005; Saba and Messina, 2003; Hill and Lynchehaun, 2002; Laroche et
STIMULI Marketing Quality Price Communication Distinctiveness Service Availability Environment Family Peer groups Social classes
INTERVENTION RESPONSE
al., 2001; Loureiro et al., 2001; Gil et al., 2000; Grunert and Juhl, 1995) and thus was relevant for the achievement of objective 3 (cf. chapter 1.1). Furthermore, since consumers with similar attitudes are assumed to show similar behaviour (Kroeber-Riel and Weinberg, 2003), a focus on attitudes allowed the characterisation of segments among occasional organic consumers (objective 4, cf. chapter 1.1).
Attitudes are defined as positive or negative dispositions of an individual towards an object (Solomon, 2007; Meffert, 1992). According to Solomon (2007), attitudes are a lasting, general evaluation of objects. It is assumed that attitudes are formed by learning processes (Solomon, 2007; Meffert, 1992). Kroeber-Riel and Weinberg (2003) describe an attitude as a positive or negative evaluation of an object that will result in a disposition to respond in a positive or negative way. A stronger positive attitude towards an object will correlate with a higher probability of buying the object (Kroeber-Riel and Weinberg, 2003; Meffert, 1992). However, an attitude does not necessarily lead to a specific response (Kroeber-Riel and Weinberg, 2003). Thus, there is a potential gap between predictions based on attitudes and a person’s actual buying behaviour. Consumer attitudes are not directly observable as they are a latent construct (Kroeber-Riel and Weinberg, 2003). Instead, they are usually measured by means of rating scales of single indicators (items) that form the construct, which was the method selected in the quantitative research of this thesis (cf. chapter 5.5.3 and 6.5.2).
Previous research has shown that consumers’ attitudes towards the healthiness of organic food are important in explaining organic preferences (Magistris and Gracia, 2008; Padel and Foster, 2005; Shepherd et al., 2005; Zanoli et al., 2004; Harper and Makatouni, 2002; Zanoli and Naspetti, 2002). Food naturalness (no artificial flavours, additives or colourings) and the domestic origin of food products are additionally relevant in determining organic food purchases (Stolz et al., 2009 cf. chapter 4; Onyango et al., 2007). Similarly, consumers use attributes such as ‘no use of fertilizers’, ‘natural’, ‘healthy’, ‘no toxins’ (Stolz et al., 2009 cf. chapter 4; Hill and Lynchehaun, 2002) and ‘no use of genetically modified organisms’ (Stolz et al., 2009 cf. chapter 4) to distinguish organic from conventional products. Accordingly, consumer attitudes in relation to these aspects were emphasised within the intervention portion of S-I-R models (cf. Figure 1).
Furthermore, socio-demographic characteristics (social class) were selected for consideration from among the stimuli variables referring to the environment (cf. Figure 1) since previous research on the behaviour of consumers of organic products has shown that socio-demographic characteristics may be relevant; Gil et al. (2000) and Davies et al. (1995) showed that gender, income level and the presence of children may indicate higher likelihood of purchasing organic products. Similarly, Hill and Lynchehaun (2002) found that having children is a key factor in deciding whether to buy organic milk. Additionally Loureiro et al. (2001) found that the presence of children under 18 years in a household increased the probability of choosing organic products. Finally, according to Gil et al. (2000), family size and education level were significant predictors of whether an individual is an organic food consumer and was therefore considered in this thesis.
2.3 Classification of models
In the following, a classification of models is provided including the models applied in the thesis.
Two model types are distinguished in the classification of models: black-box and structural models (Nieschlag et al., 1997). According to Nieschlag et al. (1997), black-box models, such as S-R models, focus on input (stimuli) and output (response) variables, while internal processes of decision-making are not considered. In contrast, structural models, such as S-I-R models, focus on the structure of consumer consciousness to explain consumer decision-making (Nieschlag et al., 1997). They address the single components which form consumer consciousness, and investigate how they are related to each other, which was also an aim of this thesis (objective 3; cf. chapter 1.1)
subjectively perceived utility derived from a product, perceived risk, or cognitive dissonance (Nieschlag et al., 1997). In this thesis, partial models were applied because it was impossible to identify and measure all of the determinants that are involved in the buying behaviour of occasional organic consumers with regard to different types of products. Furthermore, partial models are more readily operationalised in mathematical models. While non-mathematical models use literary logic, words, or sentences, mathematical models use mathematical symbols, numbers, and equations. The advantage of using mathematical models is that concrete ‘if-then’ assumptions are considered and tested (Chiang and Wainwright, 2005). They are more concise and precise than non-mathematical models. Against these advantages, mathematical models are sometimes criticised as being unrealistic (Chiang and Wainwright, 2005). Nevertheless, mathematical models were chosen in this thesis as they were suitable for quantifying the impact of determinants on the observed consumer behaviour (objective 2 and 3, cf. chapter 1.1). Furthermore, they were suitable for segmentation of occasional organic consumers according to their preferences (objective 4; cf. chapter 1.1)
Mathematical models can be separated into stochastic and regression models (Nieschlag et al., 1997). Stochastic models, such as the S-I-R model, consider buying behaviour (or choice) as a result of a stochastic process within the organism that can be quantified, resulting in probabilities. However, such models do not predict behaviour (Nieschlag et al., 1997). In contrast, regression models, such as the multinomial and latent class models applied in this thesis (cf. chapter 5.5.4 and chapter 6.5.4), which are based on RUT (cf. chapter 2.1.2), investigate the quantitative effect of an input variable on sale (Nieschlag et al., 1997). Such regression models were chosen for application in this thesis to meet objective 3 (cf. chapter 1.1), while the S-I-R model served as an extension of the theoretical framework (cf. chapter 2.2.2), although it was not operationalised.
3 METHODOLOGY
3.1 Data collection
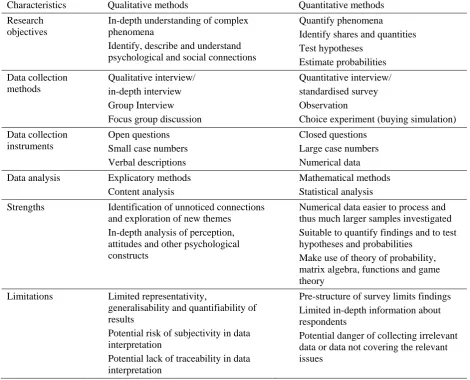
[image:24.595.64.535.266.646.2]Marketing research distinguishes between qualitative and quantitative data collection methods (Flick, 2009) and the choice of the appropriate research methods depends on the information needed (Aaker et al., 2006). Table 1 gives an overview of the main characteristics as well as on the strengths and limitations of qualitative and quantitative data collection methods as further emphasised in chapters 3.1.1 and 3.1.2.
Table 1: Overview of main characteristics of qualitative and quantitative data collection
methods
Characteristics Qualitative methods Quantitative methods Research
objectives
In-depth understanding of complex phenomena
Identify, describe and understand psychological and social connections
Quantify phenomena Identify shares and quantities Test hypotheses Estimate probabilities Data collection methods Qualitative interview/ in-depth interview Group Interview Focus group discussion
Quantitative interview/ standardised survey Observation
Choice experiment (buying simulation) Data collection
instruments
Open questions Small case numbers Verbal descriptions
Closed questions Large case numbers Numerical data Data analysis Explicatory methods
Content analysis
Mathematical methods Statistical analysis Strengths Identification of unnoticed connections
and exploration of new themes In-depth analysis of perception, attitudes and other psychological constructs
Numerical data easier to process and thus much larger samples investigated Suitable to quantify findings and to test hypotheses and probabilities
Make use of theory of probability, matrix algebra, functions and game theory
Limitations Limited representativity, generalisability and quantifiability of results
Potential risk of subjectivity in data interpretation
Potential lack of traceability in data interpretation
Pre-structure of survey limits findings Limited in-depth information about respondents
Potential danger of collecting irrelevant data or data not covering the relevant issues
3.1.1 Qualitative data collection methods
Main characteristics of qualitative data collection methods
Qualitative methods are aimed at getting an in-depth understanding of complex phenomena as well as to identify, describe and understand psychological and social connections (cf. Table 1; Kepper, 1994). They are used to collect mostly complete information about what is in a consumers’ mind and to know more about things that cannot be directly observed and measured (Aaker et al., 2006). Qualitative methods are interpretative, open and communicative approaches (Kepper, 1994), which are limited to small numbers of cases and to open questions (Kamenz, 2001). The data basis of qualitative approaches consists of verbatim transcripts, which are used for interpretative analysis methods (Kamenz, 2001). The major strengths of qualitative approaches are their suitability to identify unnoticed connections and to explore new themes (cf. Table 1). Besides this, qualitative approaches provide an in-depth understanding of consumer perceptions, attitudes and other psychological dimensions.
Against these strengths, qualitative approaches have the disadvantages of limited representativeness, generalisability and quantifiability of the results (cf. Table 1; Helfferich, 2005; Lamnek, 2005). Furthermore, a significant limitation is the potential risk of subjectivity during data interpretation as well as the potential lack of traceability in data interpretation (Helfferich, 2005; Lamnek, 2005).
Overview of qualitative data collection methods
Four main methods are distinguished from among qualitative data collection methods: Qualitative interview,
Qualitative observation, Indirect questioning, and
Focus group discussion (Kepper, 1994).
Qualitative interviews, which include the explorative interview, the in depth-interview and the focussed interview, are usually conducted as face-to-face interviews based on predefined interview guidelines (Kepper, 1994). The aim is to obtain mostly unbiased and complete information about the subject under investigation. Aaker et al. (2006) describes qualitative interviews as semi-structured interviews with varying levels of structuring of the interview and guidance provided by the interviewer. The open structure of qualitative interviews ensures that unexpected factors or attitudes are expressed by the respondent. Against this background, the method is particularly useful for interviews with experts (Aaker et al., 2006). Qualitative interviews are furthermore useful to gain (creative) key insights into product perceptions and expectations of consumers towards product or product attributes (Aaker et al., 2006). However, the potential risk of interviewer bias is relatively high in such face-to-face interview situations compared to other qualitative data collection methods (Kamenz, 2001). Therefore, the method was not chosen.
The method of qualitative observation investigates physical activities of the observed individuals and collects data on observed real behaviour instead of collecting statements made by the individuals (Kepper, 1994). A major disadvantage of the method in the context of this thesis is the low level of insights that can be obtained by qualitative observation of behaviour on how consumers perceive and evaluate organic products. Therefore, the method was not suitable to achieve objective 1 (cf. chapter 1).
(Buber and Holzmüller, 2007; Felser, 2007). According to Kepper (1994), this procedure is particularly useful in cases of delicate subject under investigation, where direct questions produce a limited outcome.
Projective questioning was considered appropriate for use when asking about willingness to pay for particular criteria in study 2-DE and 2-CH (cf. chapter 4.3). In formulating this question projectively, the aim was to avoid participants from being influenced by a social desirability to indicate a greater willingness to pay than is the case in reality. In Study 1-DE a projective question was used to enable the participants to give less socially acceptable reasons for the greater relevance of individual criteria of organic farming as compared with organic farming as a whole (cf. chapter 4.3).
3.1.2 Quantitative data collection methods
Main characteristics of quantitative data collection methods
In contrast to qualitative data collection methods, quantitative data collection methods are aimed at measuring phenomena (Flick 2009). They are usually theory-based and aimed at testing hypotheses, causalities or estimating probabilities (cf. Table 1). Quantitative methods make use of large case numbers, closed questions, and numerical data. The data is collected in standardised approaches and analysed by means of mathematical methods and statistical analyses (Flick, 2009; Shao, 2002; Kamenz, 2001).
The strength of quantitative approaches is that numerical data allows the researcher to quantify and generalise phenomena and to make use of the theory of probability, matrix algebra, functions and game theory (cf. Table 1; Shao, 2002; Kamenz, 2001). Furthermore, in contrast to verbatim data, numerical data is easier to process and much larger case numbers can be included in quantitative research (Shao, 2002; Kamenz, 2001). In addition, quantitative approaches are suitable for describing phenomena or characteristics of a certain population or groups (Flick, 2009). In contrast to qualitative approaches, quantitative approaches are more generalizable and provide representative results (Flick, 2009). Against these strengths, the weakness of quantitative approaches is the potential danger of collecting irrelevant data, or data which does not sufficiently cover the context (cf. Table 1; Flick, 2009). However, this limitation was intended being reduced by firstly conducting the qualitative research before narrowing the focus in the quantitative research.
To achieve objectives 2, 3 and 4 of this PhD (cf. chapter 1.1), a quantitative approach was chosen since the numerical data on consumers’ observed buying behaviour and determinants of behaviour could be collected. The numerical data allowed quantification and generalization of the observed behaviour by means of statistical analyses and could thus overcome the main limitation of the qualitative research applied in this thesis (cf. chapter 3.1.1).
Overview of quantitative data collection methods
cf. chapter 1.1) and to answer the associated research questions, an observation method was chosen. The reason was that observation is the most suitable method to accurately investigate consumers’ buying behaviour patterns without response bias, which is a potential hazard of survey methods (Hair et al., 2006).
Flick (2009) distinguishes between four observation methods: Standardised observation,
Participative observation, Ethnography, and
Experiment.
Standardised observation is aimed at investigating known incidents, which are segmented into single aspects or processes to be further analysed (Flick, 2009). The method is based on a strictly pre-defined standardised observation protocol, which outlines the activities to be observed, such as physical actions, verbal behaviour, and temporal behaviour patterns, as well as how they are to be observed (Flick, 2009; Hair et al., 2006). The strength of the method is that it allows the behaviour to be structured (Hair et al., 2006). The main weakness of standardised observation is that the method cannot be used to capture cognitive elements such as attitudes, preferences, beliefs, or emotions (Hair et al., 2006) and therefore was not chosen. Participative observation is a research process in which the researcher’s participation is part of the research (Flick, 2009). In contrast to standardised observations, participative observations are open, flexible and less structured: they recommend a constant re-definition of the research problems based on the behaviour observed during the research process (Flick, 2009). Although the open, flexible and less structured character of participative observation may be useful in certain situations, this procedure requires a large flexibility with respect to the time frame and funding, which was not given in the research project QLIF, in which this PhD thesis was developed.
Choice experiments (in this case buying simulation) are commonly applied in cases of discrete choices and are an increasingly used marketing research method (Hair et al., 2006). According to Aaker et al. (2006), choice experiments are defined as
‘[…] studies, in which conditions are controlled so that one or more independent variable(s) can be manipulated to test a hypothesis about a dependent variable.’
Choice experiments belong to the causal research methods (Aaker et al., 2006; Hair et al., 2006), which are aimed at identifying causal relationships between several independent variables and their effects on a dependent variable (Aaker et al., 2006). The key principle of experimental research is the intervention by the researcher in terms of targeted manipulation of an independent variable, followed by an observation of the dependent variable (Flick, 2009; Aaker et al., 2006). The strength of the method over descriptive methods is its ability to investigate the causal link between variables and thus to measure the association between variables (Aaker et al., 2006). This is considered to provide valid predictions about the effects of marketing decisions and to develop basic theories (Aaker et al., 2006). In addition, the method is suitable to accurately observe consumers’ buying behaviour patterns without a negative impact of response bias (Hair et al., 2006), which is potentially given in interview surveys. Against these strengths, however, the method is limited with regard to the external validity of the results of choice experiments obtained in laboratory settings as well as the relatively high costs of conducting them (Aaker et al., 2006; Hair et al., 2006).
tastes and thus to measure the associations between the variables of interest (Aaker et al., 2006), which was necessary to achieve objective 3 of this thesis (cf. chapter 1.1).
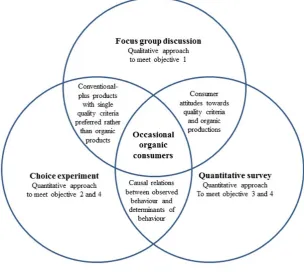
Furthermore, to meet objectives 3 and 4 (cf. chapter 1.1), the experiment was linked with a quantitative survey in a single-source approach (cf. Appendix III for the questionnaire). This single-source approach, in which the same consumers first conducted a choice experiment and then completed a quantitative survey, was aimed to identify causal links between the observed buying behaviour and the determinants of the behaviour (cf. Figure 2).
The quantitative survey (quantitative interview) is a method, in which information reported by the respondents is collected (Aaker et al., 2006). Most quantitative surveys are based on a standardised questionnaire in which both the questions and the way in which respondents can respond to the questions are pre-defined (Flick, 2009). The standardisation of the data collection is aimed at achieving a high comparability of answers between all respondents (Flick, 2009). Consumer attitudes towards a product’s attributes, such as pricing, as well as other factors that determine behaviour are often the subject of interviews (Aaker et al., 2006). The focus is on the process of decisions rather than on the decisions or behaviour itself. The aim is to provide information on why consumers performed certain behaviour (Aaker et al., 2006).
A large range of survey methods exists, which are distinguished according to the means of communication between interviewer and respondent. Aaker et al. (2006) distinguish between the four survey methods: personal interviews, telephone interviews, mail surveys, and fax surveys. Another classification is provided by Hair et al. (2006) who distinguish between four approaches: person-administered, telephone-administered, self-administered and computer-assisted (online) survey methods.
bias due to respondents’ unwillingness to respond accurately caused by the lengths of the interview or by getting bored with the topics addressed in the survey (Aaker et al., 2006). Among the quantitative survey methods available, a personal face-to-face interview based on a standardised questionnaire (cf. Annex III for the questionnaire) was conducted in order to assure a high adequacy and completeness of answers (Aaker et al., 2006). The standardised questionnaire facilitated the comparability of answers between the consumers and thereby obtained information on why consumers performed certain behaviour, which contributed to achieving objective 3 (cf. chapter 3.1.2; Aaker et al., 2006). This information additionally enabled the segmentation required by objective 4 of this thesis (cf. chapter 1.1). Parts of the quantitative survey, particularly the indicators of consumer attitudes, were selected based on the findings of the qualitative research (cf. Figure 2 and chapter 2.2.2).
[image:32.595.117.422.399.671.2]To summarise, in this thesis, a triangular methodological approach (Flick, 2009) was chosen that combined three data collection methods: one qualitative and two quantitative methods (cf. Figure 2).
The intention behind combining three data collection methods was to gain different perspectives on occasional organic consumers from different data collection approaches (Flick 2009). Furthermore, triangulation was used to overcome the limits and weaknesses of the chosen methods (Flick 2009), as described in chapter 3.1.1 and 3.1.2. The data collection methods were selected according to their suitability to meet the objectives of this thesis. The methods chosen were:
1. Focus group discussion (including a projective technique), 2. Choice experiment (buying simulation), and
3. Quantitative survey (see Figure 2).
3.2 Data analysis
Qualitative data analysis methods were chosen to analyse the data from the focus group discussions: qualitative content analysis and cross-case comparison analysis. The data obtained from the choice experiments and quantitative survey was analysed with quantitative analysis methods: uni- and bivariate statistics, factor analysis and sum scales, multinomial logit models, and latent class models. A brief overview of the main qualitative and quantitative methods as well as their applicability in this thesis is provided in the following paragraphs.
3.2.1 Qualitative data analysis methods
From among the various qualitative data analysis methods, three main methods are distinguished (Mayring, 2003):
Phenomenological analysis, Hermeneutic paraphrase, and Qualitative content analysis.
method involves a psychological interpretation of the data, the method is applicable in the field of psychology rather than in marketing research so was not selected for application in this study.
Hermeneutic paraphrase is used to modify (stepwise) the preliminary position of interpretations into a subjective perspective of the subjects (Mayring, 2003). According to Mayring (2003), this analysis method is commonly used for very detailed analyses of extensively structured text material or as starting point for further analyses (Mayring, 2003). However, in the context of objective 1 of this thesis, the hermeneutic paraphrase was considered to be less suitable, since the objective was to structure and summarise the various consumer perceptions and attitudes towards organic products.
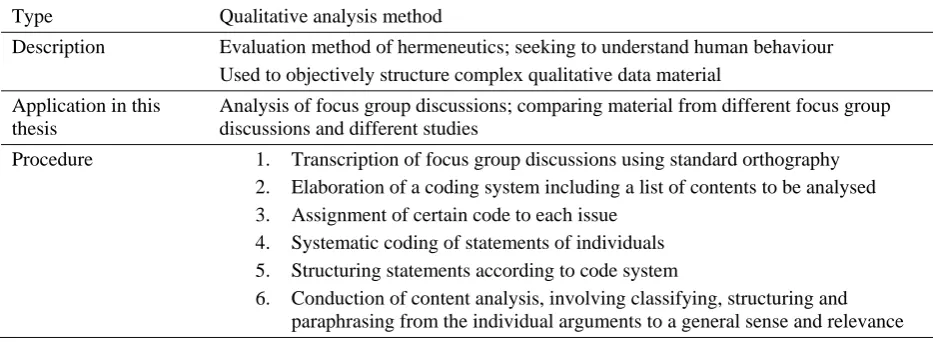
Qualitative content analysis is a method which aims to objectively systematise the content of qualitative data (Kromrey, 2002) and is commonly used to analyse text material, such as data obtained from focus group discussions (Mayring, 2008; Hair et al., 2006; Kromrey, 2002). Qualitative content analysis allows structuring, analysing and reducing complex qualitative data (cf. Table 2; Mayring, 2008) so that the essential information is extracted (Mayring and Brunner, 2007). The method is furthermore aimed at drawing conclusions that go beyond the cases investigated (Kromrey, 2002). It was therefore suitable for structuring and systemising qualitative data material on consumer perception and attitudes of organic products, and thus to meet objective 1 of this thesis (cf. chapter 1.1).
Qualitative content analysis was selected as the method of analysis of the focus group discussions (chapter 4.4.1) and was particularly useful for structuring and summarising different types of perceptions and attitudes towards various food quality attributes, as well as towards organic farming. This task was achieved by elaborating a coding system, with the subsequent assignment of certain codes to each issue, and by the systematic coding of statements of individuals (cf. Table 2).
analysis). Other methods are suitable for several processes, e.g. for summarising and structuring (frequency analysis) or for explication and structuring (hermeneutic).
Table 2: Qualitative content analysis
Type Qualitative analysis method
Description Evaluation method of hermeneutics; seeking to understand human behaviour Used to objectively structure complex qualitative data material
Application in this thesis
Analysis of focus group discussions; comparing material from different focus group discussions and different studies
Procedure 1. Transcription of focus group discussions using standard orthography 2. Elaboration of a coding system including a list of contents to be analysed 3. Assignment of certain code to each issue
4. Systematic coding of statements of individuals 5. Structuring statements according to code system
6. Conduction of content analysis, involving classifying, structuring and paraphrasing from the individual arguments to a general sense and relevance SOURCE: OWN ILLUSTRATION BASED ON MAYRING AND BRUNNER (2007), LAMNEK (2005), MAYRING (2003) AND WILKINSON (2003)
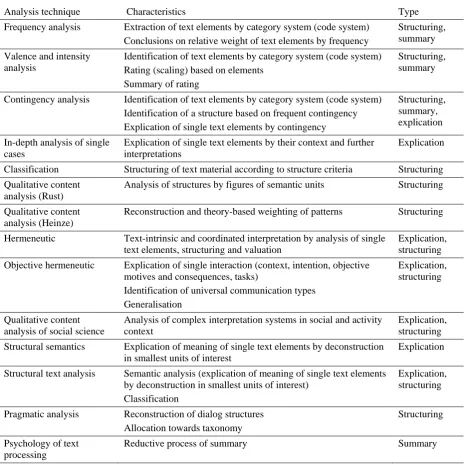
A structuring and summarising technique was necessary to analyse the large amount of data on occasional organic consumers’ perceptions and attitudes of various quality criteria for organic products that were obtained in the focus group discussions (objective 1, cf. chapter 1.1). In particular the structuring process was necessary to identify relevant product-specific and country-specific quality criteria and to analyse how consumers assess organic production compared to conventional production, which would not have been possible by simply summarising the text material. Thus, among the techniques described by Mayring (2008), the contingency analysis technique, which is suitable for summarising, structuring and explication, was chosen. The approach was suitable for identifying relevancies of single food criteria, which was achieved based on the frequency of statements referring to single food criteria.
Table 3: Overview of qualitative content analysis techniques
Analysis technique Characteristics Type
Frequency analysis Extraction of text elements by category system (code system) Conclusions on relative weight of text elements by frequency
Structuring, summary Valence and intensity
analysis
Identification of text elements by category system (code system) Rating (scaling) based on elements
Summary of rating
Structuring, summary
Contingency analysis Identification of text elements by category system (code system) Identification of a structure based on frequent contingency Explication of single text elements by contingency
Structuring, summary, explication In-depth analysis of single
cases
Explication of single text elements by their context and further interpretations
Explication
Classification Structuring of text material according to structure criteria Structuring Qualitative content
analysis (Rust)
Analysis of structures by figures of semantic units Structuring
Qualitative content analysis (Heinze)
Reconstruction and theory-based weighting of patterns Structuring
Hermeneutic Text-intrinsic and coordinated interpretation by analysis of single text elements, structuring and valuation
Explication, structuring Objective hermeneutic Explication of single interaction (context, intention, objective
motives and consequences, tasks)
Identification of universal communication types Generalisation
Explication, structuring
Qualitative content analysis of social science
Analysis of complex interpretation systems in social and activity context
Explication, structuring Structural semantics Explication of meaning of single text elements by deconstruction
in smallest units of interest
Explication
Structural text analysis Semantic analysis (explication of meaning of single text elements by deconstruction in smallest units of interest)
Classification
Explication, structuring
Pragmatic analysis Reconstruction of dialog structures Allocation towards taxonomy
Structuring
Psychology of text processing
Reductive process of summary Summary
SOURCE: MAYRING (2008)
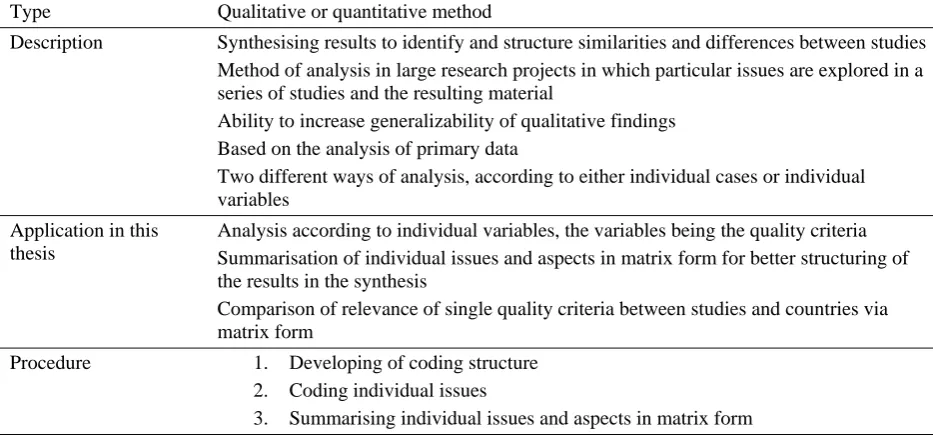
It is possible to produce matrix forms on single aspects without necessarily counting these aspects in the data material. This can be achieved by coding and summarising issues in a matrix structure (cf. Table 4; Weed, 2005; Miles and Hubermann, 1994).
Table 4: Cross-case comparison analysis
Type Qualitative or quantitative method
Description Synthesising results to identify and structure similarities and differences between studies Method of analysis in large research projects in which particular issues are explored in a series of studies and the resulting material
Ability to increase generalizability of qualitative findings Based on the analysis of primary data
Two different ways of analysis, according to either individual cases or individual variables
Application in this thesis
Analysis according to individual variables, the variables being the quality criteria Summarisation of individual issues and aspects in matrix form for better structuring of the results in the synthesis
Comparison of relevance of single quality criteria between studies and countries via matrix form
Procedure 1. Developing of coding structure 2. Coding individual issues
3.2.2 Quantitative data analysis methods
Quantitative data analysis methods are commonly distinguished by the number of included variables and referred to as univariate, bivariate or multivariate analysis methods (Bortz, 2005).
Uni- and bivariate statistics
Uni- and bivariate statistics are commonly used to investigate quantities, distributions, similarities or differences of variables (Flick, 2009). In this thesis, univariate statistics were used to get an overview of the collected data (cf. chapter 5.5 and 6.5). In addition, univariate statistics were used to analyse which alternatives were preferred in a choice situation and to identify the shares of the conventional-plus products (research question 2.1, objective 2; cf. chapter 1.1; chapter 5.5). Additionally, bivariate statistics were used to analyse the association between consumer behaviour observed in the choice experiments and everyday-life preferences (research question 2.2; cf. chapter 1.1, chapter 5.5 and chapter 6.5). This was achieved with contingency tables which are commonly used to show frequency distributions of two variables in a matrix format (Bortz, 2005). In addition, the Pearson’s chi-square test, which is used for the analysis of associations between two categorical variables (Bortz, 2005), was conducted to investigate whether the preferences observed in the choice experiments are significantly different in the two study countries (cf. chapter 5.5 and chapter 6.5).
Exploratory factor analysis and sum scales
Objective 3 of this thesis (Identification of determinants that explain occasional organic consumers’ preferences for organic, conventional and conventional-plus products) and objective 4 (Investigation of preference heterogeneity among occasional organic consumers regarding organic, conventional-plus and conventional products) required multivariate analysis methods. Multivariate analysis methods were necessary since the analysis method had to capture consumers’ behaviour (choice) as well as a set of independent variables.
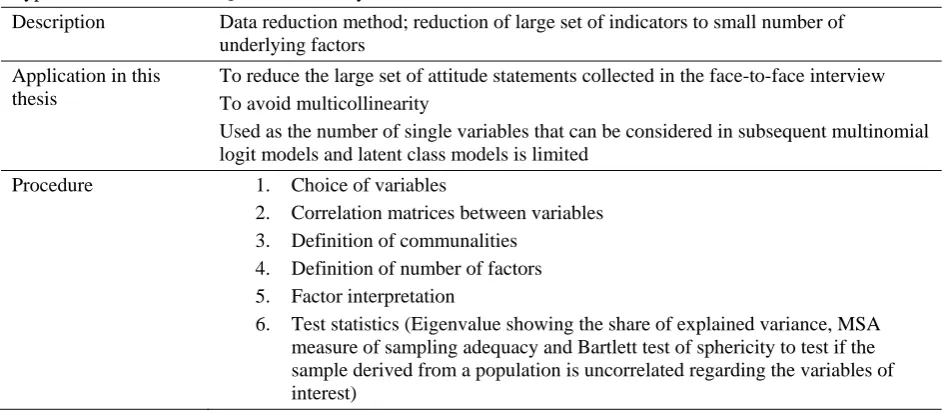
was conducted, as described in chapter 6.5.2 and Table 5. Exploratory factor analysis is a method of data reduction (cf. Table 5; Backhaus et al., 2006), which identifies underlying factors (latent variables) while retaining as much of the original information as possible (Field, 2005). These factors can be used for further analysis; in this thesis for the subsequent causal analysis. In addition, exploratory factor analysis was used to avoid multicollinearity, since variables (here consumer attitudes), which are correlated with each other are summarised by factors (Backhaus et al., 2006).
Table 5: Exploratory factor analysis
Type Quantitative analysis method
Description Data reduction method; reduction of large set of indicators to small number of underlying factors
Application in this thesis
To reduce the large set of attitude statements collected in the face-to-face interview To avoid multicollinearity
Used as the number of single variables that can be considered in subsequent multinomial logit models and latent class models is limited
Procedure 1. Choice of variables
2. Correlation matrices between variables 3. Definition of communalities
4. Definition of number of factors 5. Factor interpretation
6. Test statistics (Eigenvalue showing the share of explained variance, MSA measure of sampling adequacy and Bartlett test of sphericity to test if the sample derived from a population is uncorrelated regarding the variables of interest)
SOURCE: OWN ILLUSTRATION BASED ON BACKHAUS ET AL. (2006), STATA PRESS (2005) AND SPEARMAN (1904)
Multinomial and latent class models
To achieve objectives 3 and 4 (cf. chapter 1.1), multivariate analysis methods were chosen. The reason was that the identification of determinants that explain consumer preferences, and of consumer segments, required the simultaneous consideration of more than two variables: the observed behaviour as a dependent variable and several potential determinants as independent variables. Furthermore, to meet objective 3, the methods had to be suitable for identifying causal relationships between the observed behaviour and determinants that explain the observed behaviour. In addition, the fact that the dependent variable (choice) in this research was categorical was an issue when choosing the appropriate analysis method.
The following approaches are available from among the existing multivariate causal analysis methods that fulfil the previously mentioned requirements: discriminant analysis, structural equation modelling and regression analysis. Discriminant analysis was not chosen in this thesis as it is only applicable for metric independent variables. In contrast, the analysis method was not applicable to test for non-metric determinants, such as gender or the educational level of consumers.
Structural equation modelling is an analysis method that is particularly focussed on hypothetical constructs or latent variables, such as attitudes, or motives, and is commonly used for complex causal analyses between variables (Backhaus et al., 2006). Such models consist of a measuring model based on factor analysis that provides the relationships between latent variables and their indicators, and a structural model based on a regression analysis (Backhaus et al., 2006). The latter measures the causal relationships between the latent variables. The model is suited to the analysis of the relationship between several independent and several dependent variables and can be used to study complex associations between variables and latent constructs (Backhaus et al., 2006).
therefore estimated with a log-likelihood function (Backhaus et al., 2006). Logit models estimate the probability of belonging to a category of the dependent variables depending on a set of independent variables (cf. Table 6).
Regression models were more suitable for analysing the causal relations between the observed consumer behaviour and determinants that explain the observed behaviour than structural equation modelling. One reason was that logit models are directly linked with the underlying Random Utility Theory (cf. chapter 2.1.2). In addition, logit models are more flexible in cases were both metric and nominal independent variables are included. In contrast, an important assumption of structural equation model approaches is that the independent variables are continuous and interval scaled (Satow, 2006), which is not mandatory for logit models. Finally, identifying complex associations and interrelationships between variables and constructs was not an issue in this thesis and therefore structural equation models were not necessary. A range of different logit models is included in Riesenhuber (2007) including the:
Multinomial logit model, Nested logit model, Latent class model, and Mixed logit model.
The multinomial logit model is the basic econometric model for discrete choice analyses developed by McFadden in 1977 (McFadden, 2001). The model is designed for cases in which the dependent variable is a categorical variable with more than two levels (Backhaus et al., 2006; Long and Freese, 2006; Stata Press, 2005). The model involves the simultaneous estimation of binary logits for all comparisons among the choice alternatives, while one of the alternatives (or levels of the dependent variable) is the base category (herein the conventional alternative), which is referred to as the comparison group (Long and Freese, 2006). A restrictive assumption of multinomial logit models is the assumption of IIA (independence of irrelevant alternatives), postulating that
‘[…] the ratio of the choice probabilities is independent of the presence or absence of any other alternative in a choice set’ (Hensher et al., 2005).
for studies of preference heterogeneity among decision makers and can be applied to identify latent consumer segments (Hensher et al., 2005). Another model in which the IIA assumption is relaxed, and which captures preference heterogeneity, is the mixed logit model (or random parameter logit model) (Albers et al., 2007), which was introduced by Revelt and Train (1998). In mixed logit models, the choice probability in a choice set is expressed over the vector (describing the parameter distribution) of taste parameters that can be random, and conditional on the individual-specific error components (Hensher et al., 2005).
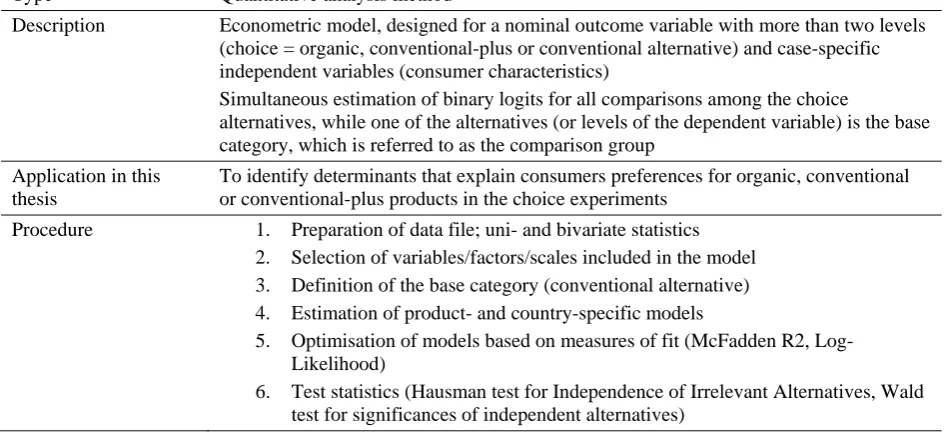
[image:42.595.65.541.492.711.2]In this thesis, two different logit models were used: multinomial logit models to achieve objective 3 and latent class models to achieve objective 4. Both models belong to the group of partial models (cf. chapter 2.3), which focus on relevant components and typically on one major psychological construct, e.g. attitudes (Nieschlag et al., 1997) as done within this thesis. Multinomial logit models were chosen from among the range of available logit models as described above as they are suitable for cases in which the dependent variable is categorical with more than two levels (in this thesis three levels: organic, conventional and conventional-plus) (cf. Table 6). Thus, given that the IIA assumption can be fulfilled (which was verified for all models except one as described in chapter 5.5.4) the multinomial logit model was deemed to be suitable for analysis of the data obtained from the choice experiments. A brief summary of the multinomial logit model is provided in Table 6:
Table 6: Multinomial logit model
Type Quantitative analysis method
Description Econometric model, designed for a nominal outcome variable with more than two levels (choice = organic, conventional-plus or conventional alternative) and case-specific independent variables (consumer characteristics)
Simultaneous estimation of binary logits for all comparisons among the choice
alternatives, while one of the alternatives (or levels of the dependent variable) is the base category, which is referred to as the comparison group
Application in this thesis
To identify determinants that explain consumers preferences for organic, conventional or conventional-plus products in the choice experiments
Procedure 1. Preparation of data file; uni- and bivariate statistics 2. Selection of variables/factors/scales included in the model 3. Definition of the base category (conventional alternative) 4. Estimation of product- and country-specific models
5. Optimisation of models based on measures of fit (McFadden R2, Log-Likelihood)
6. Test statistics (Hausman test for Independence of Irrelevant Alternatives, Wald test for significances of independent alternatives)