Peer-reviewed, accepted author manuscript of the following in press conference paper: Jiang, X., Stephen, B., & McArthur, S. (Accepted/In press). Automated fault analysis and diagnosis using high-frequency and maintenance data from distribution networks. Paper presented at IEEE PES Innovative Smart Grid Technologies
Conference Europe 2019, Bucharest, Romania.
Automated Fault Analysis and Diagnosis using
High-Frequency and Maintenance Data from Distribution
Networks
Xu Jiang,
Student Member
, Bruce Stephen,
Senior Member,
Stephen D.J. McArthur,
Fellow
Department of Electronic and Electrical Engineering University of Strathclyde
Glasgow, UK
x.jiang@strath.ac.uk, bruce.stephen@strath.ac.uk, s.mcarthur@strath.ac.uk
Abstract— Fault analysis based on high-resolution data
acquisition is growing in use as it offers a more complete picture of faults which provides an opportunity to deal with failures more effectively. However, with increased volume of data collected, it becomes impossible for engineers to interpret every fault instance. A machine learning approach to classification should be the solution to this, but it is time-consuming to manually label faults for training and validation making data-driven approaches impossible to transfer into practical implementation. A solution to this is to unify fault analysis with maintenance report analysis to automate the generation of training labels. This paper outlines how a fully automatic fault detection and diagnostic approach based around power quality waveform analysis can be used to improve situational awareness on distribution networks. The methodology is illustrated using operational case study data and realistic simulations to demonstrate the diagnostic functionality as well as the practical benefit. In particular, classification accuracy is shown to approach that of expert labelled fault data.
Index Terms—Power Quality, Automatic Fault Analysis,
Increasing Situational Awareness, High-resolution Monitoring, Fault Labelling
I. INTRODUCTION
Maintenance procedures on distribution networks can suffer from inefficient fault and outage management due to lack of observability. In distribution networks, many faults can only be detected through operational alerts from Intelligent Electronic Devices (IED) or Supervisory Control and Data Acquisition (SCADA) systems, or through customer calls when supply is lost. The data captured on these devices is based on low-resolution monitoring; however, many anomalies are transient and intermittent, and might only last for couple or even less than one cycle. This results in low-resolution fault recording missing many important signatures in the pre-failure period. Thus, many utilities’ awareness of the distribution system is either “normal operation” or “failure”. [1] and [2] proposed a new approach to obtain high-resolution data to find the early signatures of failures and analyse the resulting waveforms to increase situational awareness, which provides more context for remedial decision support. The system utilized a rule-based
technique with expert knowledge to analyse faults. However, developing rule-based systems to cover every eventuality can be time-consuming, and a comprehensive validation of the method is a challenge because the volume of detected anomalies is excessive [2]. A solution is to utilize an automatic labelling function to obtain more exemplars for training and validating classifiers. Pertinent maintenance reports are an ideal source for this. Maintenance reports have been widely used for utilities to schedule and validate remedial works. Previous research [3] has utilized historical maintenance reports to predict feeder failure and limit the cascading impact of problems, which has validated the use of handwritten records in decision support for the maintenance of the network in New York City.
Furthermore, many distribution network components, such as cables, overhead lines and capacitors, are invisible to utilities so far as it is expensive to install individual sensors for them; however, these make up the majority of network assets. According to the 2015 British blackout annual report [4], many outages can be attributed to low observability components. Consequently, monitoring systems such as those proposed in [1][2] were built on a single point at the substation level, which provides a means to efficiently observe the health state of all the network components downstream.
II. INTELLIGENT FAULT PROCESSING WITH POWER QUALITY WAVEFORM DATA
[image:2.612.55.290.206.344.2]Power Quality monitoring involves capturing voltage and current measurements at waveform level resolution, then looking for evidence of developing faults through the recognition of artefacts superimposed on the AC waveform. Fig 1 shows an example of how a fault may manifest in waveform data. This fault is caused by weather – heavy snow on the lines. During the fault, distortion of one-cycle of voltage on phase A and neutral overcurrent can be observed. This can be because the snow causes a short-circuit which conducts from the overhead line to ground.
Fig 1 PQ waveform representation
This section will describe a high-resolution monitoring based intelligent fault analysis approach to automatically extract contexts of the distribution network, then provide the context for utilities to increase situational awareness. Fig 2 demonstrates the end-to-end process of the proposed system. Fundamentally, this system utilizes historical anomalous waveforms along with the maintenance reports that
accompanied faults emanating from their occurrence to form a fault event exemplar repository that can support training of fault classifiers. When high-frequency continuous waveform signals are streamed into the system, abnormal events will be automatically segmented out, then can be put in the fault analysis system to interpret the anomalous waveform. While fault data may naturally partition itself according to cause, this is not immediately understandable by a non-expert. To assign a human readable description to faults, the semantics of the associated maintenance record are analysed to obtain representative keywords which can then serve as a label for the fault [3]. The specifics of this functionality will now be elaborated upon. We consider two use cases for the concept; retrospective analysis of archived operational fault data and simulated operational extremes.
A. Signal Segmentation
The approach only uses fault current signals to detect the abnormal events, because current is more sensitive to events. After detection, this event can be segmented and stored in a cache for later processing. Conventional high-resolution anomaly detection schemes, such as using the RMS value of three-phase current to determine abnormal events can result in high false positive rates [6][7]. This could be resolved through tracking the shape of abnormal components decoupled from sinusoidal components [7] rather than the localized thresholding of statistics approach. Here, sequential hypothesis testing is utilized [8] to characterise then identify abnormal events; this is because the shape descriptors of abnormal components obey a Gaussian distribution which has been validated in [7]. Then it can track abnormal events through observing whether new observations can be assumed to be drawn from the distribution of the predicted shape based on the sequential estimate of the mean and variance of the prior waveform.
B. Fault Event Exemplar Generation
[image:2.612.52.295.450.654.2]means it can produce a readable list of most likely terms for a given combination of topics associated with a fault maintenance record, removing the need for explicit labelling.
C. Fault Recognition
Fault recognition amounts to a supervised learning problem: the proposed method utilizes the segmented fault data with a label generated from maintenance reports to identify the cause of the faults. If a fault has already occurred, the root cause of the fault can be identified through combining the context with the waveform characteristic of a new event. The features selected are referenced to the ones in [10][11] which uses weather observations from public stations and pertinent waveform characteristics. For demonstration purposes, one of the simplest classifiers, K-Nearest Neighbors (KNN), is used here to identify fault causes from the waveform shapes; benchmarking against a number of state of the art classifiers revealed this to be the superior performer although a formal model selection is left to future work, with this model pursued for completeness of demonstration purposes.
The root cause is essential information for utilities to take effective maintenance action. Fault cause determines the resulting maintenance response: if equipment is damaged by a 3rd party, it may need to be replaced or repaired urgently; if the fault is caused by a lightning strike three different outcomes may result depending on whether the lightning protection scheme was defective, the lightning arrester was damaged, or a re-closer is activated, a resulting maintenance scheme needs to be undertaken for the former two situations; animal or tree contact faults may be known occurrences with low priority or longer term remedial action. Thus, the fault cause and its event
context can provide more observability for utilities to make an optimal maintenance response which can minimize interruptions to supply.
III. CASE STUDIES:FAULT DETECTION AND DIAGNOSIS To demonstrate the effectiveness of the proposed fault processing method, two approaches are taken: retrospective analysis of archived operational fault data and simulated operational extremes. For the latter, the IEEE 13-Bus Test Network is a typical unbalanced US distribution network which comprises both overhead lines and underground cables, which is simulated using the Simulink network shown in Fig.3. The injected faults provide the ground truth for abnormal events which can evaluate whether a detector with high-frequency data acquisition is capable of finding anomalies and how early it can detect the event. The fault category and parameters are modified based on the work of [12]. This simulation creates high-impedance arcing faults with variable duration and fault impedance which are hard to detect using conventional schemes [12].
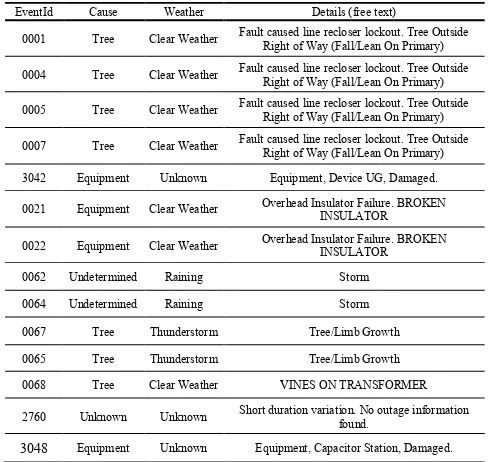
The US Department of Energy PQ Event Repository [13] provides an opportunity to test the classification capability on operational faults; the library includes the waveform, time, weather, fault cause and corresponding field crew fault records. The sampling frequency of waveforms is 1.92 kHz and 3.84 kHz which produces a high-resolution representation as shown in Fig 1. It also provides the fault waveform start time and end time down to millisecond level. Table I shows the additional fault details that accompany each record.
[image:3.612.316.560.397.628.2]Table I shows the free text report associated with the fault indicating its context. Furthermore, Table I demonstrates the associated weather data used as an input for fault diagnosis as shown on Fig 2. To validate fault labelling and recognition, Fig 3 IEEE 13 bus distribution system for fault simulation
Table I Maintenance records, fault cause labels and associated weather EventId Cause Weather Details (free text)
0001 Tree Clear Weather Fault caused line recloser lockout. Tree Outside Right of Way (Fall/Lean On Primary)
0004 Tree Clear Weather Fault caused line recloser lockout. Tree Outside Right of Way (Fall/Lean On Primary)
0005 Tree Clear Weather Fault caused line recloser lockout. Tree Outside Right of Way (Fall/Lean On Primary)
0007 Tree Clear Weather Fault caused line recloser lockout. Tree Outside Right of Way (Fall/Lean On Primary)
3042 Equipment Unknown Equipment, Device UG, Damaged.
0021 Equipment Clear Weather Overhead Insulator Failure. BROKEN INSULATOR
0022 Equipment Clear Weather Overhead Insulator Failure. BROKEN INSULATOR
0062 Undetermined Raining Storm
0064 Undetermined Raining Storm
0067 Tree Thunderstorm Tree/Limb Growth
0065 Tree Thunderstorm Tree/Limb Growth
0068 Tree Clear Weather VINES ON TRANSFORMER
2760 Unknown Unknown Short duration variation. No outage information found.
[image:3.612.55.280.415.662.2]appropriate exemplars should be selected. Firstly, the repository has 12 fault cause labels for the fault as Fig 4 shows. However, some of the fault causes are unknown which are labelled as ‘Unknown’, ‘Undetermined’, ‘Other’ or without any labels which should be removed. These amount to nearly a third of the archive, which implies present recording systems will still fail to identify the fault cause for some events. Therefore, a fault cause classifier with low false positive rate is required. Furthermore, the prevalence of fault cause, as shown in Fig 4, is unbalanced which can be challenging for automated classification – it will be difficult to learn general representations of seldom seen events. Five fault categories have sufficient prevalence to be considered: Equipment Caused Faults (ECF), Lightning Striking Faults (LSF), Vehicle
Hitting Faults (VHF), Animal Contact Faults (ACF) and Tree Contact Faults (TCF). Then these five categories will be used to test the classification with automatic labelling.
IV. RESULTS
This section uses simulated and operational data from a US distribution network to validate the signal segmentation and labelling function, then test classification with automated labelling which is benchmarked against the classification with expert labelled data. To achieve this, the signal segmentation function is first validated on the simulated data; after that, the operational data will be used to test the whole system end to end including signal segmentation, fault recognition and fault labelling. The associated fault reports will be utilized to generate labels for faults. Then the faults associated with the generated labels will be presented to the classification model, meanwhile, the faults manually labelled by experts will be individually used to train another classification. Ultimately, the actual labels will be used to test both models to see how they agree with expert classification. The performance of both models will be measured using the classification accuracy:
Accuracy=∑ 𝑇𝑟𝑢𝑒 𝑃𝑜𝑠𝑡𝑖𝑣𝑒𝑠 +∑ 𝑇𝑟𝑢𝑒 𝑁𝑒𝑔𝑎𝑡𝑖𝑣𝑒𝑠𝑇𝑜𝑡𝑎𝑙 𝑃𝑜𝑝𝑢𝑙𝑎𝑡𝑖𝑜𝑛
In the operational environment, the fault signals would be collected from a substation CT and combined with related maintenance reports stored in a digital format.
4878 simulated anomalies are used to test the effectiveness of signal segmentation using the sequential hypothesis testing model. About 94% of anomalies were identified and segmented
correctly under simulated operational conditions which included nonlinear load and realistic noise levels.
166 labelled faults are used to go through the system from end to end to test the capacity of the whole system. Firstly, the faults need to be filtered out by signal segmentation. Then 25% of the remaining data is held out as streamed new fault to test the capability of the automatic classification, and the others are used to train it. After that, the topic model described in Section IIB is utilized to generate a repository of historical exemplars. Topic models usually capture the proportions of topics present in a document rather than just assigning a single label. As Fig 2 shows, the historical maintenance reports are linked with pertinent fault waveform records using timestamp. And the relevance between every maintenance report in training set with the defined labels, such as ‘tree’ (this represents tree contact faults), can be calculated using a pre-trained topic model. The most strongly relevant will be selected as the label of the fault. Ultimately, the training set with generated labels will be put into the fault cause classifier, which is KNN in this paper, to calculate the performance and benchmark it against the ground truth.
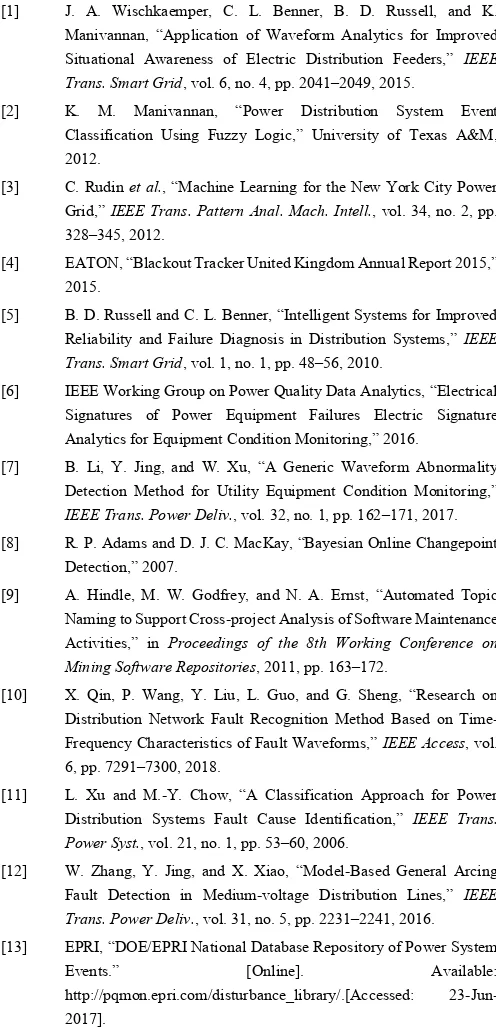
[image:4.612.50.300.227.344.2]After the signal segmentation, none of the signals are missed by the proposed detector. Therefore, all faults can be used to split into the training set and test set. The first 14 examples of relevance calculation are demonstrated in Table II: 1 represents perfectly relevant and 0 means completely irrelevant. Most events are strongly relevant to one topic. However, event 3024,
Table IIThe relevance between maintenance reports and labels for first 14 cases (Relevance), T – Tree, A – Animal, L – Lightning, V – Vehicle, E –
Equipment Event
id Details (free text) T A L V E
0001
Fault caused line recloser lockout. Tree Outside Right of Way
(Fall/Lean On Primary) 0.97 0.15 0.20 0.09 0.08
0004
Fault caused line recloser lockout. Tree Outside Right of Way
(Fall/Lean On Primary) 0.97 0.15 0.20 0.09 0.08
0005 Fault caused line recloser lockout. Tree Outside Right of Way (Fall/Lean On Primary)
0.97 0.15 0.20 0.09 0.08
0007 Fault caused line recloser lockout. Tree Outside Right of Way (Fall/Lean On Primary)
0.97 0.15 0.20 0.09 0.08
3042 Equipment, Device UG, Damaged. 0.22 0.15 0.22 0.93 0.94
0021 Overhead Insulator Failure. BROKEN INSULATOR 0.21 0.14 0.21 0.93 0.94
0022 Overhead Insulator Failure. BROKEN INSULATOR 0.21 0.14 0.21 0.93 0.94
0062 Storm 0.37 0.94 1 0.56 0.27 0064 Storm 0.37 0.94 1 0.56 0.27 0067 Tree/Limb Growth 0.98 0.17 0.25 0.15 0.12
0065 Tree/Limb Growth 0.98 0.17 0.25 0.15 0.12
0068 VINES ON TRANSFORMER 0.81 0.27 0.37 0.24 0.38
2760 Short duration variation. No outage information found. 0.20 0.89 0.97 0.44 0.08
[image:4.612.318.558.406.673.2]0021, 0022 and 3048 are attributed to both VHF and ECF, and more strongly associated to ECF. This is because many VHF events in the operational dataset usually damages the poles and overhead line. The most relevant label for faults is used to train the cause classifiers. Through this way, historical anomaly
waveform can be labelled by different fault causes, then these automated labelled data can be used to test the fault causes classification. The confusion matrix of the classification using ground truth and generated labels on the DoE data for training are shown in Table III and Table IV respectively. Although trained on faults labelled by different means (automated and manual), both classifiers are tested against the actual labels provided by an expert. The overall classification accuracy against ground truth labels is around 83%. The overall classification accuracy of generated labels is 78% - this is only a 5% reduction in classification accuracy to achieve fully automated fault labelling using KNN with US Department of Energy data.
V. CONCLUSION AND FUTURE DIRECTION
Distribution networks can be challenging to monitor effectively given their heterogeneity and historic lack of observation. The contribution of this paper has been to demonstrate an automatic waveform-based fault analytic approach built on single point high-frequency monitoring to increase situational awareness of distribution network disturbances. This takes advantage of more comprehensive signal extraction in the form of shape information to recognize complex faults as well as an automated labelling function based on the semantics of historical maintenance reports. The use of automatically generated labels only reduces classification accuracy by approximately 5% in comparison to manually labelled data on an operationally obtained data set. If deployed in practice, this could promote the use of intelligent classifiers without the burden of having to provide them with labelled fault exemplars. Further development will entail optimisation of segmentation and classification functionality, through selection of additional
features, as well as labelling improvement through the inclusion of additional fault semantic data such as maintenance manuals. Operationally it is envisaged that the proposed system would be integrated into conventional monitoring systems informing location, protection order and power flow, to provide additional context for comprehensive post-fault analysis.
REFERENCES
[1] J. A. Wischkaemper, C. L. Benner, B. D. Russell, and K. Manivannan, “Application of Waveform Analytics for Improved Situational Awareness of Electric Distribution Feeders,” IEEE Trans. Smart Grid, vol. 6, no. 4, pp. 2041–2049, 2015.
[2] K. M. Manivannan, “Power Distribution System Event Classification Using Fuzzy Logic,” University of Texas A&M, 2012.
[3] C. Rudin et al., “Machine Learning for the New York City Power Grid,” IEEE Trans. Pattern Anal. Mach. Intell., vol. 34, no. 2, pp. 328–345, 2012.
[4] EATON, “Blackout Tracker United Kingdom Annual Report 2015,” 2015.
[5] B. D. Russell and C. L. Benner, “Intelligent Systems for Improved Reliability and Failure Diagnosis in Distribution Systems,” IEEE Trans. Smart Grid, vol. 1, no. 1, pp. 48–56, 2010.
[6] IEEE Working Group on Power Quality Data Analytics, “Electrical Signatures of Power Equipment Failures Electric Signature Analytics for Equipment Condition Monitoring,” 2016.
[7] B. Li, Y. Jing, and W. Xu, “A Generic Waveform Abnormality Detection Method for Utility Equipment Condition Monitoring,”
IEEE Trans. Power Deliv., vol. 32, no. 1, pp. 162–171, 2017. [8] R. P. Adams and D. J. C. MacKay, “Bayesian Online Changepoint
Detection,” 2007.
[9] A. Hindle, M. W. Godfrey, and N. A. Ernst, “Automated Topic Naming to Support Cross-project Analysis of Software Maintenance Activities,” in Proceedings of the 8th Working Conference on Mining Software Repositories, 2011, pp. 163–172.
[10] X. Qin, P. Wang, Y. Liu, L. Guo, and G. Sheng, “Research on Distribution Network Fault Recognition Method Based on Time-Frequency Characteristics of Fault Waveforms,” IEEE Access, vol. 6, pp. 7291–7300, 2018.
[11] L. Xu and M.-Y. Chow, “A Classification Approach for Power Distribution Systems Fault Cause Identification,” IEEE Trans. Power Syst., vol. 21, no. 1, pp. 53–60, 2006.
[12] W. Zhang, Y. Jing, and X. Xiao, “Model-Based General Arcing Fault Detection in Medium-voltage Distribution Lines,” IEEE Trans. Power Deliv., vol. 31, no. 5, pp. 2231–2241, 2016. [13] EPRI, “DOE/EPRI National Database Repository of Power System
Events.” [Online]. Available:
http://pqmon.epri.com/disturbance_library/.[Accessed: 23-Jun-2017].
Table III Confusion matrix of fault diagnosis with expert generated labels (83% overall accuracy), T – Tree, A – Animal,
L – Lightning, V – Vehicle, E – Equipment Actual
Fault T E A V L
T 8 1 1 1 0
E 2 10 1 0 1
A 0 0 11 0 0
V 0 0 0 0 0
[image:5.612.312.560.153.671.2]L 0 0 0 0 5
Table IV Confusion matrix of fault diagnosis with automatically generated labels (78% overall accuracy), T – Tree, A – Animal,
L – Lightning, V – Vehicle, E – Equipment Actual
Fault T E A V L
T 9 0 1 1 0
E 6 7 1 0 0
A 0 0 11 0 0
V 0 0 0 0 0