City, University of London Institutional Repository
Citation
:
Pozarickij, A., Williams, C., Hysi, P. G., Guggenheim, J. A., Aslam, T., Barman,
S. A., Barrett, J. H., Bishop, P., Blows, P., Bunce, C., Carare, R. O., Chakravarthy, U., Chan,
M., Chua, S. Y. L., Crabb, D. P. ORCID: 0000-0001-8754-3902, Cumberland, P. M., Day, A.,
Desai, P., Dhillon, B., Dick, A. D., Egan, C., Ennis, S., Foster, P., Fruttiger, M., Gallacher, J.
E. J., Garway-Heath, D. F., Gibson, J., Gore, D., Hammond, C. J., Hardcastle, A., Harding,
S. P., Hogg, R. E., Keane, P. A., Khaw, S. P. T., Khawaja, A. P., Lascaratos, G., Lotery, A. J.,
Mac Gillivray, T., Mackie, S., Martin, K., McGaughey, M., McGuinness, B., McKay, G. J.,
McKibbin, M., Mitry, D., Moore, T., Morgan, J. E., Muthy, Z. A., O’Sullivan, E., Owen, C. G.,
Patel, P., Paterson, E., Peto, T., Petzold, A., Rahi, J. S., Rudnikca, A. R., Self, J.,
Sivaprasad, S., Steel, D., Stratton, I., Strouthidis, N., Sudlow, C., Thomas, D., Trucco, E.,
Tufail, A., Vitart, V., Vernon, S. A., Viswanathan, A. C., Williams, K., Woodside, J. V., Yates,
M. M., Yip, J. and Zheng, Y. (2019). Quantile regression analysis reveals widespread
evidence for gene-environment or gene-gene interactions in myopia development.
Communications Biology, 2(1), 167.. doi: 10.1038/s42003-019-0387-5
This is the accepted version of the paper.
This version of the publication may differ from the final published
version.
Permanent repository link:
http://openaccess.city.ac.uk/id/eprint/22744/
Link to published version
:
http://dx.doi.org/10.1038/s42003-019-0387-5
Copyright and reuse:
City Research Online aims to make research
outputs of City, University of London available to a wider audience.
Copyright and Moral Rights remain with the author(s) and/or copyright
holders. URLs from City Research Online may be freely distributed and
linked to.
ARTICLE
Quantile regression analysis reveals widespread
evidence for gene-environment or gene-gene
interactions in myopia development
Alfred Pozarickij
1
, Cathy Williams
2
, Pirro G. Hysi
3,4
, Jeremy A. Guggenheim
1
& UK Biobank Eye and Vision Consortium
#A genetic contribution to refractive error has been con
fi
rmed by the discovery of more than
150 associated variants in genome-wide association studies (GWAS). Environmental factors
such as education and time outdoors also demonstrate strong associations. Currently
how-ever, the extent of gene-environment or gene-gene interactions in myopia is unknown. We
tested the hypothesis that refractive error-associated variants exhibit effect size
hetero-geneity, a hallmark feature of genetic interactions. Of 146 variants tested, evidence of
non-uniform, non-linear effects were observed for 66 (45%) at Bonferroni-corrected signi
fi
cance
(
P
< 1.1 × 10
−4) and 128 (88%) at nominal signi
fi
cance (
P
< 0.05).
LAMA2
variant
rs12193446, for example, had an effect size varying from
−
0.20 diopters (95% CI
−
0.18 to
−
0.23) to
−
0.89 diopters (95% CI
−
0.71 to
−
1.07) in different individuals. SNP effects were
strongest at the phenotype extremes and weaker in emmetropes. A parsimonious
explana-tion for these
fi
ndings is that gene-environment or gene-gene interactions in myopia are
pervasive.
https://doi.org/10.1038/s42003-019-0387-5
OPEN
1School of Optometry & Vision Sciences, Cardiff University, Cardiff CF24 4HQ, UK.2Population Health Sciences, Bristol Medical School, University of Bristol,
Bristol BS8 2BN, UK.3Department of Ophthalmology, King’s College London, St. Thomas’Hospital, London SE1 7EH, UK.4Department of Twin & Genetic
Epidemiology, King’s College London, St. Thomas’Hospital, London SE1 7EH, UK.#A full list of consortium members appears at the end of the paper. Correspondence and requests for materials should be addressed to J.A.G. (email:[email protected])
COMMUNICATIONS BIOLOGY| (2019) 2:167 | https://doi.org/10.1038/s42003-019-0387-5 | www.nature.com/commsbio 1
123456789
T
he prevalence of refractive error has doubled in several
parts of the world in the past few decades
1–3. By 2050 it is
predicted that 50% of the world population will be myopic
(near-sighted), with 4.8 billion individuals affected
4. Myopia is
associated with axial elongation of the eye, which increases the
risk of retinal detachment, myopic maculopathy, glaucoma, and
other pathological complications, making it an increasingly
common cause of visual impairment and blindness
5–7.
Suscept-ibility to myopia is determined both by genetic and
environ-mental factors. Genome-wide association studies (GWAS) have
identi
fi
ed ~150 genetic variants associated with refractive
error
8–11, including some overlap with monogenic disease gene
loci
12. The time children spend outdoors, time performing
near-viewing tasks, and the number of years in education are also
strongly associated with myopia development
13–20.
In conventional GWAS analyses of quantitative traits, it is
assumed that each copy of a genetic variant shifts the phenotype
by the same amount in all individuals, i.e. genetic effect sizes are
assumed to be uniform. This assumption feeds forward into
metrics such as SNP-heritability, and polygenic risk scores (PRS)
used for genetic prediction. However, loci with gene-gene (GxG)
or gene-environment (GxE) interactions will violate this
assumption: for these loci the (marginal) effect size of a variant
varies from person to person, depending on their genotype at
other loci or their environmental exposure pro
fi
le (for variants
involved in GxG and GxE interactions, respectively). Accordingly,
a number of elegant studies have used evidence of a non-uniform
effect size across individuals as a
‘signature’
to identify GxG or
GxE interaction loci
21–24. A major advantage of this approach is
that it does not require the identity of the environmental risk
factor underlying a GxE effect to be pre-speci
fi
ed or measured,
nor the identity of the second genetic variant to be known when
detecting GxG interactions. Instead, the presence of GxG or GxE
interaction can be inferred using only genotype information for a
genetic marker and phenotype information for the trait of
interest.
Since GxE effects are implicated in myopia susceptibility
25–28,
and yet currently very few such interacting variants have been
discovered, we aimed to comprehensively assess the known
genetic variants associated with refractive error for involvement
in interactions by testing for this
‘signature’
of non-uniform
genetic effect sizes across individuals. We compared our results
for refractive error with those for height, a highly polygenic trait
with little or no evidence of gene-environment or gene-gene
interactions.
Results
In the sample of 72,985 unrelated, European-ancestry participants
whose genotype data passed quality control and had phenotype
information available, the mean ± SD refractive error was
−
0.25 ±
2.67 diopters (D) and the average age was 57.8 ± 7.8 years.
We assessed 146 genetic variants that showed genome-wide
signi
fi
cant association (
p
< 5 × 10
−8) with refractive error in a
recent meta-analysis carried out by the CREAM Consortium and
23andMe and that showed evidence of independent replication in
the UK Biobank sample
11. We coded the risk allele as the allele
associated with a more negative refractive error.
Conventional ordinary least squares (OLS) analysis
. A
stan-dard, ordinary least squares (OLS) linear regression analysis of
SNP effects under the assumption of constant effect size across all
individuals produced very similar results to those reported
pre-viously in UK Biobank participants
11(Supplementary Data 1). Of
the 146 variants tested, the strongest effect was for rs12193446
near
LAMA2
, which was associated with a
−
0.43 D more negative
refractive error (95% CI from
−
0.39 to
−
0.48,
p
=
1.1 × 10
−77).
Conditional quantile regression and meta-regression
(CQR-MR)
. Figure
1
illustrates the CQR-MR analysis process, and
contrasts it with OLS regression. Whereas an OLS model seeks to
minimize the sum of squared residuals between data points and
the mean effect for each genotype class (AA, AB, and BB), a
quantile regression model seeks to minimize the absolute
resi-duals at a speci
fi
c quantile of trait distribution for each genotype
class. Crucially, unlike OLS regression, CQR allows a variant’s
genetic effect size to vary between individuals, depending on their
position in the trait distribution (Fig.
1
).
The type I error rate and statistical power of CQR-MR were
investigated (see Methods) and full results are presented in
the Supplementary Notes 1 and 2. The main
fi
nding was a
systematic in
fl
ation of the type I error rate of CQR-MR that was
independent of MAF (Supplementary Fig. 1), but that this could
be readily corrected using a
‘genomic control’
approach. This
correction was applied in all of the results presented below. The
statistical power of CQR-MR varied depending on the number of
different quantiles included in the meta-regression. The use of 9
quantiles spaced equally at 0.1 intervals was found to perform
well (Supplementary Fig. 1) and hence was applied in all of the
present analyses.
Widespread evidence of non-uniform effects sizes
. CQR-MR
was used to determine if effect sizes for the 146 refractive
error-associated variants differed across individuals depending on their
position (i.e. their quantile) in the refractive error distribution.
Nearly all variants exhibited an inverse-U shaped effect size
pro
fi
le, with the strongest effect size in individuals at the extremes
of the refractive error distribution and a minimum effect size in
emmetropic participants near the center of the distribution.
Representative results are presented in Fig.
2
(results for all
var-iants are shown in Supplementary Fig. 2). For instance, for
rs12193446 (
LAMA2
), which had the strongest effect in the
conventional OLS analysis, the effect size varied from
−
0.20 D
(95% CI from
−
0.18 to
−
0.23) for individuals near the centre of
the trait distribution to
−
0.89 D (95% CI from
−
0.71 to
−
1.07)
for the most highly myopic individuals (Fig.
1
). Exceptions to the
inverse-U shaped effect size pattern were observed for variants
such as rs1649068 (
BICC1
) and rs9388766 (
L3MBTL3
), which
displayed non-constant, yet nearly linear changes in effect size
across quantiles of the refractive error distribution, along with
SNPs such as rs9680365 (
GRIK1
) and rs7449443 (
FLJ16171-DRD1
), which had essentially
fl
at effect size pro
fi
les similar to
those obtained under the OLS assumption of a constant effect size
in all individuals.
Quantitative analysis of non-uniform effects
. We used a
3-parameter model to quantify the non-uniformity of effect sizes (see
Methods). After correcting for multiple-testing by applying a
Bon-ferroni adjusted
p
-value threshold of 0.05/(3 × 146)
=
1.1 × 10
−4, a
total of 66 (45%) of the variants showed signi
fi
cant non-uniform
effects, i.e.
p
< 1.1 × 10
−4for the
β
1
(linear) or
β
2(quadratic) model
coef
fi
cients (Table
1
and Supplementary Data 2). Thus, 45% of the
genetic variants showed statistically signi
fi
cant evidence of differing
effect sizes depending where in the refractive error distribution an
individual lay, suggestive of the variant’s involvement in either a
gene-gene or gene-environment interaction. For the rs12193446
(
LAMA2
) variant,
p
=
2.12 × 10
−36for the
β
1component, and
p
=
1.19 × 10
−30for the
β
2
component. Notably, only 18 (12%) of
the variants failed to show at least nominal evidence of an
inter-action effect (i.e.
β
1component and
β
2component,
p
> 0.05).
For comparison, an analogous set of analyses to those
performed above were carried out for genome-wide signi
fi
cant
variants associated with height. For height, only 6% of variants
(nine out of 148) displayed at least nominal evidence of a
non-uniform effect size (Supplementary Note 3, Supplementary Data 3
and 4, and Supplementary Fig. 2).
Polygenic risk score interaction with educational attainment
.
We used the 146 refractive error-associated variants to create a
polygenic risk score (PRS) and examined whether this too
exhibited a non-uniform effect size in different individuals. As
shown in Fig.
3
, the PRS effect size displayed the inverted-U
pattern across quantiles of the trait distribution as was observed
10
0
–10
–0.25
–0.50
–0.75
–1.00
–0.25
–0.50
–0.75
–1.00
0.1 0.3 0.5 0.7 0.9
0.3 0.5 Refractive error quantile
Refractive error quantile
Genetic eff
ect siz
e
(diopetrs per cop
y of r
isk allele)
Genetic eff
ect siz
e
(diopetrs per cop
y of r
isk allele)
0.7 0.9 0.1
Refr
activ
e error (diopters)
–20
0 1
LAMA2(rs12193446) genotype
OLS model: OLS = –0.43 diopters
MR model: 1 + 2 + 3 + e
CQR model: CQR [0.9] = –0.35 diopters
CQR model: CQR [0.5] = –0.22 diopters
CQR model: CQR [0.1] = –0.87 diopters
2
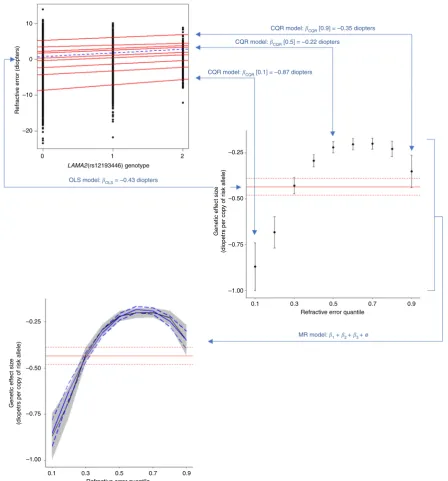
Fig. 1Conditional quantile regression (CQR) and meta-regression (MR) can identify if genetic effect size varies in individuals depending on their position in the trait distribution. In conventional ordinary least squares (OLS) linear regression, SNP effect size is estimated under the assumption that it is the same for every person in the sample. Thus, the effect size is calculated as the slope of the regression line (dashed blue line in top-left graph) obtained by minimizing the sum of squared residuals between data points and the mean, for each genotype class (0, 1 or 2 copies of the minor allele). Alternatively, in CQR, the SNP effect size is estimated at a specific quantile of the outcome distribution. Analogous to OLS, the effect size is calculated as the slope of the quantile regression line (in the top-left graph, the nine red lines correspond to quantile regressionfits for quantiles 0.1, 0.2, 0.3,…, 0.9 of the trait distribution). For the variant shown, rs12193446, the effect size (slope) differs for individuals in different quantiles of the trait distribution; this can be visualized more readily by plotting the effect size at each quantile (black circles with error bars in middle-right graph). OLS analysis assumes the effect size is constant across quantiles of the trait distribution (horizontal red line in middle-right graph, with dotted red lines indicating 95% CI). After using CQR to estimate the SNP effect size at a range of quantiles, the uniformity of the SNP effect sizes can be quantitatively assessed using MR (solid blue line in bottom-left graph, with dashed blue lines showing 95% CI)
COMMUNICATIONS BIOLOGY | https://doi.org/10.1038/s42003-019-0387-5
ARTICLE
[image:5.595.74.523.48.530.2]for the majority of individual SNPs. In addition, the PRS effect
size differed across educational attainment strata. For participants
from the myopic tail of the refractive error distribution, more
time spent in education was associated with a larger PRS effect
size. For example for those in refractive error quantile 0.1, a 1 SD
increase in PRS was associated with a
−
0.82 D (95% CI from
−
0.73 to
−
0.90) more negative refractive error in the lowest
educational stratum, yet a
−
1.11 D (95% CI from
−
1.02 to
−
1.18) more negative refractive error for those in the highest
education
stratum
(
p
=
8.9 × 10
−83and
p
=
1.17 × 10
−155,
respectively). The largest change in PRS effect size due to such an
interaction with education was 0.57 D (at quantile 0.2). The PRS
effect size difference associated with educational attainment was
smallest in emmetropes. For example, the PRS effect size was
within a narrow range of
−
0.25 to
−
0.37 D for participants in
quantile 0.6, irrespective of their level of education. For
partici-pants in the hyperopic tail of the refractive error distribution
(quantiles > 0.8), the PRS effect size was smaller in those with
greater educational attainment, opposite to the relationship seen
in the myopic tail. Thus, for example, for hyperopic participants
in quantile 0.9, a 1 SD reduction in PRS was associated with a
+0.62 D (95% CI from
+0.55 to
+0.69) effect on refractive
error in those in the lowest education stratum, yet only a
+0.41 D
(95% CI from
+0.38 to
+0.44) effect in those from the highest
education stratum (
p
=
6.55 × 10
−68and
p
=
9.53 × 10
−193,
respectively).
Discussion
Evidence of effect size heterogeneity—a signature of involvement
in GxG or GxE interactions—was found for 88% of the refractive
−0.2 −0.1 0.0 (rs7662551) LOC100506035_PCAT4 −0.20 −0.15 −0.10 −0.05 (rs11723482) PCAT4_ANTXR2 −0.3 −0.2 −0.1 (rs7747) ANTXR2 −0.5 −0.4 −0.3 −0.2 −0.1 0.0 (rs79953651) ANTXR2 −0.20 −0.15 −0.10 −0.05 (rs1994840) C4orf22 −0.2 −0.1 (rs7667446) C4orf22_BMP3 −0.3 −0.2 −0.1 (rs10003846) C4orf22_BMP3 −0.6 −0.4 −0.2 (rs74764079) BMP3 −0.20 −0.15 −0.10 −0.05 (rs2166181) RASGEF1B_U6 −0.10 −0.05 0.00 0.05 (rs11952819) ZNF366 −0.25 −0.20 −0.15 −0.10 −0.05 0.00 (rs7737179) TMEM161B−AS1_LINC00461 −0.05 0.00 0.05 (rs7449443) FLJ16171_DRD1 −0.20 −0.15 −0.10 −0.05 0.00 (rs10458138) LOC100508120 −0.20 −0.15 −0.10 −0.05 (rs9295499) CDKAL1 −0.15 −0.10 −0.05 (rs1207782) LINC00340 −0.15 −0.10 −0.05
0.2 0.4 0.6 0.8 0.2 0.4 0.6 0.8 0.2 0.4 0.6 0.8 0.2 0.4 0.6 0.8
0.2 0.4 0.6 0.8 0.2 0.4 0.6 0.8 0.2 0.4 0.6 0.8 0.2 0.4 0.6 0.8
0.2 0.4 0.6 0.8 0.2 0.4 0.6 0.8 0.2 0.4 0.6 0.8 0.2 0.4 0.6 0.8
0.2 0.4 0.6 0.8 0.2 0.4 0.6 0.8 0.2 0.4 0.6 0.8 0.2 0.4 0.6 0.8 (rs1928175)
LINC00340
Refractive error quantile
Genetic effect size (diopters per copy of the risk allele)
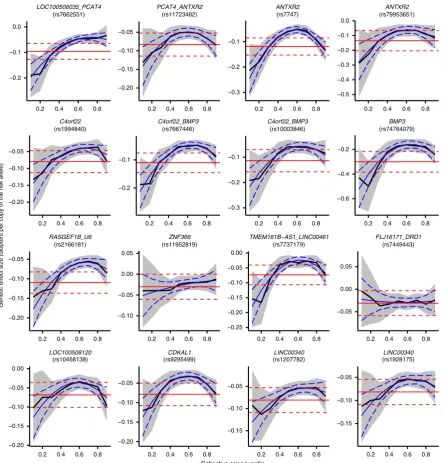
Fig. 2Changes in genetic effect size across the refractive error distribution for a representative subset of genetic variants associated with refractive error. Genetic effect size estimates from conditional quantile regression (CQR) are represented by the solid black line and their 95% confidence intervals are shown by the shaded grey region. The solid red line is the effect size estimate from conventional linear regression analysis with its 95% confidence intervals shown by the red dashed lines. Effect size estimates from meta-regression are shown with the solid blue line with corresponding 95% confidence intervals given by the dashed blue lines
[image:6.595.79.524.47.511.2]error-associated variants tested. Furthermore, the impact of this
phenomenon was dramatic: genetic effect sizes were as much as
four-fold higher in certain individuals compared to others.
Pre-vious studies of refractive error genetics have always assumed that
genetic effect sizes are the same in every person in the sample,
and thus this important source of inter-individual variation has
remained hidden.
Refractive error-associated variants typically had inverse-U
shaped effect size pro
fi
les, with the strongest effects observed at
the phenotype extremes, and effects closer to zero in emmetropes.
Very few SNPs had constant effects across all quantiles of the
sample distribution that matched those assumed in conventional
analyses. One potential explanation for these
fi
ndings is the
process of
‘emmetropization’, in which the rate of axial eye
elongation during infancy is
fi
ne-tuned by a visual feedback loop
in order to maintain a sharp retinal image
29. We speculate that
emmetropization may act as a buffer against the myopia- or
hyperopia-predisposing effects of genetic risk variants. Thus,
suppose that, during childhood, a myopia-predisposing risk allele
led to a small increase in axial eye length. This might
subse-quently be countered by a slowing of the rate of axial elongation
via visually-mediated feedback. Furthermore, suppose there exists
a limit to the amount of axial elongation that the
emmetropiza-tion system can compensate for (as has been proposed for the
axial elongation-countering effects of crystalline lens thinning
30)
then in those individuals whose emmetropization limit is
sur-passed, genetic variants would have free reign to attain much
higher effects than in those individuals whose emmetropization
limit is not exceeded. Finding evidence to support a direct role for
emmetropization in causing the observed genetic effect size
het-erogeneity of refractive error-associated variants would likely
require studies in animal models; the recent discovery of a genetic
locus for susceptibility to visually-induced myopia is a
fi
rst step in
this direction
31.
Prior to this work, only a handful of speci
fi
c GxE interactions,
and no GxG interactions had been reported for refractive error
25–28.
The current work suggests that such interaction effects are likely to
be widespread. Applying our same analysis methods to a different
trait, height, yielded far fewer variants with signatures of a GxG or
GxE interaction (6% for height vs. 88% for refractive error). Given
that height and axial eye length share genetic determinants in
common (genetic correlation 0.1–0.2)
32,33, it would be interesting to
examine genetic effect sizes across quantiles of the axial length
distribution, for example in samples of emmetropes and myopes.
The PRS
fi
ndings con
fi
rmed the dramatic difference in
phenotypic effect exerted by refractive error-associated genetic
variants in different individuals, which contrasts starkly with the
simple deterministic effects expected of high risk genotypes.
Individuals who reached adulthood as emmetropes appeared to
have been
‘buffered’
against their genetic risk burden, and thus
genetic effect sizes in these individuals were correspondingly
small. By contrast, genetic effect sizes were often several-fold
larger in individuals who became highly myopic or highly
hyperopic by the time they reached adulthood. Time spent in
education appeared to further modify the phenotypic effects of
risk SNPs.
Our strategy for detecting inter-individual differences in
genetic effect sizes was based on a statistical test for variance
heterogeneity across genotypes. While variance heterogeneity is a
signature of GxG and GxE interactions
21,34–36, it is not the only
cause. Parent-of-origin effects will give rise to increased variance
heterogeneity in heterozygous individuals at loci in which the
effect size varies dependent on which parent transmitted the risk
allele
34. Similarly,
‘genetic nurture’, whereby untransmitted alleles
in parents (as well as transmitted alleles) in
fl
uence the
pheno-type
37may also lead to variance heterogeneity. For example, if the
environment of the child is partly determined by the parents’
genotype, then risk alleles inherited by the child will potentially
show interactions with untransmitted parental alleles, i.e. an
inter-generational GxG interaction mediated via a GxE
interac-tion for the child. Allelic heterogeneity, whereby multiple
geno-types in linkage disequilibrium in
fl
uence the same phenotype, can
also give rise to variance heterogenity
38–40. Finally, examples of
genetic variants with striking inter-individual genetic effect
het-erogeneity exist for which mechanistic explanations are currently
lacking or incomplete. For instance, rs3825942 in
LOXL1
is
associated with an increased risk of exfoliation syndrome in
certain populations, but a reduced risk in others
41(so called risk
allele
‘
fl
ipping’), and rs6817105 near
PITX2
is associated with an
~1.6-fold increased risk of atrial
fi
brillation overall; however, the
level of risk varies widely across populations
42. Explanations
based on simple GxG or GxE interactions have not been able
to account for the observed effect size heterogeneity at these
loci
41,42.
[image:7.595.45.552.82.196.2]To conclude, our study provides evidence that most of the
currently-known refractive error-associated variants have
differ-ent effect sizes in differdiffer-ent individuals. A parsimonious
expla-nation is that the variants are involved in GxG or GxE
interactions. The phenotypic effect imparted by risk alleles was
found to vary as much as four-fold, with greater effects observed
for individuals in the phenotype extremes compared to those in
the center. This variation in inter-individual effects remains
hidden when conventional analysis methods are used to detect
genetic effects. Widespread GxG or GxE interactions will
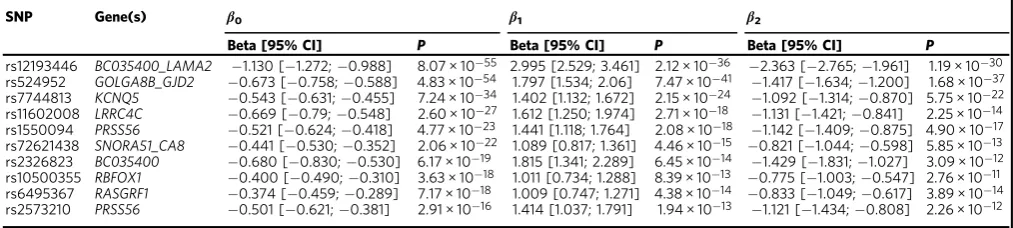
Table 1 Summary statistics for the 10 strongest associations with refractive error based on conditional quantile
regression-meta-regression (CQR-MR)
SNP Gene(s) β0 β1 β2
Beta [95% CI] P Beta [95% CI] P Beta [95% CI] P
rs12193446 BC035400_LAMA2 −1.130 [−1.272;−0.988] 8.07 × 10−55 2.995 [2.529; 3.461] 2.12 × 10−36 −2.363 [−2.765;−1.961] 1.19 × 10⁻³⁰ rs524952 GOLGA8B_GJD2 −0.673 [−0.758;−0.588] 4.83 × 10−54 1.797 [1.534; 2.06] 7.47 × 10−41 −1.417 [−1.634;−1.200] 1.68 × 10−37 rs7744813 KCNQ5 −0.543 [−0.631;−0.455] 7.24 × 10⁻³⁴ 1.402 [1.132; 1.672] 2.15 × 10⁻²⁴ −1.092 [−1.314;−0.870] 5.75 × 10⁻²² rs11602008 LRRC4C −0.669 [−0.79;−0.548] 2.60 × 10⁻²⁷ 1.612 [1.250; 1.974] 2.71 × 10⁻¹⁸ −1.131 [−1.421;−0.841] 2.25 × 10⁻¹⁴ rs1550094 PRSS56 −0.521 [−0.624;−0.418] 4.77 × 10⁻²³ 1.441 [1.118; 1.764] 2.08 × 10⁻¹⁸ −1.142 [−1.409;−0.875] 4.90 × 10⁻¹⁷ rs72621438 SNORA51_CA8 −0.441 [−0.530;−0.352] 2.06 × 10⁻²² 1.089 [0.817; 1.361] 4.46 × 10⁻¹⁵ −0.821 [−1.044;−0.598] 5.85 × 10⁻¹³ rs2326823 BC035400 −0.680 [−0.830;−0.530] 6.17 × 10⁻¹⁹ 1.815 [1.341; 2.289] 6.45 × 10⁻¹⁴ −1.429 [−1.831;−1.027] 3.09 × 10⁻¹² rs10500355 RBFOX1 −0.400 [−0.490;−0.310] 3.63 × 10⁻¹⁸ 1.011 [0.734; 1.288] 8.39 × 10⁻¹³ −0.775 [−1.003;−0.547] 2.76 × 10⁻¹¹ rs6495367 RASGRF1 −0.374 [−0.459;−0.289] 7.17 × 10⁻¹⁸ 1.009 [0.747; 1.271] 4.38 × 10⁻¹⁴ −0.833 [−1.049;−0.617] 3.89 × 10⁻¹⁴ rs2573210 PRSS56 −0.501 [−0.621;−0.381] 2.91 × 10⁻¹⁶ 1.414 [1.037; 1.791] 1.94 × 10⁻¹³ −1.121 [−1.434;−0.808] 2.26 × 10⁻¹²
Confidence intervals andp-values have been corrected for the inflated type I error rate of CQR-MR
SNPsingle nucleotide polymorphism,CHRchromosome,BPbase pair,EAeffect allele,β0meta-regression intercept effect size in diopters per copy of the risk allele,β1andβ2meta-regression coefficients for the linear and quadratic terms, respectively,CIconfidence interval
COMMUNICATIONS BIOLOGY | https://doi.org/10.1038/s42003-019-0387-5
ARTICLE
contribute to the
‘missing heritability’
for refractive error, and
adversely impact the accuracy of genetic prediction of children
at-risk of developing myopia.
Methods
Study participants and quality control. The UK Biobank project is an ongoing cohort study of ~500,000 UK adults aged 40–70-years-old when recruited (2006–2010)43. Ethical approval for the study was obtained from the National
Health Service National Research Ethics Service (Ref 11/NW/0382) and all parti-cipants provided written informed consent. Partiparti-cipants provided a blood sample, from which DNA was extracted and genotyped using either the UK BiLEVE Axiom array or the UK Biobank Axiom Array44. We analysed data from the July 2016 data
release for genetic variants in 488,377 individuals imputed to the HRC45
reference panel.
Participants self-reported whether they had a university or college degree. An ophthalmic assessment was introduced towards the latter stages of UK Biobank recruitment, hence only about 25% of participants were examined. Refractive error was measured using non-cycloplegic autorefraction (Tomey RC5000; Tomey GmbH Europe, Erlangen-Tennenlohe, Germany). The mean spherical equivalent (MSE) refractive error was calculated as the sphere power plus half the cylinder power, and averaged between the two eyes (avMSE). Individuals who self-reported any of the following eye disorders were excluded from the analyses: cataracts,
“serious eye problems”,“eye trauma”, a history of cataract surgery, corneal graft surgery, laser eye surgery, or other eye surgery in the past 4 weeks. Individuals whose hospital records (ICD10 codes) indicated a history of the following were also excluded: cataract surgery, eye surgery, retinal surgery, or retinal detachment surgery. Of 488,377 individuals with genetic information, samples were excluded due to: ocular history (n=48,145, see above), withdrawal of consent (n=8), self-report of non-white British ethnicity or genetic principal components indicative of non-European ancestry (n=69,938), outlying level of genetic heterozygosity (n=648), or refractive error not measured (n=283,352). The remaining 86,286 individuals were tested for relatedness using the --rel-cutoff command in PLINK v1.946. A genetic relationship matrix was created using a linkage disequilibrium
(LD)-pruned set of well-imputed variants (with IMPUTE2r2> 0.9, minor allele
frequency (MAF) > 0.005, missing rate≤0.01, and‘rs’variant ID prefix). LD-pruning was accomplished by using the --indep-pairwise 50 5 0.1 command in PLINK v246. One member of each pair with genomic relatedness greater than 0.025
was excluded. This resulted in afinal sample size of 72,985 unrelated individuals of European ancestry.
Selection of genetic variants
Variants associated with refractive error. We originally assessed 149 genetic variants
that showed genome-wide significant association (p< 5 × 10⁻⁸) with refractive
error in the CREAM Consortium and 23andMe meta-analysis and that replicated
in a UK Biobank sample11. The risk allele was coded as the allele associated with a
more negative refractive error. Of the 149 genetic variants tested, reliable results could be obtained for 146 (for rs74764079, rs73730144, and rs17837871, with MAFs of 3%, 1% and 1%, respectively, there were fewer than 50 participants homozygous for the minor allele; hence these variants were excluded).
Variants associated with height. For comparison, we also examined genetic variants
associated with height. GWAS summary statistics were obtained from Wood et al.38. We restricted our analyses to the 149 genetic variants with the strongest
association (i.e. those with the lowestp-values). Reliable results could be obtained for 148 height SNPs (Supplementary Note 3).
Statistical analysis. A‘conventional’OLS regression analysis was carried out to quantify the effect size of each of the 146 variants under the assumption of a constant effect size across the full sample. Refractive error averaged between the two eyes (avMSE) was the dependent variable and genotype, age, age-squared, sex, and a binary variable indicating genotyping array werefitted as covariates. Con-ditional quantile regression (CQR)47was carried out using thequantregpackage
v5.36 in R version 3.5.1, using the same set of covariates as above. We used 10,000 Markov-chain-marginal-bootstrap replicates to calculate standard errors. As a sensitivity analysis, we also tested linear regression and quantile regression models with thefirst 10 principal components included as covariates. However, including principal components in the models did not change parameter estimates sub-stantially, hence only the results of the original analyses are reported.
SNP effect estimates and their standard errors from quantile regression at 9 different quantiles (0.1, 0.2, 0.3,…, 0.9) were meta-regressed using a mixed-effects model (metaforpackage v2.0.0 in R48) with the estimated SNP effect at each
quantile modelled as the dependent variable and the quantile at which these estimates were obtained as the independent variable. A term for quantile-squared was also included in the meta-regression model to test for non-linear genetic effects across quantiles, resulting in the model:y=β0+β1q+β2q2+e(where,β0is an
intercept term,β1andβ2are coefficients describing the linear and quadratic change
in SNP effect across quantiles of the trait distribution, respectively,qare the quantiles, andeis the error term). Figure1illustrates the conditional quantile regression and meta-regression modelfitting strategy.
Permutation-based assessment of type I error rate and power. To assess the type I error and power of the CQR-MR model we used the gold-standard method of permutation. The type 1 error rate was assessed in two ways. Firstly, we simulated genotypes for‘null’SNPs and tested for an association between the true phenotype and the null SNP genotype. Secondly, we permuted phenotype values amongst individuals in the sample, and tested for an association between the null phenotype and the observed (true) SNP genotypes.
Null phenotype: TheavMSEphenotype of the 72,985 individuals in the analysis
sample was permuted 100 times. For each permutation, the association between the null phenotype and the genotype of each of the 149 variants was assessed using CQR-MR. The type 1 error rate was calculated as the proportion of SNPs with
P< 0.05 for each of the three meta-regression coefficients (β0,β1, andβ2) from the
total of (100 × 149)=14,900 permutations.Null SNPs:The 72,985 individuals in our analysis sample were independently assigned genotypes for a biallelic SNP with MAF ranging from 0.05 to 0.45, simulated from a binomial distribution. Association betweenavMSEand the genotype of the null SNP was assessed using CQR-MR. The type 1 error rate was calculated as the proportion of SNPs with
P< 0.05 for each of the three meta-regression coefficients (β0,β1, andβ2) after
simulating 10,000 null SNPs.
To obtain a relative indication of statistical power, the 149 refractive error-associated variants were tested for association with the observedavMSEphenotype in samples of varying size. Specifically, from the full sample of 72,985 individuals, we selected a random sample of 10,000–70,000 individuals, in steps of 10,000, and tested each of the 149 variants for association. This procedure was repeated 20 times. Power was computed as the proportion of replicates in which the null hypothesis was rejected at a nominal significance level ofα=0.05 (i.e. under the assumption that all 149 variants truly had non-linear effect sizes across quantiles). The total number of tests used for these power evaluations was 149 × 7 × 20= 20,860. The same set of covariates as in original analysis was included in the CQR step when assessing power and type 1 error.
In the analyses described above, CQR-MR was performed by carrying out quantile regression at 9 different quantiles (q=0.1 to 0.9 in steps of 0.1) followed by meta-regression of the resulting genetic effect size estimates. In preliminary work, we explored the effect on type 1 error rate and power of selecting more or fewer than 9 quantiles, by testing: (a) 19 quantiles,q=0.05–0.95 in steps of 0.05; (b) 10 quantiles,q=0.05–0.95 in steps of 0.1; (c) 5 quantiles,q=0.1–0.9 in steps of 0.2. For simplicity, we refer to these CQR-MR models by the number of quantiles included in the meta-regression, i.e. 5, 9, 10, or 19. CQR-MR analysis with 9 quantiles performed optimally (Supplementary Notes and Supplementary Fig. 3).
Gene-environment interaction with education. To test for the presence of gene-environment interaction, we constructed a polygenic risk score (PRS) by counting the number of risk alleles (0, 1, or 2) carried by each individual. We did not weight
−1.25 −1.00 −0.75 −0.50 −0.25
0.1 0.3 0.5 0.7 0.9
Refractive error quantile
Genetic effect size (diopters)
Age at the end of education
13−15 years
16 years
17−20 years
21−26 years
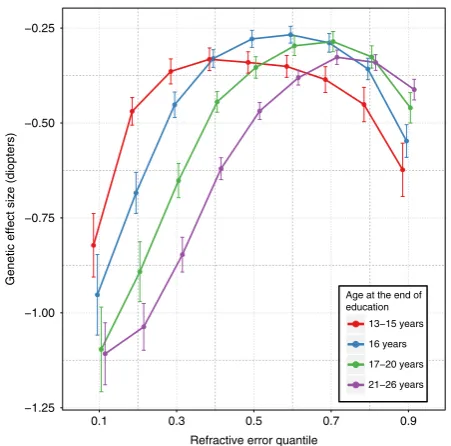
Fig. 3The effect of educational attainment on refractive error varies across quantiles of the refractive error distribution. Each line represents the polygenic risk score (PRS) effect size across quantiles for individuals with different times spent in education. Error bars show 95% confidence intervals
[image:8.595.55.281.47.270.2]these by SNP effect sizes in order to avoid introducing bias by using weights obtained from, and applied in, the same sample (UK Biobank).‘Age completed full-time education’(EduYears) was selected as an exemplar environmental variable. UK Biobank participants with a university degree were not asked the age they completed full-time education, hence these individuals were assumed to have completed their education at the age of 21 years. Age completed education cate-gories with low counts were merged with adjacent catecate-gories, resulting in four
finalEduYearscategories: 13–15, 16, 17–20, and 21–26 years. We carried out a
CQR-MR analysis stratified byEduYearscategory.
Reporting summary. Further information on experimental design is available in the Nature Research Reporting Summary linked to this article.
Data availability
Individual-level data from UK Biobank can be accessed by applying to the UK Biobank Central Access Committee (http://www.ukbiobank.ac.uk/register-apply/).
Code availability
The R code for performing these analyses is available upon request.
Received: 20 December 2018 Accepted: 15 March 2019
References
1. Morgan, I. G., Ohno-Matsui, K. & Saw, S. M. Myopia.Lancet379, 1739–1748 (2012).
2. Rudnicka, A. R. et al. Global variations and time trends in the prevalence of childhood myopia, a systematic review and quantitative meta-analysis: implications for aetiology and early prevention.Br. J. Ophthalmol.100, 882–890 (2016).
3. Vitale, S., Sperduto, R. D. & Ferris, F. L. Increased prevalence of myopia in the United States between 1971–1972 and 1999–2004.Arch. Ophthalmol.127, 1632–1639 (2009).
4. Holden, B. A. et al. Global prevalence of myopia and high myopia and temporal trends from 2000 through 2050.Ophthalmol123, 1036–1042 (2016).
5. Verkicharla, P. K., Ohno-Matsui, K. & Saw, S. M. Current and predicted demographics of high myopia and an update of its associated pathological changes.Ophthalmic Physiol. Opt.35, 465–475 (2015).
6. Wong, Y. L. & Saw, S. M. Epidemiology of pathologic myopia in Asia and worldwide.Asia Pac. J. Ophthalmol.5, 394–402 (2016).
7. Wong, T. Y., Ferreira, A., Hughes, R., Carter, G. & Mitchell, P. Epidemiology and disease burden of pathologic myopia and myopic choroidal
neovascularization: an evidence-based systematic review.Am. J. Ophthalmol.
157, 9–25 (2013).
8. Kiefer, A. K. et al. Genome-wide analysis points to roles for extracellular matrix remodeling, the visual cycle, and neuronal development in myopia.
PLoS Genet.9, e1003299 (2013).
9. Verhoeven, V. J. M. et al. Genome-wide meta-analyses of multiancestry cohorts identify multiple new susceptibility loci for refractive error and myopia.Nat. Genet.45, 314–318 (2013).
10. Pickrell, J. K. et al. Detection and interpretation of shared genetic influences on 42 human traits.Nat. Genet.48, 709–717 (2016).
11. Tedja, M. S. et al. Genome-wide association meta-analysis highlights light-induced signaling as a driver for refractive error.Nat. Genet.50, 834–848 (2018).
12. Wojciechowski, R. Nature and nurture: the complex genetics of myopia and refractive error.Clin. Genet.79, 301–320 (2011).
13. Saw, S.-M., Hong, C.-Y., Chia, K.-S., Stone, R. A. & Tan, D. Nearwork and myopia in young children.Lancet357, 390 (2001).
14. Rose, K. A. et al. Outdoor activity reduces the prevalence of myopia in children.Ophthalmol115, 1279–1285 (2008).
15. Wu, P. C., Tsai, C. L., Wu, H. L., Yang, Y. H. & Kuo, H. K. Outdoor activity during class recess reduces myopia onset and progression in school children.
Ophthalmol120, 1080–1085 (2013).
16. Wu, P. C. et al. Myopia prevention and outdoor light intensity in a school-based cluster randomized trial.Ophthalmol125, 1239–1250 (2018). 17. He, M. et al. Effect of time spent outdoors at school on the development of
myopia among children in china: a randomized clinical trial.JAMA314, 1142–1148 (2015).
18. Tay, M. T., Au Eong, K. G., Ng, C. Y. & Lim, M. K. Myopia and educational attainment in 421,116 young Singaporean males.Ann. Acad. Med. Singap.21, 785–791 (1992).
19. Cuellar-Partida, G. et al. Assessing the genetic predisposition of education on myopia: a mendelian randomization study.Genet. Epidemiol.40, 66–72 (2016).
20. Mountjoy, E. et al. Education and myopia: assessing the direction of causality by mendelian randomisation.BMJ361, k2022 (2018).
21. Paré, G., Cook, N. R., Ridker, P. M. & Chasman, D. I. On the use of variance per genotype as a tool to identify quantitative trait interaction effects: a report from the women’s genome health study.PLoS Genet.6, e1000981 (2010). 22. Beyerlein, A., von Kries, R., Ness, A. R. & Ong, K. K. Genetic markers of
obesity risk: stronger associations with body composition in overweight compared to normal-weight children.PLoS ONE6, e19057 (2011). 23. Williams, P. T. Quantile-specific penetrance of genes affecting lipoproteins,
adiposity and height.PLoS ONE7, e28764 (2012).
24. Abadi, A. et al. Penetrance of polygenic obesity susceptibility loci across the body mass index distribution.Am. J. Hum. Genet.101, 925–938 (2017). 25. Chen, Y. P. et al. Selective breeding for susceptibility to myopia reveals a
gene-environment interaction.Invest. Ophthalmol. Vis. Sci.52, 4003–4011 (2011). 26. Tkatchenko, A. V. et al. APLP2 regulates refractive error and myopia
development in mice and humans.PLoS Genet.11, e1005432 (2015). 27. Fan, Q. et al. Childhood gene-environment interactions and age-dependent
effects of genetic variants associated with refractive error and myopia: The CREAM Consortium.Sci. Rep.6, 25853 (2016).
28. Fan, Q. et al. Education influences the association between genetic variants and refractive error: a meta-analysis offive Singapore studies.Hum. Mol.
Genet.23, 546–554 (2014).
29. Atkinson, J. et al. Normal emmetropization in infants with spectacle correction for hyperopia.Invest. Ophthalmol. Vis. Sci.41, 3726–3731 (2000).
30. Mutti, D. O. et al. Corneal and crystalline lens dimensions before and after myopia onset.Optom. Vis. Sci.89, 251–262 (2012).
31. Huang, Y. et al. A genome-wide association study for susceptibility to visual experience-induced myopia.Invest. Ophthalmol. Vis. Sci.60, 559–569 (2019). 32. Zhang, J. et al. Shared genetic determinants of axial length and height in
children: the Guangzhou twin eye study.Arch. Ophthalmol.129, 63–68 (2011).
33. Guggenheim, J. A. et al. Coordinated genetic scaling of the human eye: Shared determination of axial eye length and corneal curvature.Invest. Ophthalmol.
Vis. Sci.54, 1715–1721 (2013).
34. Struchalin, M. V., Dehghan, A., Witteman, J. C., van Duijn, C. & Aulchenko, Y. S. Variance heterogeneity analysis for detection of potentially interacting genetic loci: method and its limitations.BMC Genet.11, 92 (2010). 35. Zhang, P., Lewinger, J. P., Conti, D., Morrison, J. L. & Gauderman, W. J.
Detecting gene-environment interactions for a quantitative trait in a genome-wide association study.Genet. Epidemiol.40, 394–403 (2016).
36. Sun, X., Elston, R., Morris, N. & Zhu, X. What is the significance of difference in phenotypic variability across SNP genotypes?Am. J. Hum. Genet.93, 390–397 (2013).
37. Kong, A. et al. The nature of nurture: effects of parental genotypes.Science
359, 424–428 (2018).
38. Wood, A. R. et al. Defining the role of common variation in the genomic and biological architecture of adult human height.Nat. Genet.46, 1173–1186 (2014).
39. Forsberg, S. K. G. et al. The multi-allelic genetic architecture of a variance-heterogeneity locus for molybdenum concentration in leaves acts as a source of unexplained additive genetic variance.PLoS Genet.11, e1005648 (2015). 40. Ek, W. E. et al. Genetic variants influencing phenotypic variance
heterogeneity.Hum. Mol. Genet.27, 799–810 (2018).
41. Aung, T. et al. Genetic association study of exfoliation syndrome identifies a protective rare variant at LOXL1 andfive new susceptibility loci.Nat. Genet.
49, 993–1004 (2017).
42. Ellinor, P. T. et al. Meta-analysis identifies six new susceptibility loci for atrial
fibrillation.Nat. Genet.44, 670 (2012).
43. Sudlow, C. et al. UK Biobank: an open access resource for identifying the causes of a wide range of complex diseases of middle and old age.PLoS Med.
12, e1001779 (2015).
44. Bycroft, C. et al. The UK Biobank resource with deep phenotyping and genomic data.Nature562, 203–209 (2018).
45. McCarthy, S. et al. A reference panel of 64,976 haplotypes for genotype imputation.Nat. Genet.48, 1279–1283 (2016).
46. Chang, C. C. et al. Second-generation PLINK: rising to the challenge of larger and richer datasets.Gigascience4, 7 (2015).
47. Koenker, R. & Hallock, K. F. Quantile regression.J. Econ. Perspect.15, 143–156 (2001).
48. Viechtbauer, W. Conducting meta-analyses in R with the metafor package.
J. Stat. Softw.36, 1–48 (2010).
Acknowledgements
This research has been conducted using the UK Biobank Resource (applications #17351). We thank Arkan Abadi and David Meyre (McMaster University) for advice on R codes.
COMMUNICATIONS BIOLOGY | https://doi.org/10.1038/s42003-019-0387-5
ARTICLE
The work was funded by the National Eye Research Centre grant SAC015 (JAG, CW), and an NIHR Senior Research Fellowship award SRF-2015-08-005 (CW). UK Biobank was established by the Wellcome Trust; the UK Medical Research Council; the Department for Health (London, UK); Scottish Government (Edinburgh, UK); and the Northwest Regional Development Agency (Warrington, UK). It also received funding from the Welsh Assembly Government (Cardiff, UK); the British Heart Foundation; and Diabetes UK. Collection of eye and vision data was supported by The Department for Health through an award made by the NIHR to the Biomedical Research Centre at Moorfields Eye Hospital NHS Foundation Trust, and UCL Institute of Ophthalmology, London, United Kingdom (grant no. BRC2_009). Additional support was provided by The Special Trustees of Moorfields Eye Hospital, London, United Kingdom (grant no. ST 12 09). Data analysis was carried out using the RAVEN computing cluster, maintained by the ARCCA group at Cardiff University ARCCA and the BLUE CRYSTAL3 computing cluster maintained by the HPC group at the University of Bristol.
Author contributions
A.P. and J.A.G. conceived and designed the experiments. C.W. and J.A.G. obtained funding. A.P. analysed the data. P.H., C.W. and J.A.G. contributed to interpretation of thefindings. A.P. wrote the manuscript, with contributions from all authors.
Additional information
Supplementary informationaccompanies this paper at
https://doi.org/10.1038/s42003-019-0387-5.
Competing interests:The authors declare no competing interests.
Reprints and permissioninformation is available online athttp://npg.nature.com/ reprintsandpermissions/
Publisher’s note:Springer Nature remains neutral with regard to jurisdictional claims in published maps and institutional affiliations.
Open Access This article is licensed under a Creative Commons Attribution 4.0 International License, which permits use, sharing, adaptation, distribution and reproduction in any medium or format, as long as you give appropriate credit to the original author(s) and the source, provide a link to the Creative Commons license, and indicate if changes were made. The images or other third party material in this article are included in the article’s Creative Commons license, unless indicated otherwise in a credit line to the material. If material is not included in the article’s Creative Commons license and your intended use is not permitted by statutory regulation or exceeds the permitted use, you will need to obtain permission directly from the copyright holder. To view a copy of this license, visithttp://creativecommons.org/
licenses/by/4.0/.
© The Author(s) 2019
UK Biobank Eye and Vision Consortium
Tariq Aslam
5, Sarah A. Barman
6, Jenny H. Barrett
7, Paul Bishop
5, Peter Blows
8, Catey Bunce
9,
Roxana O. Carare
10, Usha Chakravarthy
11, Michelle Chan
8, Sharon Y.L. Chua
8, David P. Crabb
12,
Philippa M. Cumberland
12, Alexander Day
8, Parul Desai
8, Bal Dhillon
13, Andrew D. Dick
14, Cathy Egan
8,
Sarah Ennis
10, Paul Foster
8, Marcus Fruttiger
8, John E.J. Gallacher
15, David F. Garway-Heath
8, Jane Gibson
10,
Dan Gore
8, Chris J. Hammond
9, Alison Hardcastle
8, Simon P. Harding
16, Ruth E. Hogg
11, Pearse A. Keane
8,
Sir Peng T. Khaw
8, Anthony P. Khawaja
8, Gerassimos Lascaratos
8, Andrew J. Lotery
10, Tom Mac Gillivray
13,
Sarah Mackie
7, Keith Martin
17, Michelle McGaughey
11, Bernadette McGuinness
11, Gareth J. McKay
11,
Martin McKibbin
18, Danny Mitry
8, Tony Moore
8, James E. Morgan
19, Zaynah A. Muthy
8, Eoin O
’
Sullivan
20,
Chris G. Owen
21, Praveen Patel
8, Euan Paterson
11, Tunde Peto
11, Axel Petzold
12, Jugnoo S. Rahi
12,
Alicja R. Rudnikca
21, Jay Self
10, Sobha Sivaprasad
8, David Steel
22, Irene Stratton
23, Nicholas Strouthidis
8,
Cathie Sudlow
13, Dhanes Thomas
8, Emanuele Trucco
24, Adnan Tufail
8, Veronique Vitart
13, Stephen A. Vernon
25,
Ananth C. Viswanathan
8, Katie Williams
9, Jayne V. Woodside
11, Max M. Yates
26, Jennifer Yip
17& Yalin Zheng
165University of Manchester, Manchester, UK.6Kingston University, Kingston, UK.7University of Leeds, Leeds, UK.8NIHR Biomedical Research
Centre, London, UK.9King’s College London, London, UK.10University of Southampton, Southampton, UK.11Queens University Belfast, Belfast, UK. 12University College London, London, UK.13University of Edinburgh, Edinburgh, UK.14University of Bristol, Bristol, UK.15University of Oxford, Oxford,
UK.16University of Liverpool, Liverpool, UK.17University of Cambridge, Cambridge, UK.18Leeds Teaching Hospitals NHS Trust, Leeds, UK.19Cardiff University, Cardiff, UK.20King’s College Hospital NHS Foundation Trust, London, UK.21University of London, London, UK.22Newcastle University, Tyne, UK.23Gloucestershire Hospitals NHS Foundation Trust, Cheltenham, UK.24University of Dundee, Dundee, UK.25Nottingham University Hospitals NHS Trust, Nottingham, UK.26University of East Anglia, Norwich, UK