A Global Market Assessment Methodology for
Small Wind in the Developing World
Alfred Alsop
and Aran Eales
and Scott Strachan
Energy for Development GroupUniversity of Strathclyde, UK Email: [email protected]
Jon Leary
and Jon Persson
and Isabel Ruiz Almeyda
Wind Empowerment AssociationWeb: windempowerment.org
Abstract—Locally Manufactured Small Wind Turbines (LM-SWTs) are growing in recognition as a means for rural elec-trification, and for meeting sustainability and poverty reduction targets set by the UN. This assessment is intended to inform governments and supranational entities where best to invest in order to meet these UN targets and improve the quality of life for millions of people in rural areas. This paper outlines the methodology used in the market assessment and discusses how the information and results are processed in order to achieve a robust ranking system for all countries included. Preliminary results are included and discussed.
Index Terms—Sustainable development, Wind energy, Decision making, Rural areas, social factors
I. INTRODUCTION
Small wind has seen success in off-grid rural electrification projects in numerous locations across the globe, most notably in Inner Mongolia [1]. At present however, international agencies have no comprehensive study to indicate which locations would most benefit from deployment of small wind. As such, Wind Empowerment has carried out a global market assessment which attempts to define the technical, political and socio-economic criteria which makes small wind a favorable method of rural electrification for a given country. Countries with high income levels, high electrification rates or poor wind resource are disqualified from consideration, given that the intention is that rural electrification will lead to accelerated and sustainable development in the target location.
This report focuses on LMSWTs such as the 1kW Piggott turbine [2], in order to retain as much of the value chain and maximize the benefits in the chosen country. Maintenance is considered as a local service, and technical expertise within countries is factored into the indicators accordingly.
The main difficulty in performing an assessment at such a wide scale is deciding upon an appropriate level of detail. Compromise is often necessary as whilst it is desirable to base decisions on all influencing factors, this becomes prohibitively complex. Certain indicators (such as ability to pay, local fi-nancing etc.) were discarded, based on consensus developed by the market assessment working group of Wind Empowerment. Indicators may overlap or be in conflict with others, therefore careful reasoning and justification of all decision making is necessary when dealing with such an interconnected system.
The global assessment is the first step in a strategic planning process for Wind Empowerment. After target countries are highlighted, national assessments will be carried out in these countries to identify suitable regions for small wind deploy-ment. Once suitable regions are identified, a series of regional assessments will be carried out to highlight communities that could be benefited by a small wind installation. Pilot installations will then be performed in order to test the validity of the assessments, with a view to scaling up the project to provide small wind power to the community and surrounding region.
II. BACKGROUND
A. Energy for Development
IEA (International Energy Agency) studies support energy access as being a strong contributing factor to development, highlighting the role access to energy plays in developing economies [3]. In industrialised wealthy countries, increased access to energy may do little to improve quality of life, but for poorer countries it is accepted that small increases in energy access provide significant improvements. A lack of
0 1 2 3 4 5 6
Electricity Consumption per Capita (kWh/person) ×104 0.3
0.4 0.5 0.6 0.7 0.8 0.9 1
Human Development Index (HDI)
[image:1.612.329.543.522.667.2]Relationship between development and energy use
access to electricity is a constraint on human development; women spend hours fetching water, vaccines cannot be safely stored in clinics, school-work is constrained to daylight hours and telecommunication is impossible. Figure 1 demonstrates how at the lower end of the scale of electricity consumption, a small increase corresponds to a significant increase in the Human Development Index (HDI) of a country.
The HDI is a metric devised by the United Nations De-velopment Programme (UNDP) which includes income per capita, education levels and life expectancy in order to rank countries by level of development. Here it is used as a holistic measure of a nations development, and is assumed to relate to the expected quality of life within the country.
The World Bank puts global access to electricity at 84.6%, which translates to over 1 billion people worldwide who have zero access to electricity. However, the binary approach of considering individuals to either have access or lack access has been challenged lately, with the World Bank and SE4ALL implementing a multi-tiered framework to capture energy access data as a continuum [6]. Considering unreliable access to energy further raises the number of people in need of improved access, most of whom live in the rural regions of developing countries, beyond the reach of the national grid. Grid extension is desirable but often prohibitively expensive for rural regions, due to the cost of grid extension over large distances [7], necessitating off-grid solutions. The IEA predicts that despite electrification rates outpacing population growth globally, in Sub-Saharan Africa there will be 45 million more people without access to electricity in 2030 than in 2011 [8]. The purpose of sustainable energy for development is to provide clean, sustainable and cost-effective generation to displace diesel generation or solid fuels in rural locations, improving quality of life and catalysing further development. The primary uses of energy in rural regions of developing country are for lighting and for cooking, typically using kerosene or solid fuels; both of which are known to cause indoor pollution and adversely affect health [9], resulting in 4 million deaths a year [10]. This ill health reduces the productivity of the consumer and consequently the loss of productivity equates to loss of earnings which leads to the persistence of poverty, perpetuating the poverty trap many find themselves in.
B. International Support
In 2011 the Paris-Nairobi Climate Initiative was put for-ward, with aims of securing and maximising climate financing in countries vulnerable to climate change, and especially countries within Africa [11]. The year 2012 was the Inter-national Year of Sustainable Energy for All, during which the UN formed the SE4All initiative, aimed at combating poverty and climate change. In 2015 the UN published a list of seventeen Sustainable Development Goals (SDGs) [12], the most relevant goal for this project is the seventh: to ’Ensure access to affordable, reliable, sustainable and modern energy for all’. Whilst energy has its own explicit goal it has key interactions with at least six of the other goals, and
indirectly with all of them [13]. SDG7 recognises the need for increased generation and supply for millions worldwide who do not benefit from access to a national grid. Furthermore the 2015 Paris Agreements recognised that many of the countries most at risk to the effects of climate change are amongst the worlds poorest [14]. The agreement acknowledges ’the need to promote universal access to sustainable energy in developing countries, in particular in Africa, through the enhanced deployment of renewable energy’.
III. PREVIOUSPROJECTS ANDLITERATUREREVIEW
A. Inner Mongolia Case Study
One of the most significant successes of small wind for off-grid electrification has been in Inner Mongolia, which has primarily targeted local herdsmen. The paper Evaluating the Impact of Wind Generators in Inner Mongolia [1] discusses the methods used by the Chinese government in disseminating the technology and considering the factors which contributed to the successful up-scaling of the project. More than 130,000 generator units have been installed in the region since the project began.
The key to the success seen in Inner Mongolia has been a combination of state support and the establishment of an enabling environment through capacity building and stakeholder engagement, along with an adaptive product design which was changed according to the market requirements. In this market assessment the use of turbines built and assembled by the stakeholder (end user, local business or local NGO) are predominantly considered, rather than the purchase of a complete generator, but the lessons and methods described in this paper remain applicable - especially the principle of ensuring adequate ancillary services (such as supply chain and maintenance network) before deployment. In the global assessment, favourable enabling environments with viable wind resource will be scored based on indicators derived in consultation with small wind practitioners and experts, and knowledge of other unsuccessful/successful projects.
B. Malawian Market Assessment
Wind Empowerment has previously completed a market assessment for LMSWTs in Malawi [16] in partnership with Community Energy Malawi, with recommended delivery mod-els based on the findings from the study. This would be beneficial on an international level, where different approaches will be required, and adapted to different situations in specific countries. With a country specific assessment it is possible to achieve a level of detail which is excessive at a multi-country level. Nevertheless, having these details in mind is useful whilst performing the global assessment, in order to ensure effective follow-up studies based on the countries recommended.
training. The intention of this is that a sense of ownership is imparted upon the stakeholder, along with the expertise and knowledge to perform most simple maintenance tasks. Post-installation maintenance is identified as a significant challenge to the long term success of small wind projects, and so adequate provision must be taken for repairs, as well as aware-ness of environmental hazards such as lightning, corrosion and freak winds. These aspects should be considered as part of the global market assessment to ensure that favourable environmental conditions are identified and sought.
C. Ethiopian Market Assessment
Wind Empowerment have conducted a similar assessment in Ethiopia [8] in partnership with MercyCorps. The assessment itself is carried out in much the same way as with the Malawi project, but here with a greater focus on GIS modelling of wind/solar resource.
The wind and solar resource data is used to determine the most cost effective system configuration, dependent on location. Consideration of solar (or hydro) resource is pertinent, as it would be counter-productive to recommend use of off grid wind generation if this is not the most cost effective solution available.
Another consideration in the Ethiopian Market Assessment is areas of civil unrest (kidnapping, terrorism, violent conflict), which were noted to coincide with regions of poor grid connection. Tangentially this begs the question of whether the civil unrest is a symptom of poor infrastructure and deprivation, or whether the low levels of electrification are due to inaccessibility caused by unrest. Clearly any risk to the installation and maintenance of generation systems is detrimental to the viability of projects in a given location, and this should be reflected in the global assessment even if only at a country-wide scale.
IV. ASSESSMENTMETHODOLOGY
A. Filters
A series of filters were applied in order to reduce the number of countries under consideration. Three binary filters were used; wind resource, access to electricity and income.
The wind filter used the Technical University of Denmark (DTU)s 1km resolution wind atlas (at 50m) to ensure that countries without adequate wind resource were disqualified. The access to electricity filter used world bank data [17] to filter out countries with high (95%+) access to electricity. The income filter similarly used the most recent data for GDP per capita, from the World Bank [18], for each country to filter wealthy countries out of consideration. Figure 2 shows the DTU wind data displayed for the countries that pass through the income and access to electricity. After these filters were applied, a final graded filter was employed, using the same wind atlas as in the binary filter, to further prioritise countries for study. Countries were scored on a scale of 0-3, where a score of three highlighted the country as having a large area of high wind resource (above 4m/s annual average wind-speed at 50m), a score of two signified a smaller area of equivalent resource, or a lower resource over an equivalent area, and so on. Only countries with a score of two or above were studied further in order to reduce the number of countries under consideration.
B. Indicators
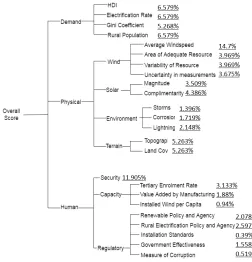
[image:3.612.124.487.525.691.2]In order to determine the viability of a country for the application of LMSWTs for rural electrification the first task is to determine what the deciding factors are, and which factors caused previous projects to fail. Drawing from the lessons outlined in the literature review, and following discussions with experts from Wind Empowerment, the key categories were defined as: physical conditions, financial factors, capacity, policy, market actors and community factors.
Figure 3. Value tree showing the categorisation of indicators used in the market assessment. The final weights for each indicator are shown as percentages.
These categories are composed of sub-indicators which provide greater indicator resolution. The indicators were cate-gorized and arranged into a value tree (a taxonomic hierarchy) for a more straightforward weighting process which will be discussed later in the paper. Market actors, financial and com-munity factors were initially considered, but it became clear that it would be impossible to collect meaningful data for these categories at a global scale. These factors remain important, and should be considered when it is possible to conduct in-country interviews, such as during a national assessment.
Data for the indicator scores were taken from a range of sources including The World Bank, UNDP, DTU Wind Resource Map [15], National policy documents and satellite imagery.
All data was given a score on a common scale of 0-3 where generally 0 indicated absolute undesirability and a score of 3 indicated highest desirability. All scores were assigned according to a set criteria. For countries where data was missing, a K-Nearest Neighbour imputation algorithm was utilised to predict missing indicator values based on the values of indicators for the K nearest countries (in indicator space, not geographical location). There are limitations in this technique, mainly that any predicted value will be well behaved (predicted data will conform strictly to trends in the known data) [19], but to carry out an assessment a full dataset is required. An alternative to KNN imputation would be to use the average values for indicator scores for all countries, but this would have a homogenising effect on scores. The number of nearest neighbours to consider in the imputation
was determined empirically, by finding the value of K which generated the smallest error in predicting the values of known data points.
The final indicators are shown in Figure 3, which displays the structure of the value tree used for weighting purposes. The use of this tree structure allows only similarly categorised indicators to be compared when weighting, and allows for automatic normalisation through weighting with the SMART process, as defined in the next section.
V. WEIGHTINGTECHNIQUES
Indicators will have varying degrees of influence in the identification of viable sites, and so a weighting technique is needed to capture the relative influence of indicators. The weighting of indicators poses some difficulties, not least in minimising any bias imposed by experts involved in the weighting process. It may be difficult to qualitatively gauge the benefits and varying degrees of influence of different factors against each other. Two particular Multi-Criteria Decision Analysis (MCDA) techniques were considered, Analytical Hierarchy Process (AHP) and Simple Multi-Attribute Ranking Technique (SMART).
Simple Multi-Attribute Ranking Technique [20] involves considering trade-offs between indicators, as with the well known cost-benefit analysis. The decision maker is required to assign a value to each indicator in descending order of influence, using the most influential indicator as a reference point with an assigned value of 100. Influence is considered as a measure of the extent to which the indicator would impact upon the decision. Figure 4 displays a flow chart of the SMART process as it would be applied to the indicator weighting problem.
AHP is a pairwise comparison technique, requiring each indicator to be directly compared with every other indicator by the decision maker [21]. The grading of the individual decisions is aided by a set criteria, allowing for more rapid decision making. The difficulty is that the number of pairwise comparisons that must be made is equal to the factorial of the number of indicators, and so with a large number of indicators the number of comparisons quickly becomes unmanageable. Another problem is that comparisons between inherently dissimilar indicators must be made, for example the comparison of significance between wind resource and government corruption.
Figure 4. The process for weighting the indicators and categories involved in the Global Market Assessment
each indicator.
Using the SMART process outlined in Figure 4, the mar-ket assessment working group of Wind Empowerment, as a panel of experts (including practitioners, academics and project developers from a range of countries with experience of implementing LMSWT projects), weighted the indicators described here. The cumulative weights (shown in Figure 4) are eventually multiplied by the fractional scores of the appropriate indicator for each country, the weighted scores are then summed to achieve a final overall score for each country in the assessment. Due to the Global nature of this assessment it was not practical to have all countries represented in the focus group, but for national assessments any weighting process should involve local stakeholders and policy makers.
VI. RESULTS
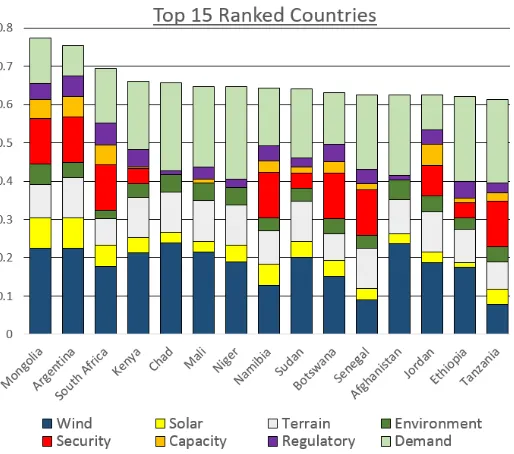
The top five ranked countries from the assessment are: Mongolia, Argentina, South Africa, Kenya and Chad. The top 15 ranked countries, of 40 included in the assessment, are shown in Figure 5.
Assessing these countries by the indicators displayed in Figure 3, weighted through the SMART process, allows a ranking to be constructed.
By breaking down the scores by category as in Figure 5, one can see where the relative strengths and weaknesses of a particular country lie. This style of breakdown may be
used to inform delivery models and implementation strategies when a more localised study is performed. For example if a country has strong wind resource and favourable physical factors, yet poor capacity then Wind Empowerment or other agencies should carry out some capacity building schemes in order to maximise the potential of a country.
Figure 5. Bar graph depicting the contribution of each indicator category to the final score of the top scoring 15 counties.
VII. CONCLUSIONS
To confirm the ranking of the countries a sensitivity analysis is necessary in order to determine which countries consistently score well. The ranking system produced does not necessarily disqualify any countries from consideration in this case, as for policy and regulatory factors, advocacy work may over time effect the government stance on renewable energy for rural electrification purposes and ultimately improve a country’s score. The same could be said for the capacity category - a poor scoring country which scores highly in other categories may simply require a capacity building program as seen in Inner Mongolia [1]. Therefore a key aspect of this assess-ment approach is that it not only informs decision makers which countries are currently more suitable for LMSWTs, but critically, which areas require addressing to create a positive enabling environment for a potential small wind project or development programme.
[image:5.612.314.571.142.369.2]representative comparisons to be made and valuable conclu-sions to be drawn.
While more robust validation of this market assessment is still required, it is encouraging that the two most viable countries are Mongolia and Argentina, as Inner Mongolia (located in China, but culturally and geographically similar to Mongolia) is one of the most notable successes for small wind, and the south of Argentina is known to be a well suited location for small wind.
VIII. DISCUSSION AND FUTURE WORK
It may be worthwhile to group island countries together, given their low population and similar environmental and socio-economic situation. Grouping islands by region is al-ready commonplace with international agencies and may be better suited, politically, to eliciting support for a LMSWT project.
A GIS (geographical information system) methodology is in development, in order to allow the use of geo-spatial data for location scores rather than the pseudo-qualitative scoring system used here. This would allow quantitative analyses of wind resource, population density, solar resource and distance to national grid, providing a more numerical means of evaluat-ing the physical indicators listed in the methodology described. The current assessment omits any explicit economic con-sideration, such as the comparison of the levelized cost of energy of different generation types seen in Szabo et al [22]. The inclusion of an economic assessment is planned for future studies, especially the use of market size in a location or country as an indicator. The use of this indicator would avoid the problem with choosing between the absolute population or the percentage of population considered. Market size is calculable by considering the population in locations outside of the exclusion areas, relating to the scalability of small wind systems in a certain location.
At different geographical scales (global, national, regional) the assessment indicators will change, with some factors becoming appropriate to distinguish between locations and some factors becoming homogeneous at a smaller scale. The SMART process will have to be adapted for each context and weighting focus group.
Further use of MCDA techniques is planned for automated data processing. Entropy based weighting methods [23] have been considered for use in place of SMART, removing the need for focus groups to weight indicators, and would instead rely on the variance between countries for a certain indicator to weight this indicator. If entropy methods were used the process could be encapsulated in an automatic model, which imputes, filters and then weights the input data. MCDA is, however, a fundamentally participatory field. Much of the value in using MCDA techniques stems from the inclusion of stakeholders and decision makers in the process, so an automated system should still only comprise part of the methodology.
Ultimately the intention of this work is to provide a useful list of countries and locations to prioritise for small wind implementation, for Wind Empowerment and others. Small
wind occupies a niche in the rural electrification market, but given the right conditions it can contribute meaningfully to sustainable development efforts. By maximising the efficiency of the whole humanitarian project chain more will be accom-plished with the same resources, and more people will be lifted out of extreme poverty.
ACKNOWLEDGMENT
Funding for this project was granted by WISIONS via Wind Empowerment. A. Alsop’s time was subsidized by the EPSRC via the University of Strathclyde (funding reference code EP/LO16680/1)
REFERENCES
[1] S. Batchelor, N. Scott, L. Daoqi, and Bagen, “Evaluating the impact of wind generators in inner mongolia,” Department for International Development, Tech. Rep., 1999.
[2] H. Piggott,A Wind Turbine Recipe Book, H. Piggott, Ed. Hugh Piggott, 2013.
[3] R. Ferguson, W. Wilkinson, and R. Hill, “Electricity use and economic development,”Elsevier, 2000.
[4] UNDP. (2016, September). [Online]. Available: http://hdr.undp.org/en/composite/HDI
[5] IEA. (2016, September). [Online]. Available: http://data.worldbank.org/indicator/EG.USE.ELEC.KH.PC
[6] B. M and A. N, “Beyond connections: Energy access redefined,” World Bank, Tech. Rep., 2015.
[7] M. Torero, “The impact of rural electrification,” in AFD
Proparco/EUDN: Energy for Development, 2014.
[8] A. Eales, J. Sumanik-Leary, and K. Latoufis, “Market assessment for lo-cally manufactured small wind turbine in ethiopia,”Wind Empowerment, 2016.
[9] World Health Organisation, “Indoor air pollution from solid fuels and risk of low birth weight and stillbirth,” Annual Conference of the
International Society for Environmental Epidemiology, 2005.
[10] WHO. (2016, February) Household air pollution and health. WHO. [On-line]. Available: http://www.who.int/mediacentre/factsheets/fs292/en/
[11] The Paris-Nairobi Climate Initiative: Clean energy for all in Africa and
in countries most vulnerable to climate change, 2011.
[12] Resolution adopted by the General Assembly on 25 September 2015.
United Nations, 2015, a/RES/70/1.
[13] D. Griggs, M. Nilsson, A. Stevance, and D. McCollum, “A guide to sdg interactions: From science fo implementation,” International Council for Science (ICSU), Tech. Rep., 2017.
[14] Paris Agreement, 2015.
[15] “Data from dtu wind energy global wind atlas, funded by danish energy agency eudp 11-ii, globalt vind atlas j.nr. 64011-0347.”
[16] J. Sumanik-Leary, M. Org, M. Little, J. Persson, C. Kalonga, A. Eales, M. Kaunda, M. Kamwendo, and E. Bayani, “Market assessment for locally manufactured pv-wind hybrid systems in malawi,” Wind
Em-powerment, 2016.
[17] (2016) Access to energy rate by country. The World Bank. [Online]. Available: http://data.worldbank.org/indicator/EG.ELC.ACCS.ZS [18] (2016) Gdp per capita by country. The World Bank. [Online]. Available:
http://data.worldbank.org/indicator/NY.GDP.PCAP.CD
[19] G. E. A. P. A. Batista and M. C. Monard, “A study of k-nearest neigh-bour as an imputation method,” in Soft Computing Systems: Design,
Management and Applications, 2002.
[20] P. Goodwin and G. Wright,Decision Analysis for Management Judge-ment, Wiley, Ed. Wiley, 1997.
[21] T. Saaty,The Analytic Hierarchy Process: Planning, Priority Setting,
Resource Allocation, U. of California, Ed. McGraw-Hill, 1980.
[22] S. Szabo, K. Bodis, T. Huld, and M. Moner-Girona, “Energy solution in rural africa: mapping electrification costs of distributed solar and diesel generation versus grid extension,”IOP Environmental Research Letters, 2001.
[23] J. Malczewski and C. Rinner,Multicriteria Decision Analysis in
![Figure 1. HDI plotted against Electricity Consumption. Data taken from theUNDP [4] and World Bank [5] respectively.](https://thumb-us.123doks.com/thumbv2/123dok_us/1428773.95493/1.612.329.543.522.667/figure-plotted-electricity-consumption-data-theundp-world-respectively.webp)
![Figure 2. Map showing wind data from the DTU [15] in developing countries.](https://thumb-us.123doks.com/thumbv2/123dok_us/1428773.95493/3.612.124.487.525.691/figure-map-showing-wind-data-dtu-developing-countries.webp)