City, University of London Institutional Repository
Citation
:
Sathiyanarayanan, M. ORCID: 0000-0002-8598-1949 (2017). Improving Visual
Investigation Analysis of Digital Communication Data within E-discovery. Paper presented at
the VIS 2017, 1-6 Oct 2017, Phoenix, USA.
This is the accepted version of the paper.
This version of the publication may differ from the final published
version.
Permanent repository link:
http://openaccess.city.ac.uk/id/eprint/22851/
Link to published version
:
Copyright and reuse:
City Research Online aims to make research
outputs of City, University of London available to a wider audience.
Copyright and Moral Rights remain with the author(s) and/or copyright
holders. URLs from City Research Online may be freely distributed and
linked to.
City Research Online:
http://openaccess.city.ac.uk/
[email protected]
Improving Visual Investigation Analysis of Digital Communication Data
within E-discovery
Mithileysh Sathiyanarayanan∗
giCentre, City, University of London, UK
1 INTRODUCTION
The main aim of the research is to develop visual designs and frameworks for digital communication data within an investigation domain (i.e E-discovery) to address immediate challenges, support investigative tasks and find information in data to support legal evi-dences. This will enable analysts to compare time-frames, individ-uals and groups of data objects from multiple perspectives, identify relevant subsets of data and find anomalous communication behav-ior. In this research, we will be developing techniques and im-plementing comparison strategies in software prototypes through a structured process of abstraction, design and testing. Doing so is intended to explore and answer a series of research questions in ways that will improve the role of visualisation in E-discovery. The first set of deliverables were presented in the poster and workshop of VIS 2016 [16][17], the second set of deliverables were presented at the DESI VII 2017 (a domain related workshop) [18]. This PhD project is in close collaboration with the Red Sift company in Lon-don who are currently working on digital communication data and E-discovery related projects.
Electronic Discovery (E-discovery) [9] is an investigation do-main where electronic/digital communication data is sought, lo-cated, secured, and searched with an intent of using it as evidence in a civil or criminal legal case. To help improve efficiency and reduce costs involved in an E-discovery process [12], visualisation techniques can be of great help, and they can change the way we present and understand time, individuals, contacts, and contents ex-changed. Electronic Mail (E-mail) has been around for a long time, and some may consider it a dated means of communication. How-ever, E-mail is still a major digital communication medium, espe-cially in organisations and the kinds of E-discovery tasks that are being undertaken in organisations call out for the types of interac-tive broad channel approach that visualisation can offer. E-mail data is a central resource in E-discovery processes [12] and the existing tools are not capable of handling this vast, dynamic, noisy, real-time, heterogeneous, unstructured and relational data. Addressing E-discovery requests that involve E-mail data, which nowadays can easily go up to millions, is becoming a task that is becoming un-manageably time consuming [8][11]. We need novel solutions that will help analysts in their E-discovery tasks through interactive and visual analytics and lead to faster and effective processes [13]. As the socio-technical systems have grown in complexity, E-discovery analysts are looking for a simple and effective visualisation tool to detect, analyse and understand anomaly behaviours in E-mail com-munication.
Problem Statement: With E-mail traffic continuing to grow at 5% [1] a year in the business context more companies are now requiring cost effective solutions for E-discovery. Despite the in-creased importance of E-discovery for organisations, it still remains a reactive procedure where, once a company is involved in litigation or receives a request for information, a legal firm is then appointed
∗E-mail: [email protected]
to review the E-mail archives to produce evidence. Practically ev-ery analyst/investigator finds a vast and semantically meaningful collection of data in E-mail inboxes to investigate which makes it tedious to compare and identify anomalies or relations. The tools currently available on the market are based on simple string search and legal firms charge companies based on the volume of informa-tion produced by the search, which is then manually reviewed [12]. This results in significant costs for the company or in a number of cases settlement because they can’t afford the costs of E-discovery. This serves as a motivation for us to conduct interviews with the ex-perts to develop visual designs and frameworks for digital commu-nication data within E-discovery to address immediate challenges, support investigative tasks and find information in data.
Discussions with the experts at Red Sift (partners in the project) and the E-discovery analysts, make us understand the need for an interactive visualisation for easy navigation and access to under-stand and present various behaviour (temporal, individuals and con-tents) as visual evidence, which in a way improves investigation process. Since our knowledge is rather limited about what consti-tutes an effective technique for visualising E-mail data, interviews were conducted with the domain experts to understand their tasks and requirements. Through our initial interviews and background studies, we have elicited a series of questions (RQ1-3is generic
RQ4-5is specific) that form the basis of the planned research.
RQ1: What are the challenges, requirements and tasks in E-discovery involving digital communication data?
RQ2: What are the requirements and role of visualisation in the analysis of digital communication data within E-discovery? Will the visual investigation of communication behavior help in E-discovery analysis?
RQ3:What kind of a framework with guidelines and/or recommen-dations will help analysts to investigate and navigate digital com-munication data serenely and make decisions effectively?
RQ4:Is there an effective way to compare two or more subsets of communication data that can lead to insight and knowledge?
RQ5:How to effectively determine a subset of a huge digital com-munication data to be investigated in a quick time?
Aim and Objectives: The aim of the research is to develop vi-sual designs, methods, techniques, approaches, and frameworks for digital communication data within an investigation domain (i.e E-discovery) to address challenges and support E-discovery tasks. The objectives are:
O1: Understand the E-discovery domain (specific to digital com-munication data) and develop a rich understanding of challenges, tasks and requirements by conducting informal discussions with the domain experts.
O2: Understand the requirements and role of visualisation in the analysis of digital communication data within E-discovery that sup-port analytical tasks and challenges.
O3:Develop design solutions to use visualisations in E-discovery to determine baselines for comparison, identify similarities (com-monalities), differences (variations), normalities, abnormalities and to make comparative decisions efficacious. Evaluate the solutions by conducting an empirical study with experts/novice users to un-derstand comparative/anomaly detection tasks.
to determine and visualise whether the selected/subset data of in-dividuals or group of inin-dividuals is relevant and/or interesting and make pertinent decisions efficacious. Evaluate the solutions by con-ducting an empirical study with experts/novice users to understand individual(s) behavior tasks.
O5: Re-access the developed prototype (proof-of-concept) inter-active visualisation tool based on the evaluation results and feed-back. Also, re-access the developed conceptual and visual frame-work along with guidelines/recommendations that can help analyst to investigate and navigate communication data productively and make decisions efficacious.
Problem Approach: In order to develop simple and effective in-teractive visualisations of digital communication, we need to un-derstand the tasks and requirements of analysts, challenges they are facing and develop various methods, strategies and framework which will allow companies/legal teams to adopt proactive, preven-tive, more accurate and ultimately more cost-effective E-discovery procedures and gain invaluable insight from digital communication data.
2 RELATEDWORK
Visual Analytic tools specific to E-discovery: From the discus-sion sesdiscus-sions with the experts, we tried to scope digital communi-cation data to E-mail communicommuni-cation as most of their E-discovery investigations are related to mails. The experts/analysts use E-discovery tools such as Brainspace Discovery5T M[2], Jigsaw [20], Concordance by LexisNexis [3], IN-SPIRE [4], Radiance [5], Zovy Advanced E-discovery (AeD) [6], DocuBurst [10] to analyse un-structured data. From our analysis, considering the tools for the investigation domain, many of the visual analytic tools have been used by many analysts; however, we identified relevant limitations: (i) arduous to compare two or more subsets of data. (ii) strenu-ous to detect anomalies and changes in data. (iii) onerstrenu-ous to ex-plore data. (iv) Unfavorable interaction facility and (v) Unfavorable multi-faceted data analysis.
3 PROPOSEDWORK
The proposed work based on the research questions, aim and objec-tives are discussed as work packages:
WP1: Challenges, Tasks and Requirements gathering - review state-of-the-art for digital communication data within E-discovery. Investigate how the existing E-discovery (investigation) tools work. Identify a number of case studies that will help in addressing re-search questions. Conduct informal discussions with the domain experts. Ingest and prepare large test dataset. Develop paper sketches and semi-functional prototypes to understand the real chal-lenges and requirements.
WP2: Implementation of Visual Comparison Framework - de-vise strategies for determining baselines and identifying similari-ties, differences, normalities and abnormalities to understand over-all communication behavior. Develop sketches, pseudo-code(s) and functional prototypes (using D3.js) to utilise in targeted discus-sions/workshops/interviews to gather further structured feedback. Design and document use-case scenarios that will demonstrate the effectiveness of the design solutions that are built. Evaluate the ef-fectiveness of the prototypes (including enterprise testing and feed-back). Attempts to use different techniques and approaches based on the evaluation results. Based on the iterative discussions with the experts and the empirical results and feedback, a set of guidelines, suggestions and recommendations for the analysts will be provided.
WP3: Implementation of Visual Pertinence Framework - De-vise strategies to effectively analyse two or more selected/subsets of communication data and visualise whether the selected/subset data is pertinent (relevant) and/or interesting to understand indi-vidual(s) behavior. Develop sketches, pseudo-code(s) and func-tional prototypes (using D3.js) to utilise in targeted
discus-sions/workshops/interviews to gather further structured feedback. Design and document use-case scenarios that will demonstrate the effectiveness of the design solutions that are built. Evaluate the ef-fectiveness of the prototypes (including enterprise testing and feed-back). Attempts to use different techniques and approaches based on the evaluation results. Based on the iterative discussions with the experts and the empirical results and feedback, a set of guidelines, suggestions and recommendations for the analysts will be provided.
4 COMPLETEDWORK
4.1 Discussion Session with the Domain Experts:
From theWP1, the first objective (O1) is achieved by conducting discussion sessions with the E-discovery experts (discussed in our papers [16][17][18]). This helped us to identify a set of challenges and the most important and immediate challenges are discussed be-low.
4.2 Identified Challenges of Digital Communication Data within E-discovery:
CH1:Improve comparing of two or more subsets of data:A strat-ified manual sampling [19] is used for comparison that enables E-discovery analysts to work on the subsets of data manually and spot similarities and/or differences, where each of the features/attributes are stratified based on the reports/clues. The iterative process of sampling data and comparing is strenuous and are disintegrated to identify an important/relevant change. Also, some of the current techniques/approaches does not aid in supporting various features in comparing subsets of multi-faceted data. So, representations must be effective for displaying multiple relationships and com-parison when placed close together or side by side (in an integrated format), thus improve comparing of two or more subsets of data over time to identify similarities and differences. One of the ex-ample question is “How to focus on a particular time-frame and compare with a different sets of time-frames to identify interesting and relevant points?”.
CH2: Improve detecting anomalies, changes and correlation: The E-discovery analysts have difficulty in defining anoma-lies/abnormalities. In fact, “anomalous behaviour” is hard to de-fine and we need a robust model of normality to be dede-fine what is “normal” and be able to effectively detect anomalies. How-ever, in the case of multi-faceted data, there can be many ways to model normality and different data objects can be marked as anomalous from different perspectives, hence the need for flexible ways of defining normals is of utmost important. some of the cur-rent techniques/approaches on anomaly detections are not easy to fit into real-world application due to their cumbersome approach, es-pecially when considered multi-faceted communication data over time. So, representations must be simple and efficient to identify and detect anomalous behaviours in data over time. One of the example questions is “How to find out the individual or a group of individuals who behave “differently” in a given/selected time-frame?”.
CH3: Improve guided open-ended data exploration: The E-discovery analysts have difficulty in exploring large datasets and they have become a big concern due to navigation issue, especially for communication data. The exploration of the email corpus must be beyond target search, i.e., supporting visual querying along tem-poral, connections, context and conceptual dimensions. So, the challenge here is develop an interactive visualisation tool with ex-ploratory guidance that will help in navigating smoothly across var-ious dimensions and also aid in suspension (pause and resume while exploring).
4.3 Identified suitable datasets:
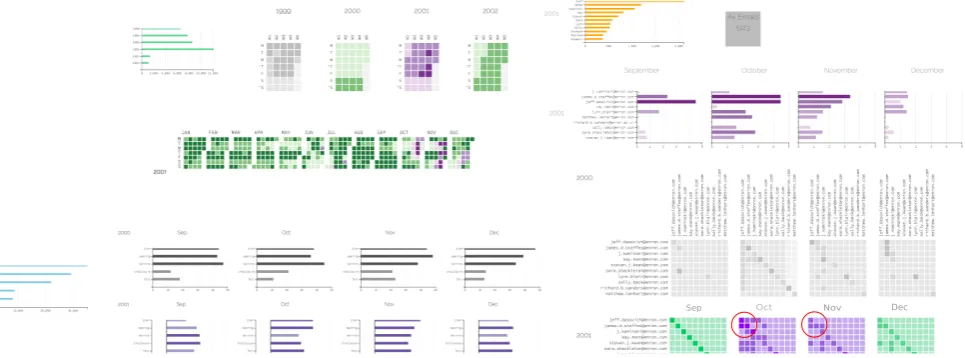
Sep Oct Nov Dec
Figure 1: Visual comparison strategies were produced to determine baselines for comparison, identify similarities (commonalities), differences (variations), normalities and abnormalities, such that analysts can make effective decisions -WP2.
In the survey, only two datasets with case studies [18], Enron [14] and Hillary Clinton [7] dataset, matched the criteria and hence the reason for using the datasets for implementing the framework and addressing the investigation tasks.
The first objective (O1) is discussed in the poster and work-shop papers presented at the VIS 2016. The second objective (O2) helped us understand the requirements and role of visualisation in the analysis of digital communication data within E-discovery. This is described in our paper and was presented at the DESI VII Work-shop (a domain related) [18].
5 ONGOINGWORK
5.1 Developing Visual Comparison Framework:
TheWP2, i.e, third and fourth objective (O3and O4) on de-veloping a visual comparison framework is submitted as a full pa-per at the VIS 2017. With the availability of multi-faceted, dy-namic, and complex data sets describing digital communications, comparing individuals or groups of data objects from multiple per-spectives is a common data analysis task. Small multiples have been adopted widely in various investigation domains such as E-discovery, Criminal Investigations, Digital Forensics, Intelligence Analysis to support comparative analysis tasks. Despite the popu-larity of small multiples, strategies to outline their effective use in comparing within multiples (between units), determining baselines (references for comparison), defining normalities, and identifying anomalies have been under-explored and under-investigated. To overcome these limitations, this paper proposes a framework that is developed to establish the design space of strategies for the def-inition of normality, and the comparison of small multiples within the analysis of multi-faceted digital communication data that en-compass features such as time, connections, and context (e.g., text content of emails). Our approach is informed by a number of anal-ysis tasks derived from a series of discussion sessions held with domain experts, and we describe our model through examples of the strategies applied within the context of a real-world application domain. We evaluate our approach through demonstrations of the use and the benefits of the different strategies within a case study (Enron scandal) from E-discovery. We then discuss how our frame-work can be applicable to domains where the focus of the analysis is on comparing data observations to identify normalities, abnormal-ities and deviations from baselines. In many investigation cases,
legal experts or lawyers or analysts do not get any clue about the time-frame or individuals or code words used in the communica-tion. In that situation, experts either use JigSaw tool and/or read all the E-mails manually and go through a strenuous iterative process to identify time, individuals involved and words used. To improve analytical capability for domain experts, we created various base-line comparison strategies to make an exploratory analysis such that to minimise the number of emails, to be read manually, by using our strategies and maximise the interestingness/relevance. From the workshop discussions and background study, we designed three strategies, which are detailed in the VIS full paper - just a high-level description is discussed below and the implemented strategies are represented in the Fig. 4.
Monoform baseline comparison:this is the one that compares a single reference unit to a single investigative unit at the same scale. This strategy can be used to compare one subset of data with an another subset of data (fixed/varying reference unit) when the in-vestigative units are adjacent or distant.
Variform baseline comparison: this is the one that compares a set of reference units with an another set of investigative units at the same scale. This strategy can be used to compare many subsets of data with many other subsets of data concurrently (fixed/varying reference units) when the investigative units are adjacent or distant.
Diversiform baseline comparison:this is the one that compares a set of reference units of same/different scales to a set of investiga-tive units of a particular scale. This strategy can be used to compare one or many subsets of data with either one or many other subsets of data concurrently/random (fixed/varying reference units) when the investigative units are adjacent or distant.
During the workshops, and whilst designing and developing the strategies, we identified a number of limitations and areas where further work is required: (i) the model can be improved by in-tegrating further statistical capabilities (better computation tech-niques/metrics) within the views and search facility, such that it becomes moregeneralizable. (ii) the strategies can be effectively used to drill-down/up, compare and identify changes/patterns by improving cognition with interaction. (iii) conduct empirical stud-ies with the domain experts.
5.2 Developing Visual Pertinence Framework:
visu-alise whether the selected/subset data of individuals or group of in-dividuals is pertinent (relevant) and/or interesting in a quick time and make decisions efficacious. We will evaluate the solutions by conducting an empirical study with experts/novice users to un-derstand individual(s) behavior tasks. As a final step, a proof-of-concept, an interactive visualisation tool, based on the evaluation results and feedback will be developed. The results will help in developing a conceptual and visual framework along with guide-lines/recommendations that can help analyst to investigate and nav-igate smoothly across various dimensions productively and make efficacious decisions - this forms ourWP3.
6 DISCUSSION
The tools currently available on the market are based on simple string search and legal firms charge companies based on the vol-ume of information produced by the search, which is then manu-ally reviewed. This results in significant costs for the company or in a number of cases settlement because they can’t afford the costs of E-discovery. This project aims to deliver a proof-of-concept for an agile and robust E-discovery solution which will enable com-panies to make this a proactive and preventive process. Our pro-posed methodologies will help analysts in their E-discovery tasks through interactive visual analytics and lead to faster and effec-tive processes. This will improve efficiency in investigation process within both businesses and governmental organisations that need to go through such tedious and costly processes. Also, analysts would find it useful to use an interactive visualisation for easy navigation and access to understand various behaviour (temporal, individuals and contents) and make an efficacious decision.
There are several points that we will be addressing in our ongo-ing project: (i) challenges in reachongo-ing out to experts. (ii) potential challenges pushing for change in a domain where there might be re-sistance to new solutions (iii) complexity and learning curve of the tools for domain analysts (iv) how to best demonstrate the value to domain experts. (v) how to address some of the inherent limitations of the visualisation based solutions, such as the cost of interaction and potential for false positives. (vi) how to guarantee effective exploration, the role of guidance, the role of automated solutions.
7 VISDC PANEL
Some of the questions I would like to get insights on:
Q1:How best to evaluate the sense-making process of E-discovery analysts? Insight-based evaluation methods [15] are costly and hard to facilitate. Can the sense-making tasks be broken into smaller pieces so that various steps of the process are tested in isolation?
Q2:How to run a study with small number of participants and large datasets? What pitfalls might we encounter?
Q3: How to reliably carry out iterative discussions and empirical studies with the experts such that guidelines/recommendations are provided for effective decision making. What methods can we use to leverage this position to learn from them in ways that the com-munity can benefit from?
Q4:How to demonstrate the value the best to domain experts? How to “win” them and impose change in their daily practice?
Q5:How to train users, what are the best strategies to “demo” and test our solutions with them? Is it better to stick to simple and known visual representations for the sake of smoothing the learning curve or is it better to start with complex but more capable visuali-sation designs to impress them?
8 CONCLUSION ANDPERSONALMOTIVATION
At its core, the project’s goal with respect to E-discovery is to de-velop visualisation solutions to unravel the information within dig-ital communication data (E-mail in specific) and support legal evi-dences. Getting useful, actionable insight out from E-mail collec-tions that are vast, unstructured, and noisy (in terms of variation
and clutter) is a highly complex, challenging task. In order to ad-dress this ambitious goal, we need to deliver innovation on several fronts: Developing visual methods, strategies and framework: The complexity of the data requires us to not only utilise and improve state-of-the-art methods/strategies in data analysis but also calls for novel solutions where new techniques are fostered. The potential of such contribution in information discovery, visual evidence and decision making within E-discovery domain is not yet investigated thus an innovation we want to exploit in this project.
Attending a dynamic and interactive international conference like VIS is a boon for students to meet famous scholars and pro-fessionals. I consider this as an excellent platform and opportu-nity to collaborate with the educational institutions and industries, which I feel is the way to approach networking to uncover ideas, spark inspiration to develop new products and gain visibility in the visualisation field. Also, I would like to share my own perspec-tives on how to effectively use the prototype versions I developed in the real-world scenario and discuss cutting-edge research to stay competitive in today’s fast-paced world.
REFERENCES
[1] http://www.radicati.com/wp/wp-content/uploads/2013/04/Email-Statistics-Report-2013-2017- Executive-Summary.pdf. [2] http://enterprise.brainspace.com/discovery.
[3] http://www.lexisnexis.com/litigation/products/ediscovery/concordance. [4] http://in-spire.pnnl.gov/.
[5] http://www.ftitechnology.com/radiance-visual-analytics-software. [6] http://zovy.com/solutions/ediscovery/.
[7] https://www.kaggle.com/kaggle/hillary-clinton-emails.
[8] S. Attfield and A. Blandford. Discovery-led refinement in e-discovery investigations: sensemaking, cognitive ergonomics and system
de-sign.Artificial Intelligence and Law, 18(4):387–412, 2010.
[9] E. Casey.Handbook of digital forensics and investigation. Academic
Press, 2009.
[10] C. Collins, S. Carpendale, and G. Penn. Docuburst: Visualizing
docu-ment content using language structure. InComputer graphics forum,
volume 28, pages 1039–1046. Wiley Online Library, 2009.
[11] J. G. Conrad. E-discovery revisited: A broader perspective for ir
re-searchers. InProceedings of the ICAIL07 DESI Workshop, Stanford
University. DESI Press, CA, 2007.
[12] D. Lawton and R. Stacey and G. Dodd. Uk home
of-fice.
https://www.gov.uk/government/publications/ediscovery-in-digital-forensic-investigations, 2014.
[13] S. Joshi, D. Contractor, K. Ng, P. M. Deshpande, and T. Hampp.
Auto-grouping emails for faster e-discovery.Proceedings of the VLDB
En-dowment, 4(12):1284–1294, 2011.
[14] B. Klimt and Y. Yang. The enron corpus: A new dataset for email
classification research. InMachine learning: ECML 2004, pages 217–
226. Springer, 2004.
[15] C. North. Toward measuring visualization insight.Computer
Graph-ics and Applications, IEEE, 26(3):6–9, 2006.
[16] M. Sathiyanarayanan and C. Turkay. Determining and visualising e-mail subsets to support e-discovery. 2016.
[17] M. Sathiyanarayanan and C. Turkay. Is multi-perspective visualisation recommended for e-discovery email investigations? 2016.
[18] M. Sathiyanarayanan and C. Turkay. Challenges and opportunities in using analytics combined with visualisation techniques for finding
anomalies in digital communications. InProceedings of the ICAIL17
DESI Workshop, King’s College London, UK. DESI Press, London, 2017.
[19] I. Soboroff. A comparison of pooled and sampled relevance judgments
in the trec 2006 terabyte track. InEVIA@ NTCIR, 2007.
[20] J. Stasko, C. G¨org, and Z. Liu. Jigsaw: supporting investigative
analysis through interactive visualization. Information visualization,