Exploring How Drivers Perceive Spatial Earcons in Automated Vehicles
DAVID
BEATTIE,
School of Engineering and Built Environment, Glasgow Caledonian UniversityLYNNE
BAILLIE, School of Mathematical and Computer Sciences, Heriot
-Watt UniversityMARTIN
HALVEY,
Department of Computer and Information Sciences, University of StrathclydeAutomated vehicles seek to relieve the human driver from primary driving tasks, but this substantially diminishes the connection between driver and vehicle compared to manual operation. At present, automated vehicles lack any form of continual, appropriate feedback to re-establish this connection and offer a feeling of control. We suggest that auditory feedback can be used to support the driver in this context. A preliminary field study that explored how drivers respond to existing auditory feedback in manual vehicles was first undertaken. We then designed a set of abstract, synthesised sounds presented spatially around the driver, known as Spatial Earcons, that represented different primary driving sounds e.g. acceleration. To evaluate their effectiveness, we undertook a driving simulator study in an outdoor setting using a real vehicle. Spatial Earcons performed as well as Existing Vehicle Sounds during automated and manual driving scenarios. Subjective responses suggested Spatial Earcons produced an engaging driving experience. This paper argues that entirely new synthesised primary driving sounds, such as Spatial Earcons, can be designed for automated vehicles to replace Existing Vehicle Sounds. This creates new possibilities for presenting primary driving information in automated vehicles using auditory feedback, in order to re-establish a connection between driver and vehicle.
CCS Concepts: • Human-centered computing → Human computer interaction (HCI) → Interaction techniques → Auditory feedback; •HCI design and evaluation methods → User studies;
General Terms: Design, Experimentation, Human Factors
Additional Key Words and Phrases: Automated Vehicles; Auditory Displays; Auditory Feedback; Driving Simulator; Earcons; Existing Vehicle Sounds; Handover of Control
ACM Reference format:
David Beattie, Lynne Baillie and Martin Halvey. 2017. Exploring How Drivers Perceive Spatial Earcons in Automated Vehicles. Proc. ACM Interact. Mob. Wearable Ubiquitous Technol. 1, XXXX. 3 (September 2017), 24 pages.
DOI: XXXX
1 INTRODUCTION
Recent automated vehicle research has primarily focused on the computerisation of the operational aspects of automated vehicles [11]. However, new research is emerging that investigates the implications to human factors brought about by the introduction of automated vehicles. For example, researchers have begun to investigate the provision of feedback during the moment of control handover between a driver and vehicle [37,40,52]. Other new research assesses situational awareness under varying levels of automation [39]. While these studies contribute towards solving some of the fundamental human factors issues in automated vehicles, they do not address how to effectively retain a connection between the driver and automated vehicle.
Permission to make digital or hard copies of all or part of this work for personal or classroom use is granted without fee provided that copies are not made or distributed for profit or commercial advantage and that copies bear this notice and the full citation on the first page. Copyrights for components of this work owned by others than ACM must be honored. Abstracting with credit is permitted. To copy otherwise, or republish, to post on servers or to redistribute to lists, requires prior specific permission and/or a fee. Request permissions from [email protected].
© 2017 ACM. 2474-9567...$15.00 DOI: XXXX
Norman has maintained that the source of difficulties with automation is the lack of continual, appropriate feedback that occurs naturally when humans are responsible for control [44]. Research has already suggested that the automation of individual parts of the driving task causes drivers to suffer from a reduced feeling of control, sense of being in charge and being at one with the car [26]. Moreover, in the context of fully -automated vehicles, it has been suggested that because of a lack of feedback, “Passengers have no idea if the autonomous vehicle recognizes and evaluates a traffic situation correctly or if a critical manoeuvre has to be performed” [31]. The provision of a continued connection between driver and vehicle using appropriate types of feedback is a critical point that human factors research must address.
Drivers of manually operated vehicles utilise vehicle feedback to support the driving task and ensure safe and efficient travel [63]. Feedback is provided in the form of auditory, tactile or visual feedback; all of which support the primary task of driving in different ways. In the context of auditory feedback, engine, transmission, road and aerodynamic noise all contribute substantially to the driver’s understanding of the vehicle’s state [66]. However, vehicle manufacturers increasingly strive to create quieter vehicles, both internally and externally. From a quality standpoint this may be advantageous, though research has shown that diminishing primary driving task auditory feedback causes unexpected driving behaviour such as faster driving and reduced situational awareness [63]. Primary task related auditory feedback e.g. road noise, tyre noise, mechanical engine noises, is also used more readily by inexperienced drivers who make little use of visual aids such as the speedometer[33].
Auditory feedback in manually driven vehicles is most often used to present information related to secondary driving tasks and for this purpose it has been shown to be particularly effective in contrast to other modalities [20,30,51]. However, with regards to presenting primary driving task information via auditory feedback, there has been little research conducted. Auditory feedback has also proved to be a necessity for vehicles that use alternative propulsion technologies, for instance electric vehicles, to ensure drivers are aware of the vehicle’s engine state [45,65]. In the context of automated vehicles, research into the usefulness of auditory feedback is still in its infancy. Studies have proved that auditory feedback is an effective means to present information compared to visual feedback during handover of control situations in automated vehicles [52]. However, no investigations have been conducted to determine whether auditory feedback can be used to provide information related to the actions of an automated vehicle, and ultimately re-establish a connection between the driver and their vehicle.
This paper examines whether spatially presented, synthesised auditory feedback can bridge the gap between driver and vehicle that is encountered when transitioning from manual operation towards fully automated vehicles. We first gathered information on how drivers respond to auditory feedback in manually operated vehicles during a preliminary observational field study. This study established a taxonomy of driving sounds, and highlighted that drivers were in favour of repositioning primary driving sounds around the vehicle cabin. These results prompted the development of artificial, synthesised auditory feedback presented spatially around the vehicle cabin, known as Spatial Earcons. This set of sounds was designed to replicate existing primary driving sounds, such as acceleration, but made use of three-dimensional spatialisation to provide additional spatial information.
Three research questions were formed that both the preliminary field study and driving simulator study would answer, these were:
1. How should auditory feedback for primary driving task information be presented in automated vehicles? (RQ1)
2. Are Spatial Earcons more useful than Existing Vehicle Sounds to present primary driving task information in automated vehicles? (RQ2)
3. Can Spatial Earcons provide a feeling of control to drivers of automated vehicles? (RQ3)
2 RELATED WORK
2.1 Automated Vehicles
With the advancement towards fully automated vehicles, a continuum now exists between traditional manually operated vehicles and their automated counterparts. Along this continuum are a multitude of computerised systems designed to provide assistance to the driver, commonly known as Advanced Driver Assistance Systems (ADAS) [3]. The National Highway Traffic Safety Administration of North America (NHTSA) [43], has highlighted five separate levels of vehicular automation. While automated vehicle development is still in its infancy, the automation levels set out by the NHTSA’s policy statement have subsequently been adopted in a number of automotive human factors research studies [14,24,37]. Level 0 is defined as the human driver having total control of the vehicle’s primary controls at all times. In contrast, Level 4 sees the vehicle perform all safety critical driving functions, requiring only destination input by the driver. The driver would not be expected to be available for control at any point during their journey.
Levels 1, 2 and 3 outline increasing levels of automation from single function automation (1) to limited self -driving automation (3). It is necessary to point out that the vast majority of automated vehicles currently operate at NHSTA Level 3 automation, requiring a driver to be present for occasional control provided sufficient transition time between operational states is given. The automation level classifications proposed by the NHTSA are used throughout this work as a framework for the implementation of manual and automated driving conditions during the simulated driving study. In this research, the terms manual driving or manual vehicle are used to refer to vehicles that obligate the driver to monitor the driving environment and operate the driving task, therefore categorised as NHTSA Level 0 (No Automation). Whereas, the terms automated driving or automated vehicle refer to vehicles that monitor the driving environment and take over the driving task without input from the driver, categorised as NHTSA Level 4 (Full Self-Driving Automation). These contrasting levels were selected because they provided a clear distinction between the shift in control between driver and vehicle as automation increases. Additionally, Levels 0 and 4 reduced the number of driving variables that are present in other automation levels, thereby enabling us to replicate them in an appropriate and controlled way for research purposes. By comparing such contrasting levels of vehicle automation, findings could also serve to inform the design of auditory feedback in vehicles across different levels of automation.
2.2 Vehicular Feedback
During secondary tasks, insufficient or inappropriate auditory feedback has been shown to cause increased distraction to the primary driving task [23]. Poorly designed feedback for secondary driving task information such as in Satnavs can in fact distract the driver and significantly impede the primary task of driving [23]. While varying feedback modalities have been researched for the presentation of secondary driving task information, Nees and Walker [41] suggest that sound is yet to be used to its full potential. Secondary driving task in-vehicle technologies e.g. Satnav, that use auditory feedback are well documented [17,27,36]. Auditory feedback for such systems has also been shown to distract drivers significantly less than visual cues [21].
2.3 In
-
Vehicle Auditory Displays
Existing in-vehicle technologies have yet to use sound to its full potential for information display [41]. It is important to note that until 2005, auditory in-vehicle systems had been limited due to the mechanical hardware used to produce sounds [7]. Nowadays however, with the development of digital computing technologies, databases of sounds can be replicated and entirely new sounds can be created to a substantially high fidelity [41]. Auditory feedback has been implemented in many driver assistance systems to provide information related to: collision avoidance, vehicle state alerts, navigational aids and as part of auditory displays for in-vehicle information systems (IVIS) [64]. Throughout this array of driver assistance systems, a multitude of sound cue types have been utilised that fall into two distinct categories; speech and non-speech auditory feedback [62]. Non-speech based auditory feedback can be created using auditory icons or earcons. Auditory icons are natural pre-recorded sounds that relate to a specific event, object or action which are then mapped to system messages and objects [61]. In contrast, earcons are audio messages consisting of structured musical tones, and are useful for conveying abstract events because they are not required to relate directly to a specific event, object or action, unlike auditory icons [15]. The decision to choose between speech and non -speech sounds depends on whether the information presented relates directly to the driving task. This is a key concern when designing auditory information for manually operated vehicles, as the resulting auditory output must not interfere with the cognitive tasks involved in driving [62].
Sounds used within an auditory in-vehicle display should be designed to ensure all users react in the same way [61]. This is achieved by ensuring any sound used elicits an emotional or affective reaction when heard. For example, the perceived emotional response from a warning sound must ensure that the corresponding action is prompted immediately [18]. This is in keeping with the perception that auditory in-vehicle displays are more advantageous in their use over vision-based displays when rapid response times are necessary [36]. For instance, in a comparative study by Scott and Gray [54] the use of auditory feedback was preferred by users in comparison to visual and tactile feedback for rear-end collision warnings.
The use of three-dimensional audio spatialisation has also proved to have benefits when used for vehicular way-finding and situation awareness within a virtual driving simulator [22]. Brewster and McGookin [35], have also shown that the identification of earcons is significantly increased when presented spatially in comparison to non-spatial presentation.
Previous research shows that auditory in-vehicle displays are not only an effective method for information presentation in vehicles, they are the preferred modality when used for the notification of safety warnings. However, sounds used within auditory in-vehicle displays must be acceptable to users [36]. This should be achieved by using sounds that are not unpleasant or annoying. Fundamentally, the meaningfulness of each sound is important, especially when auditory in-vehicle displays are used during emergency situations [32].
3 PRELIMINARY STUDY
A preliminary field study with eight participants was undertaken to collect a taxonomy of sounds present in manually operated vehicles that present information to the driver. Collecting these sounds helped to ascertain the extent to which auditory feedback helps drivers to feel in control of their vehicle. These sounds were also categorised to highlight how much importance was given to them by drivers. This information helped to confirm which types of driving sounds would be useful for drivers of automated vehicles. Prior to conducting the main study with the eight participants, two additional pilot studies were conducted in order to create an initial taxonomy of driving sounds (Table 1). Participants were asked during both the pilot and main field study to travel a regularly driven car journey for a minimum of fifteen minutes. During each journey, the frequency of occurrence for each sound from our taxonomy was recorded by the researcher. Sounds that provoked a reaction from the participants, and those that were actively identified as being heard were also recorded. This was done to determine how often the sounds from our taxonomy occurred during a typical car journey, and how often drivers responded to these sounds. The preliminary field study was also used to gather information regarding which sonic attributes e.g. Pitch. Finally, the preliminary study explored whether participants felt the direction in which sounds appeared was useful to present information related to the driving task.
3.1 Procedure
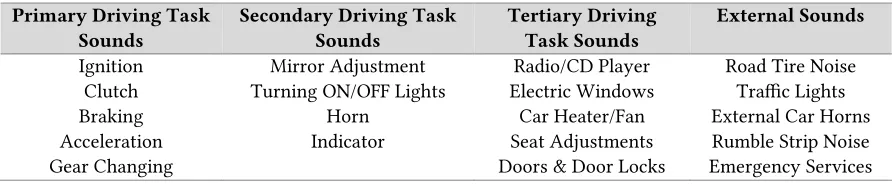
A taxonomy of twenty expected sounds (Table 1) was created based on the sounds that had occurred during two fifteen-minute pilot studies conducted before the main preliminary study took place. This taxonomy was used to note down the different sounds as they occurred (Sounds Occurred) during each journey and included space for any new sounds that occurred during the preliminary field study. Any sounds that were actively identified by participants (Sounds Identified) were also noted. To capture these sounds, participants were required to raise a finger from the steering wheel to signify that they had heard a particular sound. They were then asked to state the sound that had been identified. Additionally, any sounds that initiated an interaction (Response Provoked) between the participant and their vehicle were also noted. For example, a response was noted if an external horn was heard, causing the driver to alter their driving routine e.g. braking.
Table 1. Initial Taxonomy of Sounds from Two Pilot Studies
Primary Driving Task Sounds
Secondary Driving Task Sounds
Tertiary Driving Task Sounds
External Sounds
Ignition Mirror Adjustment Radio/CD Player Road Tire Noise
Clutch Turning ON/OFF Lights Electric Windows Traffic Lights
Braking Horn Car Heater/Fan External Car Horns
Acceleration Indicator Seat Adjustments Rumble Strip Noise
Gear Changing Doors & Door Locks Emergency Services
The study took place in and around the cities of Edinburgh and Glasgow where participants were required to drive their own vehicle on a route they commonly drive for approximately fifteen minutes whilst any sound occurrences were noted down by the observing researcher. Participants, recruited via word of mouth, were given the opportunity to opt in before agreeing to undertake the study. The age range of the eight participants was 17 – 56 with a median age range of 26 – 35. There were two female and six male participants with varying degrees of driving experience, having held their licenses for a median range of 5 – 10 years. Four participants owned their vehicles, while the rest had regular access to a family/work car. Average weekly drive time amongst participants was between 3 – 6 hours with the most common journeys being work related, such as commuting, followed by journeys to recreational activities. Participant metrics are shown in Table 2.
Table 2. Individual characteristics of participants that took part in observational field study.
The cars used were either two or four door hatchbacks and saloons, ranging from four to nine years old. None of the vehicles featured any advanced driver assistance systems (ADAS) and therefore pertained to the typical NHTSA Level 0 vehicle automation classification [43]. The vehicles used in the preliminary study included systems that only provided warnings (auditory, visual etc.) and automated secondary controls (wipers, headlights etc.). Before commencing their journey, the participants were briefed about the study and its purpose then asked to fill out a pre-evaluation demographic questionnaire. Participants were then asked to enter the car to begin the study.
Age Gender Driving License Length
Car
Owner Average Drive Time/Week Common Journey Frequency
Participant 1 26 - 35 M 5 - 10 Yrs. Yes 12+ Hrs Work
Related Four/week
Participant 2 56 - 65 F 20+ Yrs. Yes 3 - 6 Hrs Commute Twice Weekly
Participant 3 26 - 35 M 5 - 10 Yrs. Family
Car 0 – 0.5 Hrs Recreation WeeklyOnce
Participant 4 17 - 25 M 2 - 5 Yrs. Family
Car 0.5 - 1 Hrs Commute/ Recreatio n
Once Weekly
Participant 5 17 - 25 M 0 - 2 Yrs. Yes 3 - 6 Hrs Recreatio
n WeeklyTwice
Participant 6 17 - 25 F 0 - 2 Yrs. Family
Car 0.5 – 1 Hrs Recreation WeeklyTwice
Participant 7 26 - 35 M 5 - 10 Yrs. Family
Car 1 - 3 Hrs Recreation WeeklyOnce
[image:6.612.83.533.356.581.2]Once participants had completed their regular driving route, a post-evaluation questionnaire was administered that featured a number of five-point Likert scale-rated questions. These questions gathered data regarding the vehicular sounds heard during each journey, as well as participants’ subjective opinions of the sounds. Participants were then asked to position fifteen of the twenty taxonomy sounds from Table 1 on a two-dimensional car diagram (see Fig. 2) in the location they would prefer to hear them. Specifically, sounds related to primary (5), secondary (4) and tertiary (6) driving tasks were to be positioned on the diagram. The five external sounds (see Table 1) were omitted from this stage of the evaluation, as they did not occur from within the vehicle. Finally, participants were asked to highlight which sonic parameters captured their attention when hearing each of the sounds from the taxonomy. The sonic parameters participants were asked to highlight were: Pitch, Timbre, Loudness, Tempo, Repetition, Melody and Duration. Participants were provided with descriptions of each sonic parameter to ensure they were aware of each. This provided each participant with a common understanding of each sonic parameter.
3.2 Findings
3.2.1 Newly Obtained Sounds . Fourteen new sounds were obtained during the preliminary field study, in addition to the pilot studies. Of these fourteen new sounds, two were primary driving task sounds, nine were secondary task sounds and three were external sounds. No additional tertiary task sounds occurred during the preliminary field study. The fourteen newly obtained sounds were most often notifications for various mechanical car features e.g. service requirement notifications, tyre pressure warnings. These findings showed that primary and tertiary task sounds were similar across the spectrum of vehicles that were used during the study. However, depending on the brand, age and features of each car, secondary task sounds varied.
[image:7.612.133.494.433.592.2]3.2.2 Sounds Occurred, Sounds Identified & Responses Provoked . The twenty taxonomy sounds (Table 1) occurred a total of 258 times during the eight journeys. Fig. 1 displays the mean occurrences, number of responses provoked and the total number of times sounds were identified by drivers across primary, secondary, tertiary and external sound categories, as mentioned in the Procedure (see Section 3.1, p. 4). To reiterate, sounds identified were explicitly noted by the driver and communicated to the observing researcher by raising a finger. Sounds provoked were those that initiated a direct interaction between the participant and the vehicle.
Fig. 1. Mean sound occurrences, responses provoked and sounds identified.
Primary task sounds provoked a response 55% of the time. Secondary task sounds provoked a response 85.4% of the time. Tertiary task sounds provoked a response 77.8% of the time, and external sounds provoked a response 40.6% of the time in participants. These results propose that while primary driving task sounds
32.00
12
3 6.4
17.60
10.25
2.33 2.60
15.00
9.25
1.83 2.00
0 5 10 15 20 25 30 35
Primary Secondary Tertiary External
Mean Occurrence
Mean Response Provoked
Mean Sound Identified
(55%)
(85.4%)
occurred most often across all of the journeys, fewer responses were provoked than the less frequently occurring secondary and tertiary driving task sounds. Total sound occurrence findings highlighted that sounds related to primary driving tasks occurred more often than other categories (secondary, tertiary and external) during participant journeys.
However, findings also showed that primary driving task sounds provoked fewer responses from participants than the other sound categories. External sounds were the least identified of all sound categories (31%) and provoked the fewest responses (41%). Primary driving sounds occurred more often than secondary and tertiary task sounds, but were identified least often. This result suggests drivers may have felt it was unnecessary to respond to primary driving sounds while the same continuous information was being provided. In contrast, participants may have given the less frequent secondary and tertiary driving task sounds more importance, resulting in more provoked responses. This suggests that participants assessed the frequency of the sound and its importance in relation to the driving task before making their decision to respond.
The preliminary field study findings also suggested that participants prioritised sounds depending on the function to which they are attached. For example, the exterior sound, “Road Tyre Noise” occurred twenty-four times yet provoked a response five times, and was identified by two participants. “Road Tyre Noise” was a continuous sound that increased in intensity depending on the speed of vehicle. Due to its continuous nature, participants may have deemed it less important and therefore chose not to respond to it whilst it was audible. In contrast, the indicator sounded a total of forty times, thirty-three of those occurrences provoked a response and thirty were actively identified by participants.
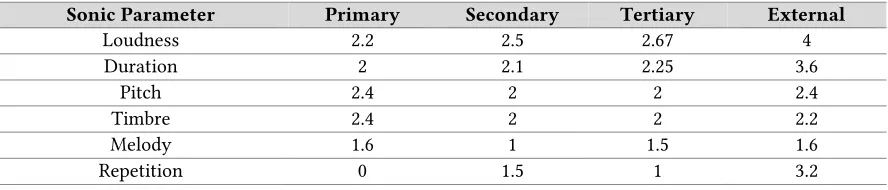
[image:8.612.86.530.520.615.2]3.2.3 Sonic Parameter Findings . After hearing each of the different sounds from our taxonomy, participants were asked to rate which sonic parameters captured their attention most frequently using five -point Likert scales. The sonic parameters participants were asked to highlight were: Pitch, Timbre, Loudness, Tempo, Repetition, Melody and Duration. Table 3 highlights the mean participant responses to each sonic parameter that captured their attention different sounds from each category were heard. Mean responses suggested Pitch and Timbre captured participant attention most often when hearing primary driving task sounds. Participants found Repetition captured their attention least for primary driving sounds. Loudness captured participant attention most often for secondary task sounds, tertiary task sounds, and external sounds. Participants also highlighted that Pitch and Duration captured their attention when hearing sounds related to secondary and external driving tasks. Repetition was also useful to capture participant attention when hearing external sounds. It is important to note that at low loudness levels, perceptual interactions can occur with Pitch and Loudness, which may have diminished the effectiveness of Pitch to capture driver attention at low volumes [42].
Table 3. Mean participant responses for sonic parameters across sound categories. Five-point Likert scale-rated data. (1 = Strongly Disagree, 5 = Strongly Agree).
Sonic Parameter Primary Secondary Tertiary External
Loudness 2.2 2.5 2.67 4
Duration 2 2.1 2.25 3.6
Pitch 2.4 2 2 2.4
Timbre 2.4 2 2 2.2
Melody 1.6 1 1.5 1.6
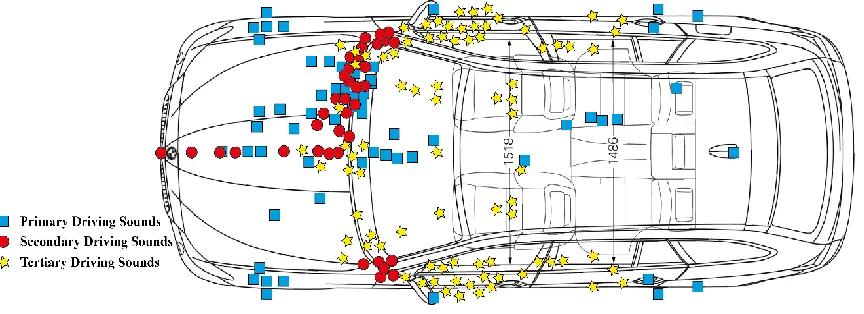
Fig. 2. Participant sound positioning. Blue squares represent primary task sounds, red circles represent secondary task sounds and yellow stars represent tertiary task sounds.
3.2.3 Sound Direction Findings . Participants were asked whether they felt the direction in which sounds appeared was useful to present information related to the driving task. This Likert scale-rated question ranged from 1 (Strongly Disagree) to 5 (Strongly Agree). The majority of participants (6 out of 8) stated they “Somewhat Agreed” (4 on Likert scale) that the direction in which sounds appeared was useful for the presentation of driving information. Participants were asked to mark down the locations of different sounds from our taxonomy to highlight where they would have preferred to hear each sound originate. Fig. 2 displays the various sound positions marked by participants for each task category; primary, secondary and tertiary as highlighted in the taxonomy in Table 1. Blue squares represent primary driving sound responses, red circles represent secondary sound responses and yellow stars represent tertiary sound responses. Clustering of primary, secondary and tertiary task sounds in front of the driver-side dashboard was observed as well as numerous sounds located along the front door panels on both sides of the car diagram. This clustering was expected as the study was conducted on UK roads where vehicles drive on the left-hand side of the road.
At first glance, the positioning of driving sounds appeared to reflect locations where participants interacted with vehicle controls, as in Tönnis et al.’s research [59]. However, further assessment of sounds within each task category (primary, secondary and tertiary) highlighted that participants selected a variety of alternative positions often unrelated to the location of physical control.
3.3 Preliminary Study Conclusions
Our preliminary study established that primary driving task sounds accounted for the majority of sound occurrences across the car journeys taken. While primary driving task sounds occurred most often, participants reacted to them less than when secondary and tertiary task sounds occurred. A similar trend was also shown for the identification of sounds. These findings suggested that the participants first assessed how often the sounds were heard, then assessed the importance of the sound in relation to the driving task. These assessments then influenced their decision to respond to the sound.
Participants highlighted that overall the Loudness of the sounds heard captured their attention most frequently. However, when sounds were classified by driving task, the Pitch and Timbre ofprimary driving task sounds captured the attention of participants most frequently. Whereas for secondary, tertiary and external driving task sounds, the Loudness of the sounds captured participant attention most frequently. Sound direction findings showed that participants placed secondary and tertiary task sounds at their physical control locations as shown in Fig. 2. In contrast, primary driving task sounds were more often placed in unexpected locations unrelated to the sound’s physical control location, such as the placement of braking sounds at the rear of the vehicle as one participant noted. Our findings do not establish why participants placed primary task sounds in more unexpected locations. However, findings suggest that participants were more willing to have primary driving task sounds appear in unexpected locations rather than secondary and tertiary task sounds. Overall, the preliminary field study’s findings highlighted that auditory feedback contributed substantially in the presentation of driving information in the participants’ vehicles.
Previous research by Beattie et al. [10] highlighted that statically spatialising primary driving sounds provided lower driver workloads in comparison to traditionally located driving sounds. This research also highlighted the usefulness of earcons as an alternative sound cue type to well-recognised mechanical driving sounds [10]. Based on the findings from our preliminary field study, we extended Beattie et al.’s previous research by developing a set of Spatial Earcons. Our Spatial Earcon study was then conducted in a more realistic outdoor environment than Beattie et al.’s study [10] to evaluate the usefulness of these types of earcons for information presentation in automated vehicles.
4 SPATIAL EARCON STUDY
The aim of this study was to determine whether our Spatial Earcons could provide a greater feeling of control to drivers of automated vehicles than Existing Vehicle Sounds. To address this aim, a user study was conducted using a desktop driving simulator setup located in an outdoor car park in order to answer questions two and three of this research, which were:
2. Are Spatial Earcons more useful than Existing Vehicle Sounds to present primary driving task information in automated vehicles? (RQ2)
3. Can Spatial Earcons provide a feeling of control to drivers of automated vehicles? (RQ3)
4.1 Driving Task
events such as slow-moving or turning vehicles. Participants all experienced the same driving route, but encountered the same volume of AI vehicles at different stages of the journey depending on how they were populated when the driving route commenced. Participants were presented with a first-person view in order to provide a real-world driving position and were required to drive on the right-hand side of the road, as this was the default setup of OpenDS and the study was conducted with UK drivers.
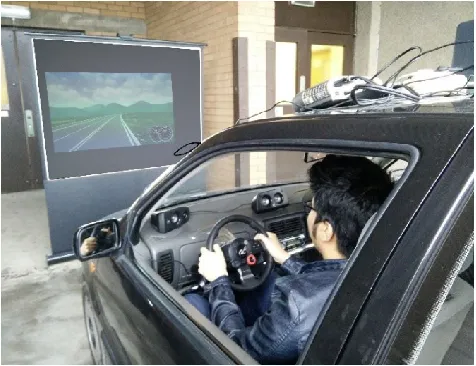
[image:11.612.187.425.227.410.2]To produce the simulated automated vehicle journeys, a similar approach to that of Nyeste and Wogalter [65] was used. Their study presented videos of a Toyota Prius driving whilst different sound types were played back to users. Our video clips lasted five minutes and featured a series of driving manoeuvres again within the ‘Countryside’ scenario of OpenDS. The video featured the same view participants experienced during the manual stage of the study. During the automated stage, participants were asked to sit and observe the journey, paying attention to the sounds, until the scenario completed.
Fig.3. Driving simulator setup
4.2 Auditory Displays
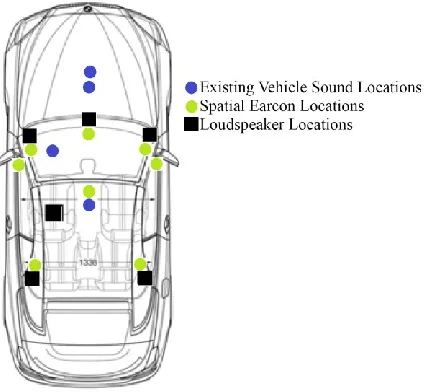
Our two auditory display types each contained four major primary driving sounds as noted by [9]: acceleration, braking, indication and gear changing. All sounds were delivered using a 5.1 surround speaker setup, positioned around the vehicle. Synthesised road noise was added to OpenDS that modulated by loudness depending on vehicle’s speed. We also ensured participants could clearly hear any external driving noises occurring from the environments of our study setup. Created sounds are available as part of the publication as a downloadable dataset at http://www.ittgroup.org/file-repository/.
4.2.1 Existing Vehicle Sounds . The Existing Vehicle Sounds were a group of familiar modern internal combustion engine (ICE) sounds produced by Beattie et al. [4] and can be obtained as a downloadable resource from http://www.ittgroup.org/file-repository/(study2_sound_part1 & study2_sounds_part2). These sounds were from a Volkswagen Polo and elicited the typical sonic characteristics participants would commonly hear whilst controlling their own vehicle.
Sounds acceleration/deceleration. Whereas gear-changing and indicator sounds were discrete abstract earcons used to signify the event state change. The following section discusses each individual parameter and how the respective earcons were designed around these, beginning with Timbre, Register and Rhythm to create the basic structure [15].
4.2.2.1. Timbre . Each of the different earcons created were separated into distinct families using differing Timbres. Acceleration and braking sounds were created using a continuous synthesised waveform. This sound was created using two complex waveforms layered on top of each other, which created a distinct Timbre with multiple harmonics, similar to the ‘hum’ of a vehicle engine. The gear changing earcon used a synthesised keyboard ‘saxophone’ Timbre, and the indicator sound utilised a synthesised keyboard ‘marimba’ Timbre. Additionally, the vehicle ignition featured a synthesised ‘Rhodes keyboard’. The different Timbres used were distinct and easy to tell apart. This ensured that drivers would be able to differentiate each family of earcons when heard.
4.2.2.2. Register & Pitch . The Register and Pitch varied depending on the information each earcon conveyed. The Pitch of the acceleration and braking earcons was mapped to the engine’s RPM and varied across two octaves depending on the vehicle’s engine state. At 700RPM (engine idle) the sound played on note F3 (174.61Hz). At maximum RPM (7000RPM), the sound played two octaves higher on note F5 (698Hz). Three earcons were needed to represent changing up a gear, changing down and reverse gear. All gear-changing sounds used two notes within 1 octave. The gear-up earcon played the first note on C5 (523Hz) then played C#5 (554Hz), one semi-tone up, approximately 100ms after the first note. The gear down earcon reversed the order of notes, starting on C#5 and ending on C5. The reverse gear earcon first played C5 then 100ms after played C4. The indicator earcon was played on note G6 (1567Hz). The indicator earcon played on a singular note to mimic the indicator sound of a typical manually controlled vehicle. Finally, the ignition earcon played three consecutive notes from the CMaj chord starting on middle C (261.6Hz) as the vehicle was turned on. When the ignition was turned off the notes of CMaj were played consecutively in reverse order.
4.2.2.3. Rhythm, Duration & Tempo . In accordance with Brewster et al.’s [15] guidelines, Rhythms of each earcon family were made as different as possible to minimise confusion when hearing them. The acceleration/braking earcon was a continuous tone heard immediately after the vehicle ignition was activated. This sound fluctuated in Pitch, and due to the use of two separate waveforms, as the Pitch increased the phase between each waveform increased. Fluctuations in phase modulated the Rhythm of the sound, which helped convey an increase and decrease in engine RPM. The gear change earcons all utilised the same Rhythm, Duration and Tempo as they were part of the same family. Each of the two notes that made up the gear change earcons played for 200ms and featured a short delay of 200ms until the sound stopped. Between each note was a pause of 100ms. The total length of time each earcon lasted was half a second. The Tempo of each gear change earcon was constant at approximately 120bpm. The indicator earcon was a singular note played on C4 with no change in Rhythm, and repeated at a Tempo of 80bpm. This Tempo was selected as it was the approximate Tempo of the indicator sound used in the Existing Vehicle Sounds group. The sound played once the indicator was activated on the Logitech steering wheel controls (see Section 4.4) then ended once the indicator function was cancelled by the participant. The ignition sound played at a Tempo of 60bpm. Its Rhythm was constant with the same length of silence between each note played. The length of time between each played note was 400ms, with the length of note being approximately 300ms with a short delay that lasted 200ms.
4.2.2.4. Intensity . The Intensity of each earcon did not change. All sounds were normalised to -3dB and participants were welcome to adjust the overall volume of the audio played back during each driving scenario to a comfortable level.
Furthermore, its inclusion helped to determine whether it was useful for offering an improved feeling of control in an automated vehicle.
[image:13.612.208.420.198.394.2]Acceleration/deceleration earcons were spatialised to be heard at equal loudness from all speakers, placing the listener at the centre of the sound source so that it was easily audible from 360o around them. Spatialisation of the indicator sound followed the method used by Beattie et al. [10] where it was panned fully left or right depending on the selected direction. Gear changing sounds were spatialised at the location of the gearbox/gear shifter in a typical manual vehicle. Fig. 4 displays the locations of each earcon within the cabin of the vehicle.
Fig. 4. Auditory display sound locations and speaker placement.
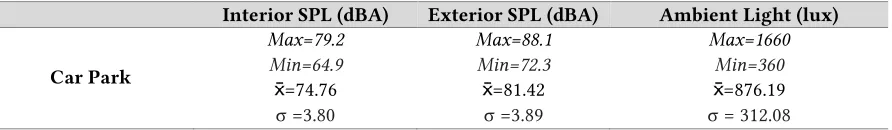
4.3 Study Location
Table 4. Max, min, mean ( ) and standard deviation (σ) for ambient light & sound pressure levels (SPL) in both study
locations.
Interior SPL (dBA) Exterior SPL (dBA) Ambient Light (lux)
Car Park
Max=79.2 Min=64.9 =74.76 σ =3.80
Max=88.1 Min=72.3 =81.42 σ =3.89
Max=1660 Min=360
=876.19 σ =312.08
4.4 Simulator Equipment
Participants were seated within the front left passenger seat of a Volkswagen Polo 6N car, which was a small three-door hatchback. A Logitech Driving-Force GT gaming steering wheel and pedals were fastened to the dashboard, in front of the passenger seat and operated by each study participant. Steering wheel buttons were mapped to the indicator, gear up/gear down and ignition on/off functions. This was done as the Logitech Driving-Force GT steering wheel did not feature an additional control stalk as commonly used in most vehicles. A projector was placed on the vehicle’s roof and projected on to a large screen in front of the vehicle to display OpenDS via a laptop computer. Sound was delivered using Logitech Z506 Surround Sound speakers. Speakers were positioned within the cabin of the vehicle using the Dolby 5.1 speaker positioning format as shown in Fig. 4. Left and right front speakers were placed 30o from the centre speaker. Rear left and right speakers were placed 120 o from the centre speaker. The subwoofer was located in the rear foot well of the vehicle. This speaker placement ensured an optimised listening position and assured the surround effect was administered appropriately.
4.5 Study Procedure
Participants were first given an introduction to the study, then were asked if they wished to continue before completing a short pre-evaluation questionnaire. Participants were then presented with the driving simulator software setup within the vehicle’s cabin and were briefed on the controls. They were given ten minutes to become accustomed to driving within the simulator before the main phase of the study commenced. Driving conditions and auditory display type were counterbalanced to minimise any possible order effects. Each participant undertook four scenarios in total, lasting five minutes each. During the scenarios, participants were told to pay specific attention to the sounds within each scenario. To ensure this was upheld, direct observations were taken by the lead researcher during each scenario. Between each scenario participants were given approximately five minutes to complete each of the subjective questionnaires, as described in the Data Gathering Methods section (see Section 4.7). Upon completion of the scenarios participants were then provided with a short post-evaluation questionnaire. The total length of each session was approximately one hour.
4.6 Participants
4.7 Data Gathering Methods
Three data gathering methods were completed after each of the four scenarios. Driver workload was first assessed using the Driver Activity Load Index (DALI) questionnaire [49]. Next, usability of the auditory displays was measured using a System Usability Scale (SUS) [16]. Likert scale-rated questions were also distributed to obtain numerical qualitative data related to the research questions of this paper. After the final scenario was completed, an additional post-evaluation questionnaire was presented that featured a set of open ended questions. These questions were used to ascertain individual subjective perspectives that the participants may have had after undertaking the study. The following sections discuss each of the data gathering methods in more detail.
4.7.1 Driver Activity Load Index (DALI). The Driver Activity Workload Index (DALI) [49] has been developed and used to evaluate workload specifically within the context of driving, with or without the support of in-vehicle systems [49]. The DALI is heavily based on the NASA-TLX [28], but is less frequently used. It features six factors (global attention demand, visual demand, auditory demand, situational stress, temporal demand and interference), scored from zero to five (low to high). Due to these altered factors, the DALI is an effective tool to assess workload related to in-vehicle information systems (IVIS) [13,50]. It has been implemented to assess workload for speech-based warnings during manual driving [4,19].
4.7.2 System Usability Scale (SUS). The System Usability Scale (SUS), developed by Brooke, is a commonly used tool for measuring the usability of a wide variety of products and services [16]. The SUS was administered to participants during the study so that the usability of the different auditory displays could be measured as opposed to the driving simulator itself [10]. For this work, the original SUS was slightly modified by changing all instances of the word “system” to “auditory display”. According to O’Brien and McCay-Peet [46], questionnaires can be adapted so long as the changes made are minor, provided the wording of the change does not alter the nature of what is being measured. They point out that a typical example is the modification of the name of the system used when evaluating usability via the SUS. For example, a similar modification to the SUS questionnaire was used by Micallef et al. [38] for the assessment of mobile security usability, where “system” was replaced with “phone protection mechanism”.
4.7.3 Likert Scale-Rated Questions . Six five-point Likert scale questions were also given to obtain numerical qualitative data related to this paper’s research questions, as stated in the Introduction. For Likert questions one to four and question six, higher scores were better whereas for question five, a lower score was better. The questions were as follows:
1. Did the auditory display in this scenario enhance your awareness of the vehicle’s actions? 2. Did the auditory display presented in this scenario enhance your awareness of your own actions? 3. Did you feel in total control of the vehicle throughout this scenario?
4. Do you feel that the sounds in this scenario would make you aware of the intended actions of an automated vehicle?
5. Do you think the auditory display in this scenario would be a distraction to the primary driving task?
6. How satisfied are you with the sounds of the vehicle in this scenario?
4.7.4 Post Evaluation Questions . After completing all of the scenarios, a series of open-ended questions were administered to gather participant opinions on the different auditory displays they used during the study. The questions were as follows:
1. Please state which was your preferred sound cue type?
2. Please state any sounds you expected to hear during the study but were absent?
3. What extra auditory information would you like to have been provided with whilst driving? 4. Did the driving simulator setup provide a realistic driving experience?
5 RESULTS
DALI and SUS results were analysed using a two-way within-subject repeated measures ANOVA with driving condition (2 levels) as the independent variable and auditory display (2 levels) as the dependent variable. Likert scale-rated questions were analysed using Wilcoxon signed-rank tests. Mean and standard deviations are reported for DALI and SUS results. Median values and interquartile ranges are reported for Likert questions. The acronyms EVS and SE are used to represent Existing Vehicle Sounds and Spatial Earcons within Fig. 5 and Fig. 6.
5.1 DALI Workload Analysis
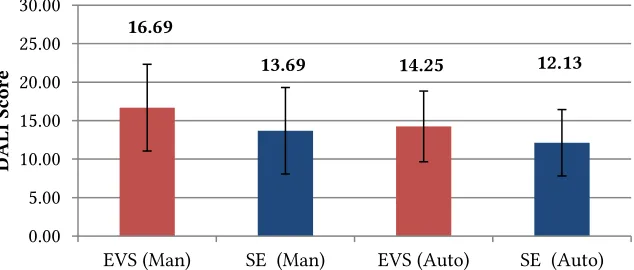
[image:16.612.152.469.346.481.2]A repeated-measures ANOVA showed that there was no statistically significant interaction between driving condition and auditory display type for DALI workload (F 1, 15 = .160, p=0.694). Workload was not significantly different between auditory display types (F 1, 15 = 1.162, p=0.298), or driving conditions (F 1, 15 = 1.866, p=0.192). Fig. 5 displays the mean total DALI workload scores for each auditory feedback method during driving conditions. Mean workload score for Existing Vehicle Sounds (15.46 ± 1.39) was higher than Spatial Earcons (12.91 ± 1.53), a mean difference of 2.56 (95% CI, 12.5 to 18.43) but workload was not significantly higher than Spatial Earcons (p=0.298). Manual driving (15.19 ± 1.19) produced higher mean workloads than automated driving (13.19 ± 1.05), a mean difference of 1.46 (95% CI, 12.64 to 17.73) but workload was not significantly higher during manual driving conditions (p = 0.192). However, workload was expected to be higher during manual driving as participants were required to physically operate the vehicle in order to complete the driving task during the evaluation.
Fig. 5. Mean workload scores for auditory display during driving conditions. Error bars represent St. Error. (Max score = 30, lower = better). EVS acronym represents Existing Vehicle Sounds, SE represents Spatial Earcons.
5.2 Usability (SUS) Results
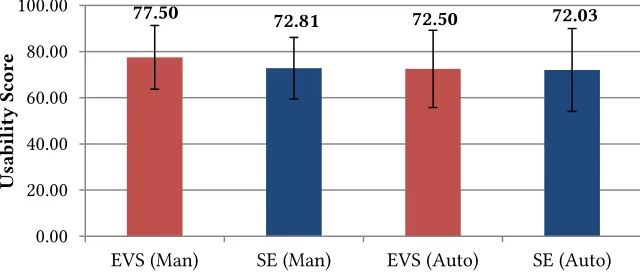
A repeated-measures ANOVA showed that there was no statistically significant interaction between driving condition and auditory display type on usability (F 1, 15 = .575, p=0.46). Usability was not significantly different between auditory display types (F 1, 15 = 0.724, p=0.408), or driving conditions (F 1, 15 = 0.347, p=0.564). Fig. 6 displays the mean usability scores for each auditory feedback method during driving conditions. Mean usability for Existing Vehicle Sounds (75 ± 2.88) was higher than Spatial Earcons (72.42 ± 2.74), a mean difference of 2.58 (95% CI, 68.87 to 81.14) but usability was not significantly higher than Spatial Earcons (p=0.408). This finding shows that both Spatial Earcons and Existing Vehicle Sounds produced similar levels of usability during manual and automated driving conditions. Mean usability for manual driving (75.16 ± 2.75) was higher than automated driving (72.27 ± 3.95), a mean difference of 2.89 (95% CI, 69.29 to 81.03) but usability was not significantly higher during manual driving conditions (p 0.564).
16.69
13.69 14.25 12.13
0.00 5.00 10.00 15.00 20.00 25.00 30.00
EVS (Man) SE (Man) EVS (Auto) SE (Auto)
DA
LI
S
co
Fig. 6. Mean SUS scores for auditory display during driving conditions. Error bars represent St. Error. (Max score = 100, higher = better). EVS acronym represents Existing Vehicle Sounds, SE represents Spatial Earcons.
5.3 Likert Scale Analysis
Q1. Enhancing Awareness of Vehicle’s Actions . Neither auditory display type was statistically significantly better at enhancing driver awareness to the actions of the vehicle when compared (z=-0.1062, p=0.288). This finding shows that both Spatial Earcons and Existing Vehicle Sounds were similar in terms of effectiveness when used to enhance driver awareness to the vehicle’s actions during manual and automated driving conditions. Driving conditions were also found to be statistically significantly similar at enhancing driver awareness to the actions of the vehicle when manual and automated driving were compared (z=-1.155, p=0.248).
Q2. Enhancing Awareness of Own Actions . Existing Vehicle Sounds (Median = 4, IQR = 4 - 4) enhanced driver awareness of their own actions significantly more than Spatial Earcons (Median = 3.5, IQR = 2 -4), (z= -2.627, p=0.009). This result may have been due to the familiarity of Existing Vehicle Sounds in contrast to Spatial Earcons. Participants may have been able to use these sounds more effectively to be aware of their own actions. Participant awareness of their own actions was significantly enhanced during manual driving in comparison to automated driving (z=-2.643, p=0.008). This finding was expected as participants were actively involved during manual driving conditions. Table 5 highlights comparisons and significant values for question two.
Q3. Feeling of Control . Neither auditory display type provided a significantly greater feeling of control when compared (z=-1.737, p=0.082). Manual driving was significantly better than automated driving for providing a feeling of control (z=-2.440, p=0.015). This was expected as participants were in control during manual scenarios.
Q4. Intended Actions of Vehicle . Auditory display types were not statistically significantly different at providing driver awareness to the intended actions of the automated vehicle (z=-0.537, p=0.592). Manual and automated driving conditions also provided similar levels of awareness to the intended actions of the vehicle (z=-0.479, p=0.632).
Q5. Distraction from Primary Driving Task . Neither Spatial Earcons nor Existing Vehicle Sounds were significantly distracting during manual and automated driving (z=-0.650, p=0.515). Automated driving (Median = 2, IQR = 2 - 2) was more distracting than manual driving (Median = 3, IQR = 2 -4) (z=-2.828, p=0.005). Table 5 highlights comparisons and significant values for question two.
Q6. Auditory Display Satisfaction . Neither auditory display type was found to be significantly more satisfying to use during manual and automated driving (z=-0.760, p=0.447). Manual and automated driving were also similarly satisfying (z=-1.236, p=0.216).
77.50 72.81 72.50 72.03
0.00 20.00 40.00 60.00 80.00 100.00
EVS (Man) SE (Man) EVS (Auto) SE (Auto)
Usa
bi
li
ty
S
co
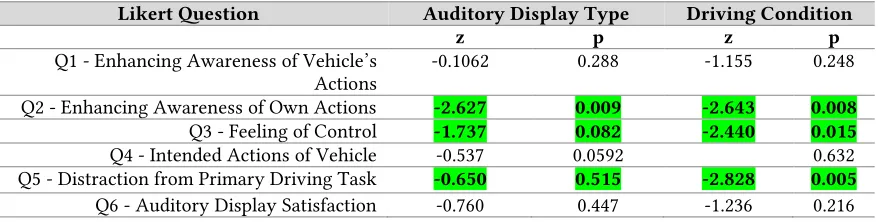
Table 5. Wilcoxon values for comparisons between auditory feedback type (Existing Vehicle Sounds & Spatial Earcons) and driving condition (Manual & Automated) for the six Likert scale-rated questions. Significant values are highlighted in
green.
Likert Question Auditory Display Type Driving Condition
z p z p
Q1 - Enhancing Awareness of Vehicle’s
Actions -0.1062 0.288 -1.155 0.248
Q2 - Enhancing Awareness of Own Actions -2.627 0.009 -2.643 0.008
Q3 - Feeling of Control -1.737 0.082 -2.440 0.015
Q4 - Intended Actions of Vehicle -0.537 0.0592 0.632
Q5 - Distraction from Primary Driving Task -0.650 0.515 -2.828 0.005
Q6 - Auditory Display Satisfaction -0.760 0.447 -1.236 0.216
5.4
Post
-
Evaluation Questions
Participants were first asked what their preferred auditory display was during the study. Twelve participants reported that they preferred using the Spatial Earcons and four preferred to use the Existing Vehicle Sounds. When asked about which sounds they expected to hear during the study, some of the participants highlighted that they expected to hear more sounds from AI vehicles that navigated the environment. One participant also pointed out that they would have expected to hear some wind noise as the vehicle moved at speed, as well as stresses on the vehicle when cornering. Thirteen of the participants did not feel that any extra auditory information was required during the study. However, three participants mentioned that it would have been useful to add additional information such as: warning sounds for over -revving, parking sounds and gear stick movements. Participants were also asked whether the driving simulator provided a realistic driving experience. This question was delivered using a Likert scale ranging from Strongly Disagree to Strongly Agree (1 – 5). Participants Somewhat Agreed (M = 4.1, SD = 0.85), that the driving simulator provided a real driving experience.
Finally, participants were invited to leave comments regarding their experience with the different auditory feedback sets they used during the study. Some interesting and mixed responses were received from the participants. Some reported their preference towards the Spatial Earcons, such as:
“The reason I preferred the spatial earcons is that the sound being unfamiliar and digitised made it feel more engaging.”
“The spatial earcons were well represented and tangible to mechanical sounds - drivers would understand.” “Useful indicator sounds. It was useful hearing the sound coming from the direction in which you pressed
the indicator or where it was intending to travel.”
These statements support some of our quantitative results, by suggesting that the spatial component of Spatial Earcons provided useful directional information updates to the drivers when undertaking manual and automated driving scenarios. This additional information was not present when hearing Existing Vehicle Sounds and therefore may have aided with enhancing the drivers’ awareness to the intended actions of the vehicle. The fact that some participants felt the Spatial Earcons were engaging and tangible to mechanical sounds may have helped to ensure they were equally satisfying to Existing Vehicle Sounds as well as not being significantly more distracting. However, some participants were more confident in using the Existing Vehicle Sounds, and did not enjoy the use of Spatial Earcons:
“Feel a bit more comfortable, or familiar with the 'classic' car audio (mechanical).” “Found the synthesised sounds to be interesting but wouldn't want them in my own car.”
Responses suggested that participants mostly preferred to use the Spatial Earcons and found them to be engaging to use, but some participants had reservations about using them in their own vehicle. Some participants also requested auditory feedback for additional information that was not included during the study. These responses were useful as they highlighted other possible uses for Spatial Earcons.
6 DISCUSSION
The first research question this paper aimed to answer was: “How should auditory feedback for primary driving task information be presented in automated vehicles?” Our preliminary field study highlighted that Pitch and Timbre were key sonic parameters that captured participant attention whilst hearing primary driving sounds in manually operated vehicles. Results from the preliminary field study also suggested that participants welcomed the relocation of Existing Vehicle Sounds around the cabin of the vehicle. From these findings, we developed a set of Spatial Earcons that were modulated by Pitch and Timbre and were spatialised around the driver within the vehicle cabin. Our driving simulator study showed that the Spatial Earcons produced lower overall mean driver workloads than Existing Vehicle Sounds but workload was not significantly lower. Spatial Earcons also produced levels of usability that were not significantly lower than Existing Vehicle Sounds. Furthermore, they achieved usability scores above 70, which is considered as a ‘good’ level of usability, according to Bangor et al. [6]. Both Existing Vehicle Sounds and Spatial Earcons were effective when used to enhance driver awareness to the intended actions of the automated vehicle. Furthermore, Spatial Earcons were not significantly more distracting than Existing Vehicle Sounds and were found to be as satisfying asthem. These findings highlight that Existing Vehicle Sounds are not integral to effectively communicate primary driving information to drivers in automated vehicles. Instead, it has shown that artificial, synthesised sounds, such as our Spatial Earcons, can also effectively communicate this information. Norman has maintained that the problem with automation is the lack of continual, appropriate feedback that is received during manual operation [44]. Our findings highlight that, in the context of automated driving, pre-existing vehicle auditory feedback (Existing Vehicle Sounds) could be replaced with synthesised auditory feedback (Spatial Earcons) without negatively impacting driver workload, whilst still offering acceptable levels of usability.
Furthermore, Spatial Earcons employed the use of three-dimensional spatialisation. This offered an additional layer of information to the driver that was used to enhance driver awareness to the actions of the vehicle. Miller et al., proposed that an automated vehicle must communicate its intended actions to the driver in an appropriate manner [39]. The results of this work suggest that the spatial aspect of our Spatial Earcons was an appropriate method to present primary driving information within an automated vehicle to support the driver. Previous research has also mentioned that existing in-vehicle technologies have not implemented sound to its full potential [41]. For manual driving, Trentacoste, has stated that the driver should not engage in spatial perception as it may distract them from the driving task [60]. However, distraction to the driving task is of far less concern during automated driving. Therefore, based on our findings, we suggest that due to the reduced risk of driver distraction, and the opportunities spatialisation offers as an additional dimension from which to present information, automated vehicles can employ auditory feedback in a spatialised manner because it enhances driver awareness to the actions of the vehicle.
combustion engine (ICE) [65]. Subjective responses also highlighted that participants had some reservations about using Spatial Earcons over Existing Vehicle Sounds in their own vehicle, with one user mentioning they felt more comfortable with mechanical sounds. To supplement this work, and form a more definitive answer to our second research question, a longer study should be conducted to assess whether extended use of Spatial Earcons could lead to improved acceptance of this form of auditory feedback.
The final question to be addressed by this research was: “Can Spatial Earcons provide a feeling of control to drivers of automated vehicles?” Both auditory display types were comparable when used to provide a feeling of control during manual and automated driving. As expected, manual driving was significantly more effective at providing a sense of control than automated driving. This result is not surprising as Eckoldt et al. previously showed that drivers lose a feeling of control even when singular driving tasks are automated [26]. Our findings do not demonstrate that the use of Spatial Earcons produced a significantly greater feeling of control than Existing Vehicle Sounds during automated driving. However, they did provide an awareness to the vehicle’s actions during automated driving similar to Existing Vehicle Sounds, but were less effective at providing an awareness to the drivers’ own actions whilst driving. This finding may have occurred as a result of Existing Vehicle Sounds being more familiar than Spatial Earcons to present primary driving information. Earcons have been shown to require a sufficient learning period in order for the listener to correctly associate the sound with the corresponding action [58]. Therefore, drivers may have required further experience with Spatial Earcons to associate the connection to their own actions during the driving task.
7 POTENTIAL LIMITATIONS
The preliminary observational field study was conducted with eight participants. Therefore, no empirical quantitative analysis of the results could be conducted. However, the range of descriptive statistics obtained from the preliminary field study provided many promising results. In particular, the study suggested that participants placed different levels of importance on driving sounds depending on what driving task category with which they were associated. These findings present an interesting area for further research as a larger repeated study would gather a set of inferential statistics. This may provide more concrete evidence regarding the cognitive processes involved in a driver’s decision to respond to driving sounds. In addition, the field study highlighted that the sonic parameters that caught participants’ attention were different between primary, secondary and tertiary task sounds. It was not clear why this was the case but could have been confirmed by a larger study. The preliminary field study also highlighted that participants welcomed primary driving task sounds to be located in positions alternative to their traditionally mechanically bound locations. Based on the initial findings, there were no suggestions why participants welcomed the relocation of primary driving task sounds, but not secondary and tertiary task sounds. Conducting the study with more participants may have helped to identify the reason why participants were less likely to want secondary and tertiary task sounds relocated in a vehicle. A larger study would also have helped to provide improved sound clustering for the distinct driving task categories, as presented in Fig. 2.
This novel approach may be useful to other researchers who wish to take advantage of the flexibility of desktop-based driving simulators, while improving on their restricted sense of realism by moving towards a more realistic driving environment.
8 IMPLICATIONS AND FUTURE WORK
The objective of this work was to explore the role of auditory feedback in automated vehicles to assess whether it can re-establish a connection between the driver and the vehicle, and offer a feeling of control. Our experiment highlights that drivers do not necessarily require the continued inclusion of Existing Vehicle Sounds in order to be made aware of the intended actions of an automated vehicle. Instead, we have shown that synthesised artificial driving sounds can be created that replicate the sonic qualities of Existing Vehicle Sounds with no impact to driver workload or usability. Furthermore, these sounds can be presented using three-dimensional spatialisation to provide additional information to the driver and enhance their awareness to an automated vehicle’s actions. While this paper explores the auditory modality, research could be conducted to address how different modalities, such as tactile or visual feedback, can help to re-establish the connection between driver and vehicle in automated vehicles.
A longitudinal study would benefit this work to explore drivers’ behavioural changes over time whilst engaged in an automated journey using Spatial Earcons. Additionally, a real-world automated driving study should be conducted to further assess their usefulness when real driving events are encountered. Further investigations should also be carried out to evaluate the use of Spatial Earcons within automated vehicles that feature Level 2 and Level 3 automation [43]. This would ultimately provide a more complete picture of the usefulness of Spatial Earcons for all levels of automation in vehicles. Moreover, the application of Spatial Earcons may be useful for the investigation of ‘handover of control’ situations in automated vehicles between higher to lower automation levels. An example of their use may be that during manual driving, drivers could be presented with Existing Vehicle Sounds, whilst during automated driving, Spatial Earcons could be presented. This would provide clear differentiation between driving modes due to the sounds presented, and may provide an effective solution to the issue of ‘handover of control’.
Future work could investigate three-dimensional auditory spatialisation for other application areas within the vehicle. Three-dimensional auditory spatialisation has been investigated across various domains, such as for navigational cues via mobile devices [57] and augmented reality gaming [48]. Because drivers are no longer burdened with the manual task of driving in automated vehicles, they are free to carry out non-driving tasks. Therefore, it would be useful to explore what additional types of auditory feedback drivers would wish to receive whilst driving in an automated vehicle, e.g. navigational and road traffic updates, or additional location-based environmental information. Furthermore, the exploration of non-driving based interactions in automated vehicles that incorporate spatialised auditory feedback would benefit the ubiquitous and pervasive computing community and further enhance human factors research for automated vehicles.
This work has broader implications for the ubiquitous computing community outside of the automated vehicle domain. Our efforts have focused on the presentation of primary driving information using Spatial Earcons to replace Existing Vehicle Sounds and re-establish a connection between the driver and the vehicle. However, Spatial Earcons could be also used as part of auditory feedback for telepresence technologies for example. One area in particular is telerobotics, where Spatial Earcons could enhance awareness between an operator and a remotely controlled device. They may also be useful in virtual-reality training for health-care professionals. In this context, Spatial Earcons could be used to provide auditory cues during the acquisition of new technical skills.