City, University of London Institutional Repository
Citation
: Endress, A., Korjoukov, I. & Bonatti, L. L. (2017). Category-based grouping in
working memory and multiple object tracking. Visual Cognition, 25(9-10), pp. 868-887. doi: 10.1080/13506285.2017.1349229This is the accepted version of the paper.
This version of the publication may differ from the final published
version.
Permanent repository link:
http://openaccess.city.ac.uk/17576/Link to published version
: http://dx.doi.org/10.1080/13506285.2017.1349229
Copyright and reuse:
City Research Online aims to make research
outputs of City, University of London available to a wider audience.
Copyright and Moral Rights remain with the author(s) and/or copyright
holders. URLs from City Research Online may be freely distributed and
linked to.
Category-based grouping in working memory and multiple object tracking
Ansgar D. Endress
Department of Psychology, City University, London, UK
Ilia Korjoukov Okozlab Ltd, London, UK
Luca L. Bonatti
Universitat Pompeu Fabra, Barcelona, Spain, ICREA, Pg. Llu´ıs Companys 23, 08010 Barcelona, Spain
Ansgar D. Endress
Department of Psychology, City University London Northampton Square, London EC1V 0HB, UK E-mail: [email protected]
Author Note
This research was supported by grant PSI2012-32533 from Spanish Ministerio de Econom´ıa y Competitividad and Marie Curie Incoming Fellowship
303163-COMINTENT (both to ADE) and Ministerio de Econom´ıa y Competitividad Grant PSI2009-08232PSIC to LLB., as well as grant
Abstract
Two prominent cognitive capacity limitations are the maximal number of objects we can place in working memory (WM) and the maximal number of objects we can track in a display. Both are believed to have a numeric value of 3 or 4, which has led to the proposal that we have a general cognitive capacity, and that this capacity is most likely linked to limitations of how many objects we can attend simultaneously. Based on previous results showing that we can memorize more objects if they come from different categories than if they come from the same category(e.g., Feigenson & Halberda, 2008; Wood, 2008; Wong, Peterson, & Thompson, 2008), we compare how category-based grouping affects performance for WM and multiple object tracking (MOT). We present participants with either “pure” displays of either cars or faces, or with “mixed” displays of cars and faces. Overall, the effects of category are weak. In some analyses but not others, we replicate the mixed advantage for WM, albeit with a small effect size. In contrast, we observe a weak pure advantage for MOT tasks, at least in a meta-analysis of five experiments, but not in all experiments. Accordingly, WM and MOT tasks differed significantly in their sensitivity to category membership. We also find that WM is slightly better for faces than for cars, but that no such difference exists for MOT. We tentatively suggest that cognitive capacity limitations in different domains are at least partially due to limitations of distinct mechanisms.
Category-based grouping in working memory and multiple object tracking Introduction
In one of his classic papers, Miller (1956) noted that people seem to have similar cognitive capacities across a variety of domains, which he called the magical number 7, plus or minus 2. This suggested that we might have a common cognitive capacity that is used by many cognitive processes. While Miller (1956) used the magical number more as a rhetorical device than an accurate estimate (Cowan, 2001), and while the magical number might be closer to 4 than to 7 (Cowan, 2001), relatively little research has directly addressed the relation between capacity limitations in different domains (Cowan, 2015).
Two of the most prominent cognitive capacity limitations are the maximal number of items we can place in working memory (WM), and the maximal number of items we can attend to. Specifically, in those theories of Working Memory (WM) that posit discrete memory capacities (e.g., Awh, Barton, & Vogel, 2007; Luck & Vogel, 1997; Miller, 1956; Cowan, 2005; Rouder et al., 2008; W. Zhang & Luck, 2008; but see Alvarez & Cavanagh, 2004; Bays & Husain, 2008; Bays, Catalao, & Husain, 2009; van den Berg, Shin, Chou, George, & Ma, 2012 for authors holding WM to be a continuous resource), WM is often considered to have a constant capacity of 3 or 4 items.
Likewise, the number of items we can attend to is usually measured in multiple object tracking (MOT) experiments. In such experiments, participants have to follow target objects among identical distractors while the objects move randomly on the screen. The classic result holds that we can track about 3 or 4 of such items (Pylyshyn & Storm, 1988; Scholl & Pylyshyn, 1999).
enumeration error is constant and close to zero up to 3 or 4 objects, and then grows proportionally to the number of items to be enumerated, yielding a Fechner-Weber pattern (Izard & Dehaene, 2008; Revkin, Piazza, Izard, Cohen, & Dehaene, 2008).
The observation that all of these cognitive capacities are limited to 3 or 4 has led to the proposal that they might rely on a common mechanism, and that this mechanism might be attention. Specifically, our ability to enumerate 3 or 4 items exactly and immediately might rely on the same mechanisms that allow us to track 3 or 4 items attentionally (e.g., Chesney & Haladjian, 2011; Feigenson, Carey, & Hauser, 2002; Knops, Piazza, Sengupta, Eger, & Melcher, 2014; Piazza, Fumarola, Chinello, &
Melcher, 2011; Trick & Pylyshyn, 1994), be it through a system of attentional pointers or through an object-file system.1
Likewise, according one of the most prominent models of WM (Cowan, 2005), WM capacity limitations are really limitations of attention. Specifically, in his and other models (e.g., Baddeley & Hitch, 1974; Engle, 2002; Oberauer, 2002), we need to attend to items in memory to prevent them from disappearing from memory through forgetting and interference. As we can attend only to 3 or 4 items, we have a WM capacity of 3 or 4 items. Hence, WM, subitizing, and attention are thought to have a common capacity, and this capacity is due to attention.
In the current experiments, we address the relationship between WM and
attentional tracking by comparing their functional properties. Specifically, we ask
whether these cognitive capacities differ in their sensitivity to the category structure of
the items they have to remember and track, respectively.
Evidence for a general cognitive capacity
While there are few direct tests of the view that a general cognitive capacity underlies capacity limitations in different domains, it receives support from a number of results. For example, Piazza et al. (2011) observed that visual WM capacity correlated
1Trick and Pylyshyn (1994) argued against a common mechanism between WM and subitizing, and
with subitizing capacity, and explained this finding with the hypothesis that both mechanisms relied on the parallel individuation system (though the relationship between WM and subitizing does not seem to hold up when WM is measured with complex span tasks; Tuholski, Engle, & Baylis, 2001). In line with this view, Chesney and Haladjian (2011) found that the more items participants had to track in a MOT task, the more errors they made in a simultaneous subitizing task (that is, tracking more items increased their coefficient of variation, and thus reduced their subitizing capacity). Further, a verbal WM task reduced the subitizing capacity to a lesser extent than MOT, at least when participants had to remember 3 letters, suggesting that the subitizing capacity might be specifically impaired by a visual task.
However, in Chesney and Haladjian’s (2011) experiments, the subitizing display was presented for just 50 ms. As a result, it was presumably quite easy to miss while performing a demanding visual task such as MOT. Further, subitizing requires attentional resources (Burr, Turi, & Anobile, 2010). Consequently, to enumerate the items in the subitizing display, participants needed to disengage from the MOT stimuli and to select the enumeration stimuli. Both aspects of the task might plausibly increase subitizing errors even if subitizing and MOT did not rely on the same processes. In line with this view, the verbal WM task also reduced subitizing capacities, albeit only when participants had to remember 5 letters.
The relationship between tracking and WM is similarly unclear. Different authors
have used an individual difference approach to investigate the interrelations among
different types of attentional processing. For example, both Oksama and Hy¨on¨a (2004)
and Huang, Mo, and Li (2012) found that MOT performance correlated with measures
of visual WM, confirming that attentional tracking and WM might be related.
However, Oksama and Hy¨on¨a (2004) also showed that MOT correlates not only
with visual WM but also with verbal WM when people have to track the identity of
items on top of their positions. Similarly, Huang et al. (2012) found a correlation
between MOT and counting speed outside of the subitizing range, as well as with other
reaction time to report the color of an item). As a result, it is unclear what these
correlations mean in terms of the underlying psychological mechanisms. In fact, Huang
et al. (2012) used no less than 18 different tasks, and showed that performance on most
of them correlated with a general “attention” factor that might well reflect how vigilant
or compliant participants are during the experiment.
Doubts about a general cognitive capacity
While the results discussed so far do not provide unambiguous evidence for a
general cognitive capacity, there are also other observations that are problematic for the
view that cognitive capacity limitations are due to the limitations of a parallel attention
system. First, dual-task experiments revealed only limited interference between
attentional tasks and WM tasks (e.g., Fougnie & Marois, 2006; Hollingworth & Hwang, 2013; H. Zhang, Xuan, Fu, & Pylyshyn, 2010), a result that would be unexpected if WM and attention relied on the same mechanism. That said, there clearly are interactions between MOT and WM. For example, WM might help binding features (e.g., colors) to objects that are tracked (Makovski & Jiang, 2009b). However, our tracking abilities and our WM abilities still seem to interfere remarkably little with each other.
Second, neither attention nor WM might necessarily have a capacity of 3 or 4. When objects move slowly, we can track up to 8 of them, and when they move very fast, only a single one (Alvarez & Franconeri, 2007; Franconeri, Jonathan, & Scimeca, 2010; Holcombe & Chen, 2012). Likewise, the capacity of WM might not be fixed either, but rather depend on other factors such as the complexity of the stimuli (e.g., Alvarez & Cavanagh, 2004; Eng, Chen, & Jiang, 2005), their familiarity (e.g., Feigenson, 2008; Jackson & Raymond, 2008) their confusability (e.g., Baddeley, 1966; Conrad, 1963; Conrad & Hull, 1964; Viswanathan, Perl, Visscher, Kahana, & Sekuler, 2010), the degree to which they can be perceived categorically (Olsson & Poom, 2005), the presence of proactive interference among items (Banta Lavenex, Boujon,
words (under high proactive interference), while Wood (2008) observed memory capacities of only 2 actions.
Third, in a general sense, memory and some forms of attention (though not
necessarily the tracking variety) are certainly related. For example, attention is critical
to place items in memory to begin with (see, among many others, e.g., Chen & Cowan,
2009; Craik & Lockhart, 1972; Lepsien & Nobre, 2007; Majerus et al., 2014; Morey &
Bieler, 2013; Vergauwe, Camos, & Barrouillet, 2014). Further, recent physiological data
suggest that, at least in some situations, WM limitations might be in part encoding
limitations (e.g., Buschman, Siegel, Roy, & Miller, 2011; Tsubomi, Fukuda, Watanabe,
& Vogel, 2013). Conversely, WM might also support attention. For example, and as
mentioned above, WM might help binding features to objects that are tracked (e.g.,
Makovski & Jiang, 2009b). Further, items that are maintained in WM attract attention
in unrelated search tasks, suggesting that WM might even guide attention (e.g.,
Downing, 2000; see also Awh & Jonides, 2001 for a review).
However, the mechanistic basis for this two-way interaction between WM and
attention is unclear. Directing attention away from a stimulus certainly impairs
performance on tasks using this stimulus (see Awh & Jonides, 2001 for a review of the
WM literature, but also Toro, Sinnett, & Soto-Faraco, 2005; Turk-Browne, Jung´e, &
Scholl, 2005, for similar results in rather different domains such as statistical learning).
However, such results only show that items need suitable encoding conditions for
appropriate processing, but it is unclear to what extent attentional tracking capacities
are required. Likewise, while WM can certainly guide attention, so can LTM, even when
participants never had any reason to memorize the stimulus features that guide
attention (Fan & Turk-Browne, 2016).2 Given that items in LTM are clearly not
2In Fan and Turk-Browne’s (2016) experiments, participants first encoded either the position or the
actively maintained by attentional mechanisms, this suggests that attentional guidance
from memory representations does not rely on attentional processing in memory.
The current experiments
The results reviewed so far are certainly problematic for the general capacity view. However, they do not rule it out. That is, the numeric value of the capacities might not be fixed, but the nature of these limitations might still be the same.
Here, we ask whether attention and WM rely on a common mechanism by comparing their functional properties. Specifically, participants had to track or
remember items in a display. The items were either all from the same category (faces or
cars; hereafter “pure” displays), or mixed both categories (faces and cars; hereafter “mixed” displays). We asked whether attention and memory would show a benefit or a
cost for mixed compared to pure displays. (In the experiments below, items in “mixed” displays differ both in their category membership and their composition of visual
features; when we refer to mixed or pure displays below, we always refer to this
experiment situation.)
We selected faces and cars as contrasting categories, because evidence suggests that objects and humans are processed differentially early in development (e.g., Bonatti, Frot, Zangl, & Mehler, 2002) and have a different brain representation in adulthood (e.g., Gauthier, Tarr, Anderson, Skudlarski, & Gore, 1999; Kanwisher, McDermott, & Chun, 1997), suggesting that participants likely see them as members of distinct categories.
would expect mixed displays to be easier to remember than pure displays.
With respect to MOT, previous research is ambiguous as to whether pure sets should be harder or easier to track than mixed sets. On the one hand, when targets in MOT experiments can be grouped based on different features, tracking performance is somewhat improved (e.g., Erlikhman, Keane, Mettler, Horowitz, & Kellman, 2013; St¨ormer, Li, Heekeren, & Lindenberger, 2011; see Keane, Mettler, Tsoi, & Kellman, 2011, for non-feature-based grouping results). However, MOT performance is also impaired when targets are grouped with distractors (e.g., Erlikhman et al., 2013; Keane et al., 2011; Scholl, Pylyshyn, & Feldman, 2001; St¨ormer et al., 2011). Crucially,when each target has a “paired” distractor it shares a feature with (while the features are
different across target-distractor pairs), performance is worse than when all items share this feature. For example, Makovski and Jiang (2009a) used colored digits as stimuli. In the “paired digit” condition, the digits 1, 2, 4 and 7 would appear both as targets and as distractors, such that each digit would appear exactly twice in a display. Results showed that performance in this condition was worse compared to a condition where all eight digits were identical (e.g., all consisted of the digit 1). However, while Makovski and Jiang (2009a) found a similar disadvantage when targets and distractors were paired in both digit identity and digit color, color-based pairing was insufficient to yield such an disadvantage (see also Horowitz et al., 2007, who did not find a significant disadvantage in the paired condition, using cartoon animals as stimuli).3 Given these results, we
would expect better MOT performance for pure displays compared to mixed displays (or equivalent performance in both kinds of displays). Crucially, we will ask whether the effect of display composition is different between WM and MOT tasks.
In sum, we would expect a memory advantage for mixed displays, and a tracking advantage for pure displays. This expectation also appears to make intuitive sense. While memory performance can be improved by grouping items (e.g., through
3In principle, it is possible that the very presence of distinct objects has a tracking cost compared to
chunking), object tracking requires keeping targets separate from distractors.
However, there is an important limitation of this design. Even if MOT and WM have different properties with respect to category-based grouping, it would only show that somemechanisms involved in these tasks are separable, but not that there are no shared mechanisms that are involved in both tasks. Here, we thus address only the most extreme version of a shared capacity view, namely that the mechanisms involved in WM and object-tracking are identical. Given the current state of the art, we believe that the assessment of the status of the simplest hypothesis is a first step towards a fuller
understanding of the relationship between different cognitive capacities.
To foreshadow our results, we found that memory is slightly better in mixed displays, whereas tracking works slightly better with pure displays. WM and MOT might thus rely on distinct capacities. However, these effects were weak and not
consistent across experiments. While this limits the generality of our results, we believe that the current data are problematic for the stronger version of the shared capacity view. For readability, we first present meta-analyses of our experiments (as well as analyses treating the different experiments as one big experiment), and then report analyses of individual experiments.
Materials and methods
Apparatus
Stimuli were presented on a Philips 109B 1900 CRT monitor at a resolution of 1024
× 768 pixels and a refresh rate of 60 Hz. The experiment was administered in a soundproofed booth and was run using EventIDE (http://www.okazolab.com).
Materials
In the MOT experiments, stimuli were a frontal view of the face of Lionel Messi and a frontal view of a compact car (Seat Cordoba). We selected these stimuli because they represent one of the best-known soccer player and best selling cars in Spain. Each image spanned 53 × 53 pixels (approximately 3.8 × 3.8o at a typical view distance for
players and frontal views of various cars. Each image measured 75 ×75 pixels
(approximately 5.4× 5.4o at a typical view distance for 60 cm). We used a total of 12
images for each category.
Procedure
Multiple Object Tracking. Participants were informed that they would see 12 moving objects in each trial. They were told that, at the beginning of each trial, some of them would blink, and that their task was to follow them. Each trial started with a fixation cross (30 × 30 pixels; 2.2 ×2.2o) for 1000 ms. Then all objects would appear. After a delay of 300 ms, the target objects would blink for 4.8 s at a frequency of 5 Hz. The objects started moving 300 ms after they had stopped blinking, for a tracking period of 10 s.
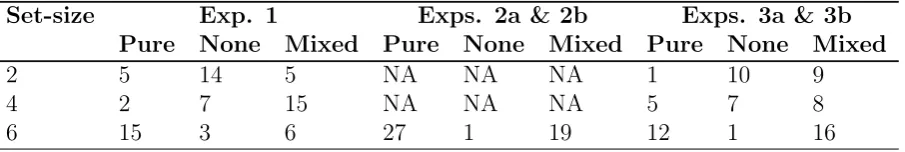
The stimuli were either 12 faces, 12 cars (pure conditions), or 6 cars and 6 faces (mixed condition). Each condition was equally represented among the trials (except in Experiment 3a, where mixed trials were twice as frequent as either pure condition). The number of targets (among 12 objects in total) are given in Table 1. In the mixed
condition, half of the targets (and half of the distractors) came from either category. The initial positions of the objects defined by random polar coordinates relatively the screen center. The polar angle (θ) was randomly chosen between 0 and 360 degrees, whereas the polar eccentricity (R) was random chosen between 0 and 9.5 dva (266 pixels).
To avoid overlap between the objects, we constructed imaginary circles inscribing the objects, and discarded the stimulus positions when the circles corresponding to two objects overlapped. As a result, distances between stimulus centers were greater than 106 pixels.
the y direction, (ii) by a repulsive component in the x direction that increased
exponentially (σ = .018) as the object approached the left or the right screen boundary, (iii) by a repulsive component in the y direction that increased exponentially (σ = .018) as the object approached the top or the bottom screen boundary, and (iv) by repulsive components away from each of the other objects whose magnitude was a negative exponential function (σ = .2) of the objects’ mutual distance. The repulsive components prevented the objects from colliding with each other and the screen
boundaries. Details for this algorithm are given in Appendix A. Further, with a change probability of 0.1, a new speed was selected randomly between the maximum and the minimum velocity; these differed across the experiments, and are given in Table 1.
After the motion stopped, tracking performance was evaluated in one of two ways. In the “yes/no” method (after Pylyshyn & Storm, 1988), one object was highlighted by a green mask immediately after the objects stopped moving. Participants had to indicate whether the highlighted object was among those they had tracked. If it was, they had to press the up-arrow key, otherwise the down-arrow key. After their response, participants received feedback for 2000 ms: For correct answers, they were shown a green plus sign, and for incorrect answers a red minus sign.
In the “click-all” method, all objects turned into white circles after their
movements stopped. As there were 6 targets among 6 distractors, participants had to select 6 by clicking on them. Circles turned orange after being clicked on, and
participants could unselect them. Once they had clicked on 6 circles, participants were given feedback for 2000 ms: Their correct choices turned green, and the incorrect ones red. They were also given the percentage of correct choices.
Further characteristics of the different MOT experiments are given in Table 1.
5.5 × 5.5o) of 1000 ms, the sample array for durations between 2000 ms and 4000 ms
(see Table 2 for the specific durations), a retention delay of 900 ms, and finally the test array. The presentation duration of the test array was always identical to that of the sample array. Participants had to indicate with the arrow keys whether one of the objects had changed between the sample and the test array (up: change; down: no change). Following this, they were given feedback for 2000 ms.
The arrays contained an even number of objects between 2 and 10 (see Table 2), either all faces, all cars (pure conditions), or half faces and half cars (mixed condition). All three conditions were equally frequent.
The initial positioning of the objects was identical to that in the multiple object experiments.
Familiarity judgment. In Experiments 1, 2b and 3b, we assessed the
participants’ familiarity with the stimuli. They were asked to rate, on a scale from 1 to 5, whether they would recognize the face and the car if they saw it in the street.
Sample size and participants
In the experiments below, we aimed for 24 participants per experiment. However, we also report some pilot experiments for which the whole sample has not been
acquired. Further, in the analyses below, we excluded participants who scored at less than 50% correct for set-size 6. We considered that participants performing at less than 50% clearly did not pay attention to the task. For example, in the click-all method, even tracking a single item would yield a percentage of correct responses of about 55%, and, if participants can track about 3 items, their percentage of correct responses should be about 67% (Hulleman, 2005). The reason for excluding participants based on set-size 6 is because this set-size was present in all experiments. The number of excluded
participants is given in Tables 1 and 2.
part in the WM experiments. They were recruited from the Universitat Pompeu Fabra community, and tested in sessions of 1.5 h that comprised other unrelated experiments (generally on statistical learning) in addition to the current experiments.
Meta-analyses
For readability, we first present the results of our meta-anlyses, before presenting the individual experiments in more detail. In the meta-analyses, we focus on set-size 6, because the effects were most consistent at this set-size. On the one hand, it seems plausible that the effects might be maximal at an intermediate set-size, as it avoids both ceiling and floor effects. On the other hand, choosing a set-size based on the data inflates the type I error rate. Given the weakness of the results presented below, this is a serious caveat.
To compare the results across the MOT experiments and the WM experiments, we use difference scores, where a difference score between two conditions C1 and C2 is
defined as the normalized difference (C2−C1)/(C2+C1).
In all (meta-) analyses, we discarded the first block as training.
Multiple object tracking
Pure vs. mixed displays. In our first meta-analysis, we averaged the score from the pure conditions (i.e., either all cars or all faces), and compared it to the mixed condition in a difference score. Positive difference scores indicate an advantage for pure displays over mixed displays.
A mixed-effect meta-analysis (Borenstein, Hedges, Higgins, & Rothstein, 2010) combined the results for set-size 6 for Experiments 1-3 (100 participants in total). As shown in Figure 1, we observed a weak pure advantage, dmeta-analysis = .023, SE = .0007,
CI.95= .0008, .037, Z = 3.04,p = .002. We also entered all difference scores into at
test against 0, and observed a weak advantage for the pure conditions (d = .026, SD = .086), t(99) = 3.0, p = .0034, Cohen’sd = .3, CI.95 = .0087, .0429.4 The likelihood
ratio against the null hypothesis was 8.96 after correction with the Bayesian
Information Criterion, and 31.63 after correction with the Akaike Information Criterion (AIC). Fifty-four participants showed a pure advantage, 41 a mixed advantage, and 5 had a difference score of exactly 0. There were no consistent results for other set-sizes.5
Faces vs. cars. We also asked whether, for set-size 6, there was a processing advantage for faces over cars. In the analyses below, positive difference scores indicate a face advantage.
As shown in Figure 2, a meta-analysis (100 participants in total) did not detect a deviation from chance, dmeta-analysis = .002,SE = .003,CI.95 = -.005, .009, Z = .62,
p = .534, nor did a combined t-test, (d = .004, SD = .078), t(99) = .48,p = .635, Cohen’sd = .048,CI.95 = -.012, .019.6 The likelihood ratio in favor of the null
hypothesis was 8.93 after BIC correction, and 2.53 after AIC correction. There were 43 participants with a face advantage, 43 participants with a car advantage, and 14
participants with a difference score of exactly 0.
Working memory experiments
Pure vs. mixed displays. As shown in Figure 3, a mixed meta-analysis for set-size 6 (97 participants) revealed a significant mixed advantage, dmetanalysis = -.021, SE = .009,CI.95 = -.039, -.003,Z = 2.26,p = .024, as did a combined t-test of all
experiments (d = -.021, SD = .094), t(96) = 2.17, p = .032, Cohen’sd = .22, CI.95 =
-.04, -.002.7 The likelihood ratio in favor of the alternative hypothesis was 1.07 after
5Given that, in some experiments, we observed weak mixed advantages for set-sizes 2 and 4, we also
performed a meta-analysis for these set-sizes in the experiments where these set sizes were administered (i.e., Experiments 1 and 3b, 44 participants in total). For set-size 2, the meta-analysis did not detect a deviation from chance,dmeta-analysis = -.009SE =.0097,CI.95 = -.0285, .0096,Z = -.968,p = .333.
Entering the combined difference scores into a t-test did not detect a deviation from chance either (d= -.000,SD= .035),t(43) = 1.64,p= .107, Cohen’sd= .25,CI.95= -.019, .002; a signed rank test was not
significant either,V = 75,p= .268. Correcting with the Bayesian Information Criterion, the likelihood ratio in favor of the null hypothesis was 1.72. However, after correction with the Akaike information criterion, we observed a likelihood ratio of 1.29 in favor of the alternative hypothesis (.78 in favor of the null hypothesis). We thus tentatively conclude that the significant mixed advantages we observed for set-size 2 were type I errors.
For set-size 4, the mixed-factor meta-analysis did not detect a deviation from chance,dmeta-analysis= -.012,SE= .009,CI.95= -.030, .007,Z = -1.25,p=.211. However, a combined t-test reached significance,
(d= -.012,SD = .040),t(43) = 2.05,p = .0465, Cohen’sd = .31,CI.95= -.025, -.0002); a signed rank
test was significant as well, V = 121, p = .0219. Further, likelihood analysis favored the alternative hypothesis (Λ= 1.23 after BIC correction andΛ= 2.72 after AIC correction). It thus is unclear whether there is a mixed advantage at set-size 4.
BIC correction, and 3.72 after AIC correction. 57 participants had a mixed advantage, 30 a pure advantage, and 10 had a difference score of exactly 0.
Cars vs. faces. Curby and Gauthier (2007) showed that, at least for long encoding durations, faces are better remembered than other objects (but see Wong et al., 2008). We thus compare whether our results reveal a similar effect, by conducting a meta-analysis of the difference score between face only trials and car only trials.
As shown in Figure 4, a meta-analysis for set-size 6 (97 participants) revealed a significant face advantage, d = .023,SE = .005,CI.95 = .012, .033, Z = 4.21,p =
.00003, though a combined t-test was only marginal (d = .024,SD = .121), t(96) = 1.93, p = .057, Cohen’sd = .2, CI.95 = -.0007, .048.8 The likelihood ratio is 1.54 in
favor of the null hypothesis after BIC correction, but in favor of the alternative
hypothesis after AIC correction (Λ = 2.25). 43 participants had a face advantage, 31 a car advantage and 23 a difference score of exactly 0.
Discussion
In the current experiments, we asked to what extent visual attention and visual WM share common properties. Based on earlier results suggesting that it might be easier to memorize mixed sets (Feigenson & Halberda, 2008; Wood, 2008; Wong et al., 2008) but that it might be harder to track mixed sets (at least when the sets are defined by simple features; Erlikhman et al., 2013), we sought to directly contrast parallel attention and WM in their respective sensitivity to category information, using identical stimuli.
Meta-analyses of our experiments revealed a small pure advantage for MOT experiments, and a small mixed advantage for WM experiments, at least for set-size 6. As shown in Figure 5, the difference scores were significantly larger for MOT
experiments than for WM experiments, t(195) = 3.62, p = .0004, Cohen’s d = .516. This difference was confirmed by a signed rank test, p = .0002, as well as by comparing the counts of participants having pure, mixed and no advantages, using Fisher’s test,
p = .0035. Further, a mixed model analysis on the difference scores with set-size and
task (MOT vs. WM) as fixed factors, their interactions as well as participants and choice type (click-all vs. up/down) as random factors revealed that the difference score was higher for set-size 6 (with a reference level of 2), β = .041, SE = .018,p = .031, but that, for set-size 6, the difference score was reduced in the WM experiments β = -.053,
SE = .026,p = .038.
In line with previous results, we thus tentatively conclude that visual attention and visual WM have different properties and hence are likely not to share all of their underlying mechanisms.9
However, while the MOT experiments differed from the WM experiments in the effects of the category structure of the stimuliwith a medium effect size (Cohen’s d = .516), the effects in the individual tasks were fairly weak, and, as we will now show, not observed in all experiments.
Results of individual experiments
The meta-analyses above revealed a small advantage for pure displays in MOT experiments, and a small advantage for mixed displays in WM experiments. While the effect sizes were rather small in both cases, we note that these results are in line with previous results in both MOT (Erlikhman et al., 2013; Horowitz et al., 2007; Makovski & Jiang, 2009a) and WM (e.g., Feigenson & Halberda, 2008; Wood, 2008; Wong et al., 2008). However, these effects did not emerge in all experiments. We thus report the individual experiments below, noting in each case to what extent they were consistent with the meta-analysis above.
Multiple object tracking
Experiment 1. In Experiment 1, participants had to track 2, 4 or 6 objects among 12 items in total. At the end of the tracking phase, a single object was
highlighted, and participant had to indicate whether it was among the target objects.
9While performance did not differ between car and face trials in MOT experiments, we observed
Participants completed three blocks with 36 trials each.
We analyze the different set-sizes individually, both because not all experiments below comprise all set-sizes, and because Levene’s test indicated differences in the variance of the difference scores at different set sizes. While we report t-tests, the pattern of significance is unchanged with a signed rank test.
For set-size 2, the difference score (M = .0003, SD = .033) did not differ
significantly from zero, t(23) = .042, p = .967, Cohen’sd = .0085, CI.95 = -.014, .014.
For set-size 4, the difference score (M = -.021, SD = .039) revealed a mixed advantage,
t(23) = 2.65, p = .014, Cohen’sd = .54,CI.95 = -.037, -.0046. In contrast, with set-size
6, the difference score (M = .08, SD = .12) revealed a pure advantage, t(23) = 3.32,
p = .003, Cohen’s d = .68, CI.95 = .03, .13. The distribution of the number of
participants with mixed and pure advantages is shown in Table 3; performance in terms of the percentage of correct responses is shown in Figure 6.
Participants were highly familiar with the face (Lionel Messi; M = 4.75,SD = .85; on a scale of 1 to 5) and also reasonably familiar with the car (M = 3.54, SD = 1.59).
Experiments 2a and 2b. In Experiments 2a and 2b, participants had to track 6 items among 12 items in total. At the end of the tracking phase, the items changed to white circles, and participants had to click on all targets. There were 4 blocks with 30 trials each. The difference between Experiments 2a and 2b was that in Experiment 2b (but not in Experiment 2a), participants had to rate their familiarity with the objects. As for Experiment 1, we report t-tests, but the pattern of significance is unchanged with a signed rank test.
Given that the difference scores did not differ between Experiments 2a and 2b,
F(1,45) = .08, p = .779,η2
p= .002, we combined the experiments. The difference scores
(M = .012, SD = .031) indicated a small pure advantage, t(46) = 2.58,p = .013, Cohen’sd = .38, CI.95 = .003, .021. Counts of participants showed pure, mixed or no
advantages are shown in Table 3.
Experiments 3a and 3b. Experiment 3a was a replication of set-size 6 in Experiment 1, except that the frequency of mixed and pure trials was equated. There were 4 blocks of 32 trials. Experiment 3b was an exact replication of Experiment 1, except that it comprised four rather than three blocks. Again, we report t-tests, but the pattern of significance is unchanged with a signed rank test.
In Experiment 3a, the difference score (M = .009, SD = .05) failed to differ from chance, t(8) = .51, p = .621, Cohen’s d = .17,CI.95 = -.030, .047, potentially due to
the small sample size.
In Experiment 3b, we observed a small pure advantage for set-size 2 (M = -.019,
SD = .035), t(19) = -2.48, p = .0226, Cohen’s d = .55,CI.95 = -.035, -.003. For set-size
4, the difference scores did not differ from chance (M = -.002, SD = .041), t(19) = .25,
p = .804, Cohen’s d = .056, CI.95 = -.021, .017. For set-size 6, the difference score did
not differ from chance either (M = .003,SD = .12),t(19) = .1, p = .923, Cohen’s d = .022, CI.95 = -.05228, .057. The counts of participants showing pure and mixed
advantages in shown in Table 3.
In sum, in Experiments 3a and 3b we do not find the same effects as in Experiments 1 and 2.
Working memory
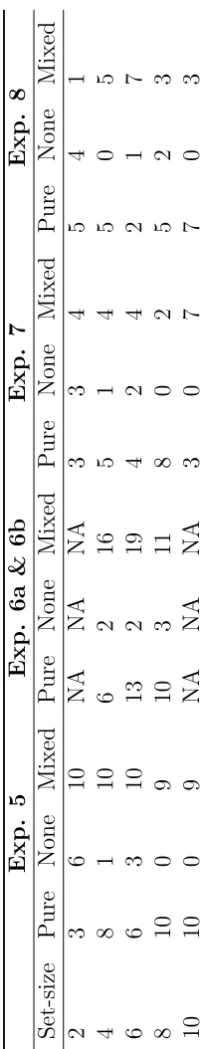
Experiment 4. In Experiment 4, participants had to detect changes in arrays of 2, 4, 6, 8 or 10 cars or faces. The presentation duration was 3 s for the sample array. There were 4 blocks of 60 trials each.
As in the MOT experiments above, we analyze the set-sizes individually. As above, a signed rank test yielded the same pattern of significance as a t-test.
The difference score did not differ from chance for any of the set-sizes: Set-size 2:
M = -.011, SD = .041, t(18) = 1.14,p = .27, Cohen’s d = .26, CI.95 = -.030, .009;
set-size 4: M = -.016, SD = .093, t(18) = .72, p = .478, Cohen’s d = .17, CI.95 = -.061,
.030; set-size 6: M = -.026, SD = .116,t(18) = .99, p = .333, Cohen’sd = .23,CI.95 =
CI.95 = -.063, .093; set-size 10: M = .017,SD = .152,t(18) = .5,p = .625, Cohen’s
d = .11,CI.95 = -.056, .091.
Counts of participants showing pure, mixed or no advantages are shown in Table 4; the performance in terms of the percentage of correct responses is shown in Figure 7.
Experiment 5. In Experiment 5, participants had to detect changes in arrays of 4, 6 or 8 cars or faces. The presentation duration was 3 s for the sample array. There were 6 blocks of 36 trials each.
For set-size 6, we observed a significant mixed advantage, where the difference score indicated better performance for pure displays (M = -.034, SD = .08),t(23) = 2.07, p = .0498, Cohen’sd = .42, CI.95 = -.067, -.00004. In contrast, the difference
score did not differ from chance for set-size 4 (M = -.012, SD = .054), t(23) = 1.09,
p = .289, Cohen’s d = .22, CI.95 = -.035, .011, nor for set-size 8 (M = -.017, SD =
.118), t(23) = .72, p = .481, Cohen’sd = .15, CI.95 = -.067, .033.
Experiment 6a and 6b. Experiment 6a was a replication of set-size 6 from Experiment 5, except that we used 6 blocks with 40 trials each. Experiment 6b was an exact replication of Experiment 5.
In Experiment 6a, the difference score failed to differ from zero (M = -.0105,
SD = .045), t(9) = .74, p = .477, Cohen’s d = .23, CI.95 = -.043, .022, perhaps due to
the small sample size.
In Experiment 6b, the difference score did not deviate from zero either for set-size 4 (M = -.023, SD = .079), t(23) = -1.39, p = .177, Cohen’s d = .28,CI.95 = -.056,
.011, or for set-size 6 (M = .0008, SD = .0896), t(23) = .04,p = .967, Cohen’s d = .009, CI.95 = -.037, .039, or for set-size 8 (M = -.005, SD = .094), t(23) = -.28,p =
.782, Cohen’s d = .06,CI.95 = -.045, .034.
Experiment 7. Experiment 7 was identical to Experiment 4, except that the sample array was presented for 2 s rather than 3 s.
The difference score did not deviate from chance for any set-size, set-size 2: (M = -.012, SD = .039), t(9) = -.99, p = .349, Cohen’s d = .31,CI.95 = -.040, .016; set-size 4:
set-size 6: (M = .017, SD = .093), t(9) = .59, p = .572, Cohen’sd = .19, CI.95 =
-.0495, .084; set-size 8: (M = .145,SD = .214), t(9) = 2.14, p = .061, Cohen’s d = .68,
CI.95 = -.008, .298; set-size 10: (M = -.025, SD = .130), t(9) = -.61, p = .558, Cohen’s
d = .19,CI.95 = -.118, .068.
Experiment 8. Experiment 8 was identical to Experiment 4, except that the sample array was presented for 4 s rather than 3 s.
The difference score did not deviate from zero for any of the set-sizes, set-size 2: (M = .003, SD = .050), t(9) = .2, p = .844, Cohen’s d = .064, CI.95 = -.032, .039;
set-size 4: (M = -.025, SD = .07),t(9) = -1.03,p = .33, Cohen’s d = .33, CI.95 =
-.080, .030; set-size 6: (M = -.0795, SD = .116), t(9) = -2.17, p = .058, Cohen’s d = .69, CI.95 = -.162, .003; set-size 8: (M = .051,SD = .122), t(9) = 1.3,p = .225,
Cohen’sd = .41,CI.95 = -.037, .138; set-size 10: (M = .037, SD = .129),t(9) = .9, p =
.39, Cohen’sd = .29, CI.95 = -.055, .129.
General Discussion
What types of mechanisms underlie our cognitive capacity limitations? Following Miller’s (1956) seminal paper, a prominent view has been that capacity limitations in different domains might be interrelated (see Cowan, 2001, 2015), perhaps because they are all based on a parallel individuation system. While some results supported this view (e.g., Chesney & Haladjian, 2011; Knops et al., 2014; Piazza et al., 2011; see also Huang et al., 2012; Oksama & Hy¨on¨a, 2004, for individual differences approaches), there is also a growing literature suggesting that VWM might not rely on a parallel individuation system. For example, there seems to be relatively little cross-talk between a MOT task and a VWM task (Fougnie & Marois, 2006; Hollingworth & Hwang, 2013; H. Zhang et al., 2010), and the effects that WM was thought to exert on attention can also stem from LTM (Fan & Turk-Browne, 2016).
Franconeri, 2007; Franconeri et al., 2010; Holcombe & Chen, 2012). In the case of WM experiments, a variety of factors influence the observed memory capacities (see
introduction). As a result, the historic assumption that different cognitive capacities share a numeric value might be little more than a coincidence due to the way in which these capacities have been tested.
The current results are consistent with this view, suggesting that WM limitations cannot be explained just based on attentional limitations. Indeed, attention and WM seem to have different properties: MOT performance was slightly better in pure displays than in mixed displays, while WM performance was slightly better with mixed displays. These effects were rather weak, but are consistent with earlier results on both MOT (Erlikhman et al., 2013; Makovski & Jiang, 2009a) and WM (e.g., Feigenson & Halberda, 2008; Wood, 2008; Wong et al., 2008). In particular, the effect of category membership seems to differ between MOT and WM experiments, respectively. While this effect was not large, it was not expected to be so. Considering the primitive nature of the mechanisms involved in WM and MOT, the very fact of finding that categories differentially affect them is remarkable. We thus tentatively conclude that WM and MOT do not rely on the same mechanisms.10
Do our results rely on category-membership or visual similarity?
While MOT and WM seem to react differently to manipulations of
group-membership, it is important to ask which aspects of this manipulation drove
these differences. In fact, not only did our different-category items belong to different
categories, but they also had different visual features. As a result, differences in category
membership or on visual feature composition might affect MOT and WM performance,
and might also affect them differently. While the current data do not allow us to tease
apart these possibilities, we speculate that WM performance might be more affected by
category membership, while MOT performance might be more sensitive to similarity in
10We draw this conclusion for the change detection paradigm where all items are presented
perceptual features. This speculation is based on a number of observations. With
respect to WM, it is well known that items have to be encoded categorically for adults
to have non-trivial WM capacities (e.g., Olsson & Poom, 2005). Likewise, in infants and
children, visually identical objects are memorizedas if they belong to different
categories if they are given distinct verbal labels (e.g., Feigenson & Halberda, 2008).
Given the close two-way relationship between verbal labels and categories (e.g., Balaban
& Waxman, 1997; Markman, 1994; Waxman & Markow, 1995), these results suggest
that category membership might be critical to WM. This view is also consistent with
recent findings suggesting that memory items are stored in those brain regions where
they are processed to begin with (e.g., Lee, Kravitz, & Baker, 2013; Riggall & Postle,
2012; Sreenivasan, Vytlacil, & D’Esposito, 2014; Sreenivasan, Curtis, & D’Esposito,
2014). As items from different categories likely are stored in different regions, this might
reduce interference among memory representations, and thus lead to better memory.
In the case of MOT, performance can be affected by simple perceptual features
such as color (e.g., Erlikhman et al., 2013; Makovski & Jiang, 2009a; St¨ormer et al.,
2011), and, more generally, by perceptual grouping (e.g., Keane et al., 2011; Scholl et
al., 2001; Yantis, 1992). To the extent that colors are not perceived as categories,
category structure might thus be more important for WM than for MOT. If this
speculation is correct, it would suggest another way in which WM and MOT dissociate.
Further research is needed to test this possibility.
Explaining earlier evidence for a general cognitive capacity
The arguments provided thus far do not imply that there is no relation between attention, small number processing and WM. In fact, data such as Piazza et al.’s (2011) correlation between the subitizing range and VWM capacity still require an
explanation. We speculatively envision three such explanations. Our first account is maybe the most deflationary one. Given that MOT performance correlates with
performance on tasks that, at least intuitively, have no obvious mechanistic relationship
tasks that require processing of visual objects are linked through some common factors
such as general vigilance or compliance with the task.
Our second account is based on the observation that, at least in the case of WM and MOT, there might be a common limitation that does not imply a common
mechanism. Specifically, Franconeri, Alvarez, and Cavanagh (2013) suggested that, in MOT experiments, objects might interfere with each other when they pass close to each other, and that this interference limits how many objects we can track (see also Zhong, Ma, Wilson, Liu, & Flombaum, 2014, for a related model).
With respect to (visual) WM, Endress and Potter (2014) argued that proactive interference was a common feature of many WM experiments, due to the reuse the same set of limited items across many trials.11 Accordingly, they showed that there are no
clear bounds to how many items we can temporarily remember when proactive
interference is minimized (though it is not clear to what extent memory is limited when participants have to encode spatial information; see e.g. Banta Lavenex et al., 2015; Makovski, 2016). Further, Endress and Szab´o (in press) provided mathematical proofs that limited memory capacity estimates are essentially an inevitable consequence of the mere existence of inter-item interference. Both MOT and WM might thus be
constrained by inter-item interference, though the mechanisms that are susceptible to interference likely differ across these tasks.
Our third speculative account is that WM might use a parallel attentional system to individuate items that need to be retained; however, once the memory items are individuated, WM might also be constrained by other limiting factors. That is, WM and MOT might rely on a common set of mechanisms, but also on other mechanisms that are different across the tasks. If so, it will be important to perform more targeted experiments to find out which mechanisms are shared, and which are not. Under either of these accounts, the current results suggest that WM and parallel attention may have at least partially dissociable properties, and might thus not rely on the same
11For example, in Luck and Vogel’s (1997) change detection experiment, participants had to remember
References
Alvarez, G. A., & Cavanagh, P. (2004). The capacity of visual short-term memory is set both by visual information load and by number of objects. Psychological Science,
15(2), 106–111.
Alvarez, G. A., & Franconeri, S. L. (2007). How many objects can you track? evidence for a resource-limited attentive tracking mechanism. Journal of Vision, 7(13), 14.1–1410. doi: 10.1167/7.13.14
Awh, E., Barton, B., & Vogel, E. K. (2007). Visual working memory represents a fixed number of items regardless of complexity. Psychological Science, 18(7), 622–628. doi: 10.1111/j.1467-9280.2007.01949.x
Awh, E., & Jonides, J. (2001). Overlapping mechanisms of attention and spatial working memory. Trends in cognitive sciences, 5, 119–126.
Baddeley, A. D. (1966). Short-term memory for word sequences as a function of acoustic, semantic and formal similarity. The Quarterly Journal of Experimental Psychology, 18(4), 362–365. doi: 10.1080/14640746608400055
Baddeley, A. D., & Hitch, G. (1974). Working memory. In G. Bower (Ed.), The psychology of learning and motivation: Advances in research and theory. (Vol. VIII, p. 47-90). New York: Academic Press.
Balaban, M. T., & Waxman, S. R. (1997). Do words facilitate object categorization in 9-month-old infants? Journal of experimental child psychology, 64, 3–26. doi: 10.1006/jecp.1996.2332
Banta Lavenex, P., Boujon, V., Ndarugendamwo, A., & Lavenex, P. (2015). Human short-term spatial memory: precision predicts capacity. Cognitive Psychology,77, 1–19. doi: 10.1016/j.cogpsych.2015.02.001
Bays, P. M., Catalao, R. F. G., & Husain, M. (2009). The precision of visual working memory is set by allocation of a shared resource. Journal of Vision, 9(10), 7.1–711. doi: 10.1167/9.10.7
Bonatti, L., Frot, E., Zangl, R., & Mehler, J. (2002). The human first hypothesis: identification of conspecifics and individuation of objects in the young infant.
Cognitive Psychology,44(4), 388–426. doi: 10.1006/cogp.2002.0779
Borenstein, M., Hedges, L. V., Higgins, J. P., & Rothstein, H. R. (2010). A basic introduction to fixed-effect and random-effects models for meta-analysis. Research Synthesis Methods, 1(2), 97–111. doi: 10.1002/jrsm.12
Burr, D. C., Turi, M., & Anobile, G. (2010). Subitizing but not estimation of numerosity requires attentional resources. Journal of Vision, 10(6), 20. doi: 10.1167/10.6.20
Buschman, T. J., Siegel, M., Roy, J. E., & Miller, E. K. (2011). Neural substrates of cognitive capacity limitations. Proceedings of the National Academy of Sciences of the United States of America, 108(27), 11252–11255. doi:
10.1073/pnas.1104666108
Chen, Z., & Cowan, N. (2009). How verbal memory loads consume attention. Memory and Cognition, 37(6), 829–836. doi: 10.3758/MC.37.6.829
Chesney, D. L., & Haladjian, H. H. (2011). Evidence for a shared mechanism used in multiple-object tracking and subitizing. Attention, Perception and Psychophysics,
73(8), 2457–2480. doi: 10.3758/s13414-011-0204-9
Conrad, R. (1963). Acoustic confusions and memory span for words. Nature, 197, 1029–1030.
Conrad, R., & Hull, A. J. (1964). Information, acoustic confusion and memory span.
British Journal of Psychology, 55, 429–432.
Cowan, N. (2001). The magical number 4 in short-term memory: a reconsideration of mental storage capacity. Behavioral and Brain Sciences, 24(1), 87–114.
Cowan, N. (2005). Working memory capacity. Hove, UK: Psychology Press.
Cowan, N. (2015). George miller’s magical number of immediate memory in retrospect: Observations on the faltering progression of science. Psychological Review,122(3), 536–541. doi: 10.1037/a0039035
recognition: evidence from proactive interference. Memory, 13(3-4), 293–299. Craik, F. I., & Lockhart, R. S. (1972). Levels of processing: A framework for memory
research. Journal of verbal learning and verbal behavior, 11(6), 671–684.
Curby, K. M., & Gauthier, I. (2007). A visual short-term memory advantage for faces.
Psychonomic Bulletin and Review,14(4), 620–628.
Downing, P. E. (2000). Interactions between visual working memory and selective attention. Psychological science,11, 467–473. doi: 10.1111/1467-9280.00290 Endress, A. D., & Potter, M. C. (2012). Early conceptual and linguistic processes operate in independent channels. Psychological Science, 23(3), 235–245. doi: 10.1177/0956797611421485
Endress, A. D., & Potter, M. C. (2014). Large capacity temporary visual memory.
Journal of Experimental Psychology. General,143(2), 548–65.
Endress, A. D., & Szab´o, S. (in press). Interference and memory capacity limitations.
Psychological Review.
Eng, H. Y., Chen, D., & Jiang, Y. (2005). Visual working memory for simple and complex visual stimuli. Psychonomic Bulletin and Review, 12(6), 1127–1133. Engle, R. W. (2002). Working memory capacity as executive attention. Current
Directions in Psychological Science,11(1), 19-23. doi: 10.1111/1467-8721.00160 Erlikhman, G., Keane, B. P., Mettler, E., Horowitz, T. S., & Kellman, P. J. (2013).
Automatic feature-based grouping during multiple object tracking. Journal of Experimental Psychology. Human Perception and Performance,39(6), 1625–1637. doi: 10.1037/a0031750
Fan, J. E., & Turk-Browne, N. B. (2013). Internal attention to features in visual short-term memory guides object learning. Cognition, 129, 292–308. doi: 10.1016/j.cognition.2013.06.007
Fan, J. E., & Turk-Browne, N. B. (2016). Incidental biasing of attention from visual long-term memory. Journal of experimental psychology. Learning, memory, and cognition, 42, 970–977. doi: 10.1037/xlm0000209
limit. Cognition, 107(1), 1–18. doi: 10.1016/j.cognition.2007.07.006
Feigenson, L., Carey, S., & Hauser, M. (2002). The representations underlying infants’ choice of more: Object files versus analog magnitudes. Psychological Science,
13(2), 150-6.
Feigenson, L., & Halberda, J. (2008). Conceptual knowledge increases infants’ memory capacity. Proceedings of the National Academy of Sciences of the United States of America, 105(29), 9926–9930. doi: 10.1073/pnas.0709884105
Fougnie, D., & Marois, R. (2006). Distinct capacity limits for attention and working memory: Evidence from attentive tracking and visual working memory paradigms.
Psychological Science, 17(6), 526–534. doi: 10.1111/j.1467-9280.2006.01739.x Franconeri, S. L., Alvarez, G. A., & Cavanagh, P. (2013). Flexible cognitive resources:
competitive content maps for attention and memory. Trends in Cognitive Sciences, 17(3), 134–141. doi: 10.1016/j.tics.2013.01.010
Franconeri, S. L., Jonathan, S. V., & Scimeca, J. M. (2010). Tracking multiple objects is limited only by object spacing, not by speed, time, or capacity. Psychological Science,21(7), 920–925. doi: 10.1177/0956797610373935
Gauthier, I., Tarr, M. J., Anderson, A. W., Skudlarski, P., & Gore, J. C. (1999).
Activation of the middle fusiform ’face area’ increases with expertise in recognizing novel objects. Nature Neuroscience, 2(6), 568–573. doi: 10.1038/9224
Holcombe, A. O., & Chen, W.-Y. (2012). Exhausting attentional tracking resources with a single fast-moving object. Cognition,123(2), 218–228. doi:
10.1016/j.cognition.2011.10.003
Hollingworth, A., & Hwang, S. (2013). The relationship between visual working memory and attention: retention of precise colour information in the absence of effects on perceptual selection. Philos Trans R Soc Lond B Biol Sci, 368(1628), 20130061. doi: 10.1098/rstb.2013.0061
Huang, L., Mo, L., & Li, Y. (2012). Measuring the interrelations among multiple paradigms of visual attention: an individual differences approach. Journal of experimental psychology. Human perception and performance, 38, 414–428. doi: 10.1037/a0026314
Hulleman, J. (2005). The mathematics of multiple object tracking: from proportions correct to number of objects tracked. Vision Research, 45(17), 2298–2309. doi: 10.1016/j.visres.2005.02.016
Intraub, H. (1980). Presentation rate and the representation of briefly glimpsed pictures in memory. Journal of Experimental Psychology: Human Learning and Memory,
6(1), 1–12.
Izard, V., & Dehaene, S. (2008). Calibrating the mental number line. Cognition,
106(3), 1221–1247. doi: 10.1016/j.cognition.2007.06.004
Jackson, M. C., & Raymond, J. E. (2008). Familiarity enhances visual working memory for faces. Journal of Experimental Psychology. Human Perception and
Performance,34(3), 556–568. doi: 10.1037/0096-1523.34.3.556
Jevons, W. S. (1871). The power of numerical discrimination. Nature,3, 281–282. Kanwisher, N., McDermott, J., & Chun, M. M. (1997). The fusiform face area: a
module in human extrastriate cortex specialized for face perception. Journal of Neuroscience, 17(11), 4302–4311.
Keane, B. P., Mettler, E., Tsoi, V., & Kellman, P. J. (2011). Attentional signatures of perception: multiple object tracking reveals the automaticity of contour
interpolation. Journal of Experimental Psychology. Human Perception and Performance,37(3), 685–698. doi: 10.1037/a0020674
Knops, A., Piazza, M., Sengupta, R., Eger, E., & Melcher, D. (2014). A shared, flexible neural map architecture reflects capacity limits in both visual short-term memory and enumeration. Journal of Neuroscience, 34(30), 9857–9866. doi:
10.1523/JNEUROSCI.2758-13.2014
997–999. doi: 10.1038/nn.3452
Lepsien, J., & Nobre, A. C. (2007). Attentional modulation of object representations in working memory. Cerebral Cortex,17(9), 2072–2083. doi: 10.1093/cercor/bhl116 Luck, S. J., & Vogel, E. K. (1997). The capacity of visual working memory for features
and conjunctions. Nature,390(6657), 279–281. doi: 10.1038/36846
Majerus, S., Cowan, N., P´eters, F., Van Calster, L., Phillips, C., & Schrouff, J. (2014). Cross-modal decoding of neural patterns associated with working memory: Evidence for attention-based accounts of working memory. Cerebral Cortex. doi: 10.1093/cercor/bhu189
Makovski, T. (2016). Does proactive interference play a significant role in visual working memory tasks? Journal of experimental psychology. Learning, memory, and cognition, 42, 1664–1672. doi: 10.1037/xlm0000262
Makovski, T., & Jiang, Y. V. (2008). Proactive interference from items previously stored in visual working memory. Memory and Cognition, 36(1), 43–52.
Makovski, T., & Jiang, Y. V. (2009a). Feature binding in attentive tracking of distinct objects. Visual Cognition,17(1-2), 180–194. (PMID: 19492017) doi:
10.1080/13506280802211334
Makovski, T., & Jiang, Y. V. (2009b, Dec). The role of visual working memory in attentive tracking of unique objects. Journal of Experimental Psychology. Human Perception and Performance,35(6), 1687–1697. doi: 10.1037/a0016453
Markman, E. M. (1994). Constraints on word meaning in early language acquisition.
Lingua, 92, 199 - 227. doi: http://dx.doi.org/10.1016/0024-3841(94)90342-5 Miller, G. A. (1956). The magical number seven, plus or minus two: Some limits on our
capacity for processing information. Psychological Review,63(2), 81–97.
Morey, C. C., & Bieler, M. (2013). Visual short-term memory always requires general attention. Psychonomic Bulletin and Review, 20(1), 163–170. doi:
10.3758/s13423-012-0313-z
Cognition, 28(3), 411–421.
Oksama, L., & Hy¨on¨a, J. (2004). Is multiple object tracking carried out automatically by an early vision mechanism independent of higher-order cognition? an
individual difference approach. Visual Cognition, 11(5), 631-671. doi: 10.1080/13506280344000473
Olsson, H., & Poom, L. (2005). Visual memory needs categories. Proceedings of the National Academy of Sciences of the United States of America,102(24), 8776-80. doi: 10.1073/pnas.0500810102
Phillips, W. A. (1974). On the distinction between sensory storage and short-term visual memory. Perception and Psychophysics,16(2), 283–290.
Piazza, M., Fumarola, A., Chinello, A., & Melcher, D. (2011). Subitizing reflects visuo-spatial object individuation capacity. Cognition, 121(1), 147–153. doi: 10.1016/j.cognition.2011.05.007
Potter, M. C., Staub, A., Rado, J., & O’Connor, D. H. (2002). Recognition memory for briefly presented pictures: the time course of rapid forgetting. Journal of
Experimental Psychology. Human Perception and Performance,28(5), 1163-75. Pylyshyn, Z. W., & Storm, R. W. (1988). Tracking multiple independent targets:
evidence for a parallel tracking mechanism. Spatial Vision, 3(3), 179–197.
Revkin, S. K., Piazza, M., Izard, V., Cohen, L., & Dehaene, S. (2008). Does subitizing reflect numerical estimation? Psychological Science, 19(6), 607–614. doi:
10.1111/j.1467-9280.2008.02130.x
Riggall, A. C., & Postle, B. R. (2012). The relationship between working memory storage and elevated activity as measured with functional magnetic resonance imaging. Journal of Neuroscience, 32(38), 12990–12998. doi:
10.1523/JNEUROSCI.1892-12.2012
Rouder, J. N., Morey, R. D., Cowan, N., Zwilling, C. E., Morey, C. C., & Pratte, M. S. (2008). An assessment of fixed-capacity models of visual working memory.
Proceedings of the National Academy of Sciences of the United States of America,
Sands, S. F., & Wright, A. A. (1980). Primate memory: Retention of serial list items by a rhesus monkey. Science, 209(4459), 938–940.
Scholl, B. J., & Pylyshyn, Z. W. (1999). Tracking multiple items through occlusion: Clues to visual objecthood. Cognitive Psychology, 38(2), 259-90.
Scholl, B. J., Pylyshyn, Z. W., & Feldman, J. (2001). What is a visual object? evidence from target merging in multiple object tracking. Cognition,80(1-2), 159–177. Sreenivasan, K. K., Curtis, C. E., & D’Esposito, M. (2014). Revisiting the role of
persistent neural activity during working memory. Trends in Cognitive Sciences,
18(2), 82–89. doi: 10.1016/j.tics.2013.12.001
Sreenivasan, K. K., Vytlacil, J., & D’Esposito, M. (2014). Distributed and dynamic storage of working memory stimulus information in extrastriate cortex. Journal of Cognitive Neuroscience,26(5), 1141–1153.
St¨ormer, V. S., Li, S.-C., Heekeren, H. R., & Lindenberger, U. (2011). Feature-based interference from unattended visual field during attentional tracking in younger and older adults. Journal of Vision,11(2). doi: 10.1167/11.2.1
Toro, J. M., Sinnett, S., & Soto-Faraco, S. (2005). Speech segmentation by statistical learning depends on attention. Cognition, 97(2), B25-34. doi:
10.1016/j.cognition.2005.01.006
Trick, L., & Pylyshyn, Z. W. (1994). Why are small and large numbers enumerated differently? A limited-capacity preattentive stage in vision. Psychological Review,
101(1), 80-102.
Tsubomi, H., Fukuda, K., Watanabe, K., & Vogel, E. K. (2013). Neural limits to representing objects still within view. The Journal of neuroscience : the official journal of the Society for Neuroscience,33, 8257–8263. doi:
10.1523/JNEUROSCI.5348-12.2013
Tuholski, S. W., Engle, R. W., & Baylis, G. C. (2001). Individual differences in working memory capacity and enumeration. Memory and Cognition, 29(3), 484–492. Turk-Browne, N. B., Jung´e, J., & Scholl, B. J. (2005). The automaticity of visual
doi: 10.1037/0096-3445.134.4.552
van den Berg, R., Shin, H., Chou, W.-C., George, R., & Ma, W. J. (2012). Variability in encoding precision accounts for visual short-term memory limitations.
Proceedings of the National Academy of Sciences, 109(22), 8780–8785. doi: 10.1073/pnas.1117465109
Vergauwe, E., Camos, V., & Barrouillet, P. (2014). The impact of storage on processing: how is information maintained in working memory? Journal of Experimental Psychology. Learning, Memory, and Cognition, 40(4), 1072–1095. doi: 10.1037/a0035779
Viswanathan, S., Perl, D. R., Visscher, K. M., Kahana, M. J., & Sekuler, R. (2010). Homogeneity computation: how interitem similarity in visual short-term memory alters recognition. Psychonomic Bulletin and Review,17(1), 59–65. doi:
10.3758/PBR.17.1.59
Vogel, E. K., Woodman, G. F., & Luck, S. J. (2001). Storage of features, conjunctions and objects in visual working memory. Journal of Experimental Psychology. Human Perception and Performance,27(1), 92–114.
Waxman, S. R., & Markow, D. B. (1995). Words as invitations to form categories: evidence from 12- to 13-month-old infants. Cognitive Psychology, 29(3), 257–302. doi: 10.1006/cogp.1995.1016
Wong, J. H., Peterson, M. S., & Thompson, J. C. (2008). Visual working memory capacity for objects from different categories: A face-specific maintenance effect.
Cognition, 108(3), 719-31. doi: 10.1016/j.cognition.2008.06.006
Wood, J. N. (2008). Visual memory for agents and their actions. Cognition, 108(2), 522-32. doi: 10.1016/j.cognition.2008.02.012
Yantis, S. (1992). Multielement visual tracking: attention and perceptual organization.
Cognitive psychology, 24, 295–340.
Zhang, W., & Luck, S. J. (2008). Discrete fixed-resolution representations in visual working memory. Nature, 453(7192), 233–235. doi: 10.1038/nature06860 Zhong, S.-H., Ma, Z., Wilson, C., Liu, Y., & Flombaum, J. I. (2014). Why do people
Table 3
Counts of a participants with pure vs. mixed advantages in the MOT experiments
Set-size Exp. 1 Exps. 2a & 2b Exps. 3a & 3b
Pure None Mixed Pure None Mixed Pure None Mixed
2 5 14 5 NA NA NA 1 10 9
4 2 7 15 NA NA NA 5 7 8
●
● ●
●
●
●
●
●
●
● ●
●
●
●
●●
●
●
●
●
●
●
●
●
●
●
●
●
●
●
●
●
●
●
●
●
●
●
●
●
●
●
●
●
●
●
●
●
●
●
●
●
●
●●
●
●
●
●
●
●
●
●
●
●
●●
●
●
●
●
●
●
●
●
●
●
●
●
●
●
●
●
●
●
●
●
●
●
●
●
●
●
●
●
●
●
●
●
●
Mixed advantage Pure advantage
−0.2 0.0 0.2
d Experiment ● ● ● ● ●
[image:41.595.76.521.71.514.2]Exp 1 (yes/no) Exp 2a (click all) Exp 2b (click all) Exp 3a (yes/no) Exp 3b (yes/no)
Figure 1. Distribution of individual difference scores (pure-mixed)/(pure+mixed) across the different multiple object tracking experiments. Positive difference scores indicate a processing advantage for pure (i.e., car or face) displays, while negative difference scores indicate an advantage for mixed (carand face) displays. Circles represent individual participants; the solid line represents the density estimate with a Gaussian kernel and a bandwidth of .01615 (as determined by the Sheather-Jones method). Across
Face advantage
Car advantage
−0.2
0.0
0.2
d (Car vs. Face)
Experiment●
●
● ●
●
[image:42.595.75.524.73.522.2]Exp 1 (yes/no) Exp 2a (click all) Exp 2b (click all) Exp 3a (yes/no) Exp 4b (yes/no)
● ●
●●● ●
●
●
●
●
●
●
● ●
●
● ●
●
●
●
●●
●
●
●
●
●
●
●
●
●
●
●
●
●
●
●
●
●
●
●
●
●
●
●
●
●
●
●
●
●
●
●
● ●
●
●
●
●
●●
●
●
●
●
●
●
●
●
●
●
●
●
●
●
●
●
●
●
●
●
●
●
●
●
●
●
●
●
●
●
●
●
●
●
●
Mixed advantage Pure advantage
−0.2
0.0
0.2
d
Experiment
● ● ● ● ● ● [image:43.595.78.519.79.492.2]Exp 4 (3s)
Exp 5 (3s)
Exp 6a (3s)
Exp 6b (3s)
Exp 7 (2s)
Exp 8 (4s)
Figure 3. Distribution of individual difference scores (pure-mixed)/(pure+mixed) across the different change detection experiments. Positive difference scores indicate a
Face advantage
Face advantage
Face advantage
Face advantage
Face advantage
Face advantage
Car advantage
Car advantage
Car advantage
Car advantage
Car advantage
Car advantage
−0.2
0.0
0.2
d (Car vs. Face)
Experiment●
●
●
●
● ●
[image:44.595.75.524.73.523.2]Exp 4 (3s) Exp 5 (3s) Exp 6a (3s) Exp 6b (3s) Exp 7 (2s) Exp 8 (4s)
Mixed advantage
Pure advantage
−0.2
0.0
0.2
d
Task
[image:45.595.77.523.74.553.2]MOT
WM
Figure 5. Distribution of individual difference scores (pure-mixed)/(pure+mixed) across multiple object tracking (red) and working memory (turquoise) experiments. Positive difference scores indicate a processing advantage for pure (i.e., car or face) displays, while negative difference scores indicate an advantage for mixed (carand face) displays. Circles represent individual participants; the shaded areas represent the corresponding density estimates. Across experiments, the pure advantage was larger for MOT