City, University of London Institutional Repository
Citation
:
Bottoni, G. (2017). Validation of a social cohesion theoretical framework: amultiple group SEM strategy. Quality and Quantity, 52(3), pp. 1081-1102. doi: 10.1007/s11135-017-0505-8
This is the accepted version of the paper.
This version of the publication may differ from the final published
version.
Permanent repository link:
http://openaccess.city.ac.uk/id/eprint/19027/Link to published version
:
http://dx.doi.org/10.1007/s11135-017-0505-8Copyright and reuse:
City Research Online aims to make research
outputs of City, University of London available to a wider audience.
Copyright and Moral Rights remain with the author(s) and/or copyright
holders. URLs from City Research Online may be freely distributed and
linked to.
Validation of a social cohesion theoretical framework: a multiple
group SEM strategy
Gianmaria Bottoni
City University of London,
[email protected]
FOR REFERENCE AND PUBLISHED ARTICLE REFER TO:
Bottoni, G. (2018). Validation of a social cohesion theoretical framework: a multiple group SEM strategy.
Quality and Quantity, International Journal of Methodology, 52(3), 1081-1102, DOI: https://doi.org/10.1007/
s11135-017-0505-8.
Abstract
1. Introduction
The concept of social cohesion dates back to the end of the 19th century. Back then, society experienced epochal transformations, as are also happening nowadays. Whenever there are epochal changes, a social order (cohesion) matter arises. This explains the increasing interest in social cohesion coming from policymakers and scholars.
According to Durkheim (1893), social cohesion involves the notions of solidarity and integration. Whereas in traditional societies the similarity among individuals is the mechanism that produces social cohesion, in modern society social cohesion is based on dissimilarity and functional diversification. Parsons (1951) overturns Durkheim’s perspective suggesting that a society is composed of interdependent sub-systems held together through sharing value processes. According to Tocquevillian theory, the individual actions of affiliated people engender two benefits. They produce both a positive internal effect on members of associations promoting cooperative behaviours and an effect on wider polity fostering cooperation.
The three approaches to social cohesion, cooperation and solidarity are obviously more complex. This foreword is intended merely to show as social cohesion is one of the most important issue that social scientists have been paying attention to since the beginning of social sciences.
2. Social cohesion: an overview
Although the concept of social cohesion dates back to the 19th century, so far there is not an accepted definition (Friedkin 2004). The concept gives rise to several methodological and theoretical questions (Jenson 1998, Bernard 1999, Berger-Schmitt 2002).
Chan et al. (2006) identified two main approaches to social cohesion. In our opinion, there are at least three approaches. The first one comes directly from the official publications of several Institutions (like the European Union, OECD, etc.); the second approach has been developed by social policy analysts or scholars linked to research projects sponsored by those Institutions; finally, the last one is a purely academic approach.
2.1 The institutional approach
The European Union provides a social cohesion notion focused on economic issues. Social cohesion can be increased through the reduction of income disparities. In the long term, disparities produce severe social consequences resulting in marginalisation of segments of society, long-term unemployment and deprivation (European Union 1996).
According to the OECD, social cohesion corresponds with people’s material well-being (Jeannotte 2000). The main factors that can threaten social cohesion are identified in/as poverty, unemployment and income disparity.
The Council of Europe agrees that the aim of social cohesion is the reduction of poverty, unemployment and disparities, but it also states that social cohesion aims to rebuild both social ties between individuals and communities and between citizens and the State (Social, Health and Family Affairs Committee 1998).
None of the above-mentioned organizations provide an explicit definition of social cohesion, focusing instead on the factors that could erode (or promote) it1.
In the 6th Report on Economic, Social and Territorial Cohesion, the European Commission states that
the objective of cohesion policy is to reduce social, economic and territorial disparities providing support to less developed regions (2014). The approach to cohesion remains focused on economic
1 For a detailed review of the factors affecting social cohesion and social cohesion notions provided by
dimensions. Without defining what social cohesion is per se, the concept is merely understood as factor that can affect occupation, social exclusion and regional disparities (European Commission 2014).
The Government of Canada’s Policy Research Sub-Committee has a different orientation about social cohesion. It provides an explicit definition: “the ongoing process of developing a community of shared values, shared challenges and equal opportunity within Canada, based on a sense of trust, hope and reciprocity among all Canadians” (Jenson 1998). Coherent with internal social issues, the definition is based on cultural subjects like sharing values, trust and reciprocity.
The French Government follows the same strategy considering social cohesion a process that benefits the individual’s sense of belonging to the same community and feelings of being recognised as members of that community (Jenson 1998).
The institutional approach presents several weaknesses; firstly the tendency to define social cohesion in terms of the social issues that the institutions have to deal with. Thus, it turns out to be a problem-driven approach (Chan et al. 2006). Promoting multiculturalism was an important issue in the Canadian Government’s agenda. Social cohesion therefore becomes a matter of sharing values, sense of belonging and trust. In Europe, after the entrance of several new countries into the European Union, social cohesion became understood as reduction of inequalities and homogenization of the living condition of all European citizens.
Frequently, the theoretical reasoning about cohesion is poor and it results in a never-ending list of indicators.
2.2 The policy-oriented approach
We preferred to keep apart the policy-oriented and the institutional approaches since the former is scientifically and conceptually more accurate. Although many contributions have been developed by scholars linked to academic institutions, we chose to include these contributions in the “policy-oriented approach” because many of them were part of research projects promoted by several institutions with policy-oriented purposes.
In Europe, one of the most influential contributions on social cohesion comes from Berger-Schmitt (2000; 2002) and Noll (2002). Social cohesion is made up of two dimensions that also represent two societal goals. The first dimension aims at promoting equal opportunities and at reducing disparities. It consists of three sub-dimensions/goals named “regional disparities”, “equal opportunities” and “social exclusion” (Berger-Schmitt 2002). The second goal/dimension concerns the objective of strengthening social relations and it is composed of “social relations within primary social groups and associations”, “quality of social relations” and “quality of societal institutions”. This social cohesion conceptualization has been operationalized in the context of the project named European System of Social Indicators (EUSI). The six sub-dimensions have been measured within each of the 14 “life domains” – policy goals – covered by the European System of Social Indicators.
A weakness of the Berger-Schmitt’s formulation lies in the means-end approach adopted (Chan et al. 2006). Berger-Schmitt defines social cohesion in terms of conditions – more social capital and less inequality – that can positively affect social cohesion.
Consistently with the Canadian policy needs, Jenson (1998) provides a conceptualization focused on cultural issues. Sharing values, collective identity, respect of differences become the most relevant factors. Jenson (1998) breaks social cohesion down into five constituents:
Belonging – Isolation (sharing values, collective identity);
Inclusion – Exclusion (equality of opportunity on labour market);
Participation – Non-involvement (political and social participation);
Recognition – Rejection: (respect of differences);
Legitimacy – Illegitimacy: (legitimacy of institutions).
Similarly, Jenson’s social cohesion formulation problems can be found in another Canadian proposal. Duhaime et al. (2004) split social cohesion into two dimensions – access to formal, economic and governmental institutions and access to family and community-based face-to face relations – identifying six sets of indicators. The indicator sets are:
1. Presence of social capital; 2. Demographic stability; 3. Social inclusion; 4. Economic inclusion; 5. Community quality of life; 6. Individual quality of life.
Taking into account that social cohesion is intended as access to formal, economic and governmental institutions and access to family and community-based face-to face relations, only sets number 1, 3 and 4 include correct indicators. In addition, sets number 2, 4, 5 and 6 are not constituents of social cohesion but factors influencing social cohesion quotas (Chan et al. 2006).
The policy-oriented approach had the merit to refocus the attention on social cohesion concept. There are also many weaknesses related to fact that it is a problem-driven approach. There is the tendency to operationalize social cohesion in terms of policy goals that should be achieved (e.g. reducing inequality, building of a sharing values community, etc.). This leads to mixing up the constituents and the conditions of social cohesion reflecting the political orientation of the discourse (Dickes et al. 2010).
2.3 The academic approach
The Le Bon’s theory of contagion is one of the earlier precursors of the social cohesion concept. According to Le Bon (1985), crowds have a life of their own and exert an influence over their members. Crowds can inspire intense emotions and irrational acts. The solidarity that can arise from crowd is due to its “uniformity of action” which in turn is caused by anonymity and contagion. In the same time, Durkheim investigates the relationship between social cohesion and suicide.
In the modern era, social cohesion is understood as primary and secondary relationships within a community (Lockwood 1999). In Lockwood’s formulation, there are two distinct conceptual axes regarding the institutional order at macro-level and primary networks at micro-level. The first axis is characterised by the continuum civic integration-civic corruption and the second axis by social cohesion-social dissolution. The axes represent the two levels of social integration that refer to orderly or conflictual relationships amongst individuals.
Whelan and Maître (2005) propose analysing social cohesion at three levels. At micro-level there are indicators concerning interpersonal trust, risk of exclusion and the strength of relationships within family and primary groups. The meso-level regards the strength of relationships within secondary group, neighbourhood, working groups and different ethnic groups, whereas the macro-level includes dimensions like respect of differences, sense of belonging to a community and efficiency of institutions. However, the indicators included in the operationalization do not cover the three levels of social cohesion identified. They relate to perception of public services quality, attitudes toward the social benefits system, alienation (general absence of trust in the society as a whole) and perception of conflicts amongst different groups and interpersonal trust. With the exception of interpersonal trust and perception of conflicts among groups, all the other indicators refer to the macro-level. The operationalization proposed by Whelan and Maître seems to be meagre with two dimensions measured by only one indicator.
The formulation provided by Chan et al. (2006) takes into account a horizontal dimension – relationships amongst individuals and groups – and a vertical dimension – relationships between States and citizens – along with two components – attitudinal and behavioural. Crossing dimensions and components and suggesting some suitable indicators, Chan et al. provide a scheme of social cohesion (tab.1).
Tab.1 – Chan et al.’s scheme
Dimensions Components
Subjective (attitudes) Objective (behaviours)
Horizontal
-general trust with fellow citizens -willingness to cooperate
-sense of belonging
-social participation -voluntarism
Vertical -trust in public figures
-confidence in political institutions -Political participation
Dickes et al. (2010) and Dickes and Valentova (2013) integrate the theory of Bernard (1999) and Chan et al. (2006) showing that the framework proposed by Chan et al. overlaps the Bernard conceptualization with the exception of the economic domain. By means of a confirmatory factor analysis, Dickes et al. (2010) distinguish four latent factors pertaining to institutional trust, solidarity, social-cultural participation and political participation.
The major weakness of academic approach is related to the fact that scholars have not developed a homogeneous social cohesion concept, obstructing the development of a well-structured social cohesion theory.
3. What is social cohesion? A proposal
Taking into account three domains of interest – individuals, groups and institutions – we can identify at least six levels of social cohesion (tab.2). The first one involves relationships between individuals. The second level concerns relationships between individuals and groups whereas the third level focuses on relationships between individuals and institutions. The fourth has to do with relationships between groups as a whole and the fifth level focuses on relationships between groups and institutions. Finally, the sixth level involves relationships between institutions.
Tab.2 – Levels of social cohesion
Domain Individuals Groups Institutions
Individuals 1 2 3
Groups 4 5
Institutions 6
A researcher can also investigate the within dimension analysing the relationships within a group (e.g. mechanisms of identification or discrimination towards an out-group) or within an institution (e.g. how the different parts of an institution are connected).
Following a methodological individualism approach, we will take into account only the levels comprising individuals (levels 1, 2 and 3). Thus, although social cohesion is considered a societal attribute, it is ascribed to individual attitudes and behaviours.
3.1 Relationships between individuals
This level involves at least the connection between two individuals. There are three possible connections. Positive ties include relationships generally considered positive (e.g. friendship relations, marriage, family relations). A negative tie implies a hostile relationship between actors, whereas no ties denote an absence of relationships (e.g. not knowing, breaking up). Relationships can be more or less strong. Strong ties are relationships in which people have a strong emotional involvement or an intense interaction (e.g. marriage, friendship). Weak ties are relationships in which the interaction is limited or individuals are not so close (e.g. neighbourhood relationships). Weak ties are as important as strong ties. Indeed, weak ties are a fundamental source for drawing information and they represent essential bridges connecting different networks (Granovetter 1973).
3.2 Individual-groups relationships
If relationships between individuals pertain to informal connections involving primary groups, individual-groups relationships refer to formal connections in secondary groups concerning the individuals’ role and affiliation with groups or organizations (religious, political, cultural, voluntary and sports associations). Researchers are interested in the participation of the people to those groups. Furthermore, it is fundamental to study attitudes and interactions between an individual and members of other social groups. For example, a researcher could be interested in studying to what extent a person have a positive attitude towards a minority group, a different ethnic community or a group with different creed. Nowadays, it is fundamental that attitudes should be positive and inter-group interactions intense.
3.3 Individual-institutions relationships
This represents a central issue since tensions and low levels of interaction between institutions and their inhabitants pose a threat to social cohesion. Governments can put into practice aggressive actions like repressions, violation of civil rights and persecutions. Inhabitants can also act in an aggressive way against the state (strikes, rebellions, revolutions, terrorism and so forth).
The individual-institutions relationship involves the concept of legitimacy. Institutions in a modern state, which is not based on coercion, should have a strong reputation – legitimacy – among their citizens. The institutions can exert its role only through legitimacy acting as a mediator of social conflicts.
The “quality of institutions” is also essential. The quality of institutions in terms of quality of service provided (e.g. school, health, etc.) represents the environment (understood as means provided to reach legitimate goals) in which people act and constitutes the horizon of their possibilities (Merton 1949).
3.4 The social cohesion scheme
Following Bollen and Hoyle (1990), we also consider two perspectives: subjective – involving attitudes – and objective – concerning behaviours. Crossing the three levels and the two perspectives, we obtain the social cohesion scheme presented in tab.3.
Tab.3 – Conceptual scheme
Levels Perspectives
Subjective Objective
Micro Relationships among individuals within a subjective perspective
Relationships among individuals within an objective perspective
Meso Relationships among individuals and groups within a subjective perspective
Relationships among individuals and groups within an objective perspective Macro Relationships among individuals and
society within a subjective perspective
Relationships among individuals and society within an objective perspective
The conceptual scheme intends to help researchers to measure social cohesion identifying indicators for all the levels and for each perspective.
As we suggested before, the levels at which a researcher can study social cohesion are more numerous and can include studying it among groups or institutions considered as a whole. We will consider only the interactions comprising individuals. Thus, the unit of analysis will be always the individual. The scheme is useful not only to study social cohesion within a country, although this is our perspective. A researcher could study cohesion within groups, associations, firms, wards, departments, organizations, institutions, etc. For example, cohesion could be studied within a firm considering the interactions, attitudes and behaviours of an employee toward his colleagues (micro-level), toward his working group as a whole (meso-level) and toward his firm (macro-level).
4. Operationalization of social cohesion
The operationalization of social cohesion takes into account the aforementioned conceptual scheme and the theoretical contributions previously illustrated.
Considering the three levels and the two perspectives, we identified seven constituents of social cohesion (tab.4).
Tab.4 – The constituents of social cohesion
subjective objective
Micro Interpersonal trust Density of social relations
Social support
Meso Openness Participation
Macro Institutional trust Legitimacy of institutions
belonging to the same group (intra-group relationships). Thus, a researcher should analyse if relationships are segregated within one group without any connection with external individuals.
Tab.5 – The indicators of social cohesion
Label Min Max Mean SD Skew. Kurt.
Interpersonal Trust
Most people can be trusted or you can't be too careful A3 0 10 4.92 2.489 -.266 -.663 Most people try to take advantage of you, or try to be fair A4 0 10 5.50 2.342 -.406 -.329 Most of the time people helpful or mostly looking out for themselves A5 0 10 4.86 2.385 -.183 -.556 Density of social relations
How often socially meet with friends, relatives or colleagues C2 1 7 4.79 1.634 -.428 -.771 How many people with whom you can discuss intimate and personal matters C3 0 6 2.67 1.440 .151 -.514 Take part in social activities compared to others of same age C4 1 5 2.67 / / / Social support
Feel people in local area help one another D21 0 6 3.65 1.583 -.467 -.380 Feel appreciated by people you are close to D29 0 10 7.82 1.802 -1.015 1.300 Receive help and support from people you are close to D36 0 6 4.96 1.253 -1.511 2.418 Participation
Contacted politician or government official last 12 months B11 0 1 .12 / / / Worked in political party or action group last 12 months B12 0 1 .04 / / / Worked in another organisation or association last 12 months B13 0 1 .13 / / / Worn or displayed campaign badge/sticker last 12 months B14 0 1 .07 / / /
Signed petition last 12 months B15 0 1 .19 / / /
Taken part in lawful public demonstration last 12 months B16 0 1 .07 / / / Boycotted certain products last 12 months B17 0 1 .15 / / / Involved in work for voluntary or charitable organisations, how often past 12 months D1R 1 6 1.97 / / / Openness
Immigration bad or good for country's economy B32 0 10 4.87 2.555 -.112 -.551 Country's cultural life undermined or enriched by immigrants B33 0 10 5.51 2.627 -.301 -.556 Immigrants make country worse or better place to live B34 0 10 4.94 2.420 -.109 -.303 Allow many/few immigrants of different race/ethnic group from majority B30R 1 4 2.51 / / / Institutional trust
Trust in country's parliament B2 0 10 3.94 2.679 .102 -.923
Trust in the legal system B3 0 10 4.73 2.832 -.130 -.994
Trust in the police B4 0 10 5.69 2.761 -.505 -.610
Trust in politicians B5 0 10 3.22 2.449 .286 -.851
Trust in political parties B6 0 10 3.22 2.426 .293 -.792
Trust in the European Parliament B7 0 10 4.33 2.586 -.045 -.715
Trust in the United Nations B8 0 10 5.11 2.673 -.309 -.650
Legitimacy of institutions
How satisfied with the national government B22 0 10 3.98 2.582 .048 -.911 How satisfied with the way democracy works in country B23 0 10 5.16 2.574 -.321 -.669 State of education in country nowadays B24 0 10 5.56 2.426 -.406 -.454 State of health services in country nowadays B25 0 10 5.16 2.649 -.258 -.835 Note: for dichotomous and qualitative variables, we have not computed the standard deviation, skewness and kurtosis taking into account their nature.
The macro-level comprises two related sub-dimensions: institutional trust and legitimacy of institutions. The institutions act like mediators solving and weakening social conflicts. In addition, the two institutional dimensions help to avoid falling in a paradox. Criminal organisations have high levels of internal cohesion. But we are interested in the cohesion that involves individuals acting in a society recognising its set of rule and the legitimacy of its institutions.
We have not included the elements concerning the economic domain (exclusion from labour market, income inequality, economic deprivation, etc.) since we consider them factors affecting social cohesion rather than its constituents. Following Durkheim (1893), we also left out cultural aspects like belonging, sharing values and feeling part of a community. Indeed, those are typical conditions of archaic societies in which social cohesion is kept trough similarities between individuals, sharing values and a sense of belonging to the same community.
cohesion scheme2. In addition, we report several descriptive statistics along with labels that refer to
the corresponding question in the ESS questionnaire wave 63.
5. Methodology
In order to test the validity of the social cohesion scheme proposed, we employed the large dataset provided by European Social Survey (ESS; wave 6). The ESS is a cross-national survey conducted every two years in several countries. The purpose of ESS is to measure attitudes, beliefs and behaviours of EU citizens. In wave 6, data were collected in 29 countries (tab.6).
The total sample size is 54672 individuals. It is representative of individuals aged 15 and over (without an upper age limit) resident within private households in each country. The average age is 48.3 (SD= 18.5) and 54.4% are women4.
The overarching aim of the paper is to test the validity of the social cohesion framework proposed above. In order to fulfil this objective, we performed several analyses. Adopting a new available approach (Asparouhov and Muthen 2009), we conducted an exploratory factor analysis in Mplus. Before carrying out more complex analyses, this step helped us to evaluate if the hypothesised social cohesion model is roughly identifiable in the data. Afterwards, adopting a structural equation modeling approach, we performed a confirmatory factor analysis (CFA) to test our model. Precisely, in order to perform a cross-validation analysis, we split the sample into two independent random samples. We performed a confirmatory factor analysis on the first sample then tested if the model is tenable also in the second sample. This step is useful in order to assess if the parameters of the CFA model are merely driven by particular characteristics of the sample on which the model is tested (MacCallum et al. 1992). The procedure adopted makes possible to cross-validate the findings (Cudeck and Browne 1983).
Tab.6 – Countries and sample size
Country Sample Size % Country Sample Size % Country Sample Size % Albania 1201 2.2 Finland 2197 4.0 Norway 1624 3.0 Belgium 1869 3.4 France 1968 3.6 Poland 1898 3.5 Bulgaria 2259 4.1 United Kingdom 2286 4.2 Portugal 2151 3.9 Switzerland 1493 2.7 Hungary 2014 3.7 Russian Federation 2484 4.5 Cyprus 1116 2.0 Ireland 2628 4.8 Sweden 1847 3.4 Czech Republic 2009 3.7 Israel 2508 4.6 Slovenia 1257 2.3 Germany 2958 5.4 Iceland 752 1.4 Slovakia 1847 3.4 Denmark 1650 3.0 Italy 960 1.8 Ukraine 2178 4.0 Estonia 2380 4.4 Lithuania 2109 3.9 Kosovo 1295 2.4 Spain 1889 3.5 Netherlands 1845 3.4 Total 54672 100
All the analyses were performed in Mplus 7. Since the variables were continuous, ordinal and dichotomous (tab.5), the analyses were performed on covariance matrix using the high-recommended robust weighted least squares estimator (WLSMV) (Muthén 1984). WLSMV is a robust estimator that does not assume normal distribution of the data suited to analysing categorical and ordinal data (Asparouhov and Muthén 2007).
The Comparative fit index (CFI) and the Root mean square error of approximation (RMSEA) were used to evaluate the goodness of fit of the models (Bentler 1992; Steiger and Lind 1980). A reasonable fit is gained when the value of RMSEA is less than .06 (Browne and Cudeck 1993) and the value of CFI is > .90 (Bentler 1990). We also used the conventional chi-square test.
2Concerning the Legitimacy of Institutions dimension, the objective perspective has to be understood in a broad
sense because it refers to behaviours and experiences that as a whole could be considered proxies of an objective point of view, although they refer to subjective experiences.
3 The questionnaire is available at http://www.europeansocialsurvey.org
4 Additional information about the sampling, the questionnaire and the translation issues is available at
6. Exploratory structural equation modeling
The principal component analysis (PCA) does not allow taking into account the measurement error. It assumes that the measures are perfectly reliable. The indicators reflect not only the latent dimensions they are intended to represent but also random and systematic error (Bollen 1989). Errors are due to the difficulties in measuring accurately complex latent constructs, response biases (i.e. social desirability bias, acquiescence, etc.) and common method factors (e.g. same scaling techniques). Measurement errors compromise the validity of research findings.
Confirmatory factor analysis (CFA) shows several advantages over PCA. When there is a not negligible amount of measurement error and the researcher can hypothesise an underlying factor structure, then factor analysis is the proper method to analyse the data. Factor analysis produces latent constructs that are uncontaminated by measurement error (Dunteman 1989).
Asparouhov and Muthén (2009) developed a specific approach known as exploratory structural equation modeling (ESEM) that has many shared characteristics with CFA. These characteristics – such as tests of relationships between latent factors adjusted for measurement error, correlated uniquenesses, complex error structure, tests of measurement invariance across groups or occasions, extension of factor analysis to SEM – distinguish ESEM approach from conventional EFA making it more similar to CFA rather than to conventional EFA. Thus, ESEM represents an overarching integration of CFA/SEM and EFA (for a more detailed presentation of ESEM see Asparouhov and Muthén 2009; Marsh et al. 2009; Morin et al. 2013; Marsh et al. 2013; Marsh et al. 2014).
Before estimating a highly restrictive model like the CFA model, we have performed an exploratory factor analysis with geomin rotation strategy in Mplus (Asparouhov and Muthén 2009). Geomin rotation allows latent factors to be correlated resulting in a more realistic scenario rather than not-correlated constructs engendered by orthogonal rotation strategies (e.g. Varimax).
The exploratory analysis – with WLSMV estimator – shows the existence of seven latent factors consistent with the hypothesised seven constructs of social cohesion5. The model shows an acceptable
fit (RMSEA = .038, CFI = .932). For the record, the first factor extracted refers to interpersonal trust
(items A3-A5), the second factor is participation (B11-B17, D1R), the third factor is institutional trust
(B2-B8), the fourth is legitimacy of institutions (B22-B25 with low factor loading also for B2, B3, B4, B5, B6), the fifth is openness (B32-B34, B30R), the sixth is density of social relations (C2-C4), the seventh is
social support (D21, D29, D36). The factor correlations ranged from .528 between the first and the fourth factor and .088 for factor one with factor seven6.
In general, the exploratory factor analysis has several limitations. Factor loadings and estimated latent factor correlations vary with different rotation strategies (Browne 2001). Thus, it can be said that “in exploratory factor analysis, the model is arbitrary: all variables load on all factors (Hox and Bechger 1998, p.3). EFA helped us to evaluate if the hypothesised social cohesion structure with seven factors was roughly plausible. However, EFA is useful when we have no hypothesis about the number of latent factors and the relations between factors and indicators. Since we have a hypothesised model and the aim is to test if this theoretical model is tenable, the proper approach is the CFA.
5 Factor analysis requires the specification of the number of factors to be extracted. We have requested a solution
with 6, 7 and 8 factors. The six-factor solution does not show a good fit with CFI = .90, just barely on the cut-off point for an acceptable fit. The eight-factor solution just splits the institutional trust dimension up in two separated factors. In addition, the eigenvalue for the eighth factor extracted is equal to 1.030; basically, it accounts for as much variance as a single variable. The eigenvalues ranged from 8.116 to 1.030.
6 Usually, compared to CFA in EFA the factor correlations are deflated because all items load on all the factors
7. Confirmatory factor analysis and cross-validation
CFA is based on testing theories. Hypotheses involve the specification of which variables will be correlated (or not correlated) with which factor and the specification of correlations amongst factors. In addition to indeterminacy and limitations of EFA, the CFA is also preferable to EFA on the basis of its parsimony. In order to make the social cohesion model more parsimonious while trying to avoid redundancy, we fulfilled a selection of 24 indicators from the available set of indicators (tab.7). In order to test the hypothesised social cohesion model, we followed a cross-validation strategy. Indeed, with multiple specifications of the model, there is the solid risk that the specified model and the following modifications may be driven exclusively by characteristics of the sample on which we tested the model (MacCallum et al. 1992). One strategy to addressing problems connected with multiple model specifications is the cross-validation analysis where a model is tested on a second independent sample (or more independent samples) drawn from the same population. In our case, we have split the total sample up in two independent randomly selected samples. First, we tested the hypothesised social cohesion model on Sample A then the validity of the model is tested again on an independent sample – Sample B.
The CFA social cohesion model on Sample A (n = 27103) is as follows: seven continuous latent factors corresponding to the seven constitutive dimensions of social cohesion measured by 24 dependent variables. The model shows an acceptable fit (χ2 = 8714.68, d.f. 231) with RMSEA = .037 and CFI = .927.
The highly significant χ2 is an expected result taking into account the huge sample size (n = 27103).
Several researchers (MacCallum et al. 1996; Hox and Bechger 1998; Joreskog and Sorbom 1993) remarked that the chi-square value is strongly affected by sample size. With large samples (more than 1000 units), the chi-square is almost certainly significant rejecting models that actually fit the data7.
All the factor loadings are significant (p < .001) ranging from – in the standardised solution – .781 to .693 for Interpersonal trust, .643 to 476 for the Density of social relations dimension, .577 to .555 for the construct Social support, .904 to 521 for Participation, .853 to .777 for Openness, .875 to 814 for the latent factor Institutional trust and from .818 to .598 for Legitimacy of Institutions (tab.7).
Tab.7 – Unstandardised and standardised Parameter Estimates for CFA model on Sample
Items Unstandardised Standardised Interpersonal trust
A3 1.000 (---) .781 (0.004) A4 0.887 (0.010) .738 (0.004) A5 0.847 (0.011) .693 (0.005) Density of social relations
C2 1.000 (---) .476 (0.008) C3 1.187 (0.031) .643 (0.009) C4 0.677 (0.017) .528 (0.008) Social support
D21 1.000 (---) .575 (0.008) D29 1.097 (0.027) .555 (0.007) D36 0.776 (0.018) .563 (0.007) Participation
D1_R 1.000 (---) .656 (0.009) B12 0.795 (0.029) .521 (0.017) B13 1.379 (0.029) .904 (0.010) B15 0.906 (0.023) .594 (0.011) Openness
B32 1.000 (---) .777 (0.005) B33 1.086 (0.014) .819 (0.005) B34 1.037 (0.013) .853 (0.005) Institutional trust
B2 1.000 (---) .875 (0.003) B3 0.983 (0.010) .814 (0.004)
7 Alternative fit indices have been developed to deal with the problems of χ2 with large samples. The RMSEA
B5 0.893 (0.008) .854 (0.003) B6 0.860 (0.008) .830 (0.003) Legitimacy of institutions
B22 1.000 (---) .758 (0.004) B23 1.075 (0.012) .818 (0.004) B24 0.742 (0.011) .598 (0.005) B25 0.877 (0.013) .645 (0.005) Note: the first indicator of each factor is constrained to 1 to set the measurement scale of the latent factor. In parenthesis the standard errors.
Although the model shows an acceptable fit, a review of the modification indices (MI) suggested that three substantively reasonable parameters could improve the fit of the model. The parameters refers to the residual covariances related to the observed variables B24 and B25, D29 and D36, C2 and C4. One by one, each covariance was added to the model. To test if the additional parameters lead to a statistically significant difference from the model without covariances, we performed a chi-square difference test. The test is highly significant (ΔWLSMV χ2
[3] = 2696.59) suggesting that the three
covariances improved significantly the fit of the model and ignoring these parameters could lead to a misspecification of the model. The model with covariances fits the data well (χ2 = 5232.27, d.f. 228,
RMSEA = .028 and CFI = .957) and it represents the baseline model; that is, the model on which we will perform the cross-validation analysis. There are several methods by which a researcher can test the similarity of the factor structure across samples (Cudeck and Browne 1983; Browne and Cudeck 1989; Whittaker and Stapleton 2006). We employed an invariance-testing strategy to test the similarity of the factor structure across Sample A and Sample B.
Tab.8 – Unstandardised and standardised Parameter Estimates for Configural Model
Sample A Sample B
Item Unstandardised Standardised Unstandardised Standardised Interpersonal trust
A3 1.000 (---) .781 (0.004) 1.000 (---) .763 (0.004) A4 0.887 (0.010) .737 (0.004) 0.924 (0.011) .748 (0.004) A5 0.849 (0.011) .694 (0.005) 0.891 (0.011) .708 (0.004) Density of social relations
C2 1.000 (---) .408 (0.009) 1.000 (---) .421 (0.009) C3 1.351 (0.040) .627 (0.009) 1.281 (0.036) .611 (0.008) C4 0.699 (0.019) .467 (0.009) 0.708 (0.019) .482 (0.008) Social support
D21 1.000 (---) .561 (0.008) 1.000 (---) .560 (0.008) D29 0.878 (0.025) .434 (0.008) 0.856 (0.024) .420 (0.008) D36 0.619 (0.017) .439 (0.008) 0.641 (0.017) .453 (0.008) Participation
D1 1.000 (---) .655 (0.009) 1.000 (---) .658 (0.009) B12 0.794 (0.029) .521 (0.017) 0.770 (0.036) .539 (0.017) B13 1.379 (0.029) .904 (0.010) 1.323 (0.047) .914 (0.010) B15 0.908 (0.023) .595 (0.011) 0.847 (0.034) .589 (0.011) Openness
B32 1.000 (---) .777 (0.005) 1.000 (---) .775 (0.005) B33 1.086 (0.014) .819 (0.005) 1.078 (0.014) .814 (0.005) B34 1.036 (0.013) .852 (0.005) 1.047 (0.013) .854 (0.005) Institutional trust
B2 1.000 (---) .876 (0.003) 1.000 (---) .868 (0.003) B3 0.982 (0.010) .813 (0.004) 0.988 (0.010) .812 (0.004) B5 0.893 (0.008) .855 (0.003) 0.901 (0.008) .856 (0.003) B6 0.860 (0.008) .830 (0.003) 0.862 (0.008) .828 (0.003) Legitimacy of institutions
As first step, we tested a multiple-group structural equation model. More precisely, we specified a model – named configural model – where all the parameters in Sample A and Sample B were freely estimated simultaneously. The configural model shows a good fit: χ2 = 10505.90, d.f. 472, RMSEA =
.028 and CFI = .957. The model for Sample A fits slightly better (χ2 = 5001.76) than the model for Sample
B (χ2 = 5504.14). The factor loadings are all highly significant (p < 0.001) (tab.8).
The important point is to what extent the goodness-of-fit indices of the configural model are different from those of the baseline model. Comparing the fit indices, they remain unchanged (tab.9). Having established that the combined model for Sample A and Sample B shows a good fit, we carried on the cross-validation analysis testing the actual equivalence of the social cohesion model across the two samples.
Tab.9 – Goodness-of-fit statistics
Baseline model Configural model
Model with equality constraints
Third-order CFA model
Third-order configural model
Third-order model with equality constraints
RMSEA .028 .028 .015 .040 .039 .022
CFI .957 .957 .986 .913 .913 .969
In order to test the equivalence, we specified a model with factor loadings, intercepts, residual covariances (measurement part), factor variances and covariances (structural part) constrained to be equal across the two samples.
The resulting model – model with equality constraints – reveals a good fit to the data: χ2 = 3859.35, d.f.
530, RMSEA = .015 and CFI = .986. Since the RMSEA and the CFI suggest a good fit and their values do not degrade compared to those of the configural model with freely estimated parameters (tab.9), we can state that factor loadings, intercepts, residual covariances, factor variances and covariances are operating equivalently across the two samples. This conclusion is also corroborated by a chi-square difference test, which is not significant (ΔWLSMV χ2
[58] = 60.797, p = 0.375). We can conclude that the
social cohesion model (and its parameters) is the same in the two samples showing a strong measurement and structural invariance (Meredith 1993). Therefore, the hypothesised seven constructs social cohesion model is tenable since the analysis has shown its validity.
8. Higher-order factor analysis
Social cohesion is a multidimensional complex construct not directly observable. According to our theoretical framework, the seven constituent sub-dimensions of social cohesion should be part of three different spheres (micro, meso and macro). In addition, it is conceivable that social cohesion could represent a still more general factor responsible for the correlations amongst the three macro spheres. Therefore, social cohesion is hypothesised as a higher-order factor.
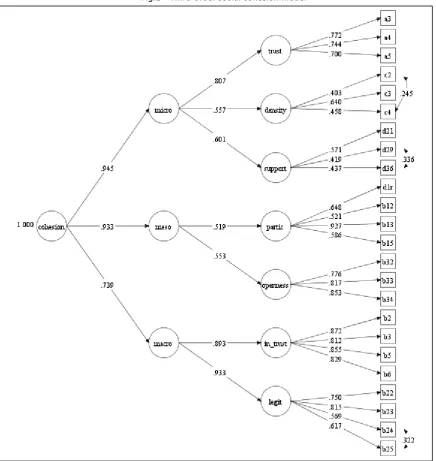
To test the hypothesis, we specified a third-order CFA model. The model is as follows: seven first-order factors measured by 24 indicators, three second-order factors accounting for the correlations of the first-order factors and one third-order factor responsible for the correlations of the second-order factors (fig.18). The model was initially tested on the total sample (n = 54762). The model shows an
acceptable fit: χ2 = 20838.94, d.f. 239, RMSEA = .040 and CFI = .913. All the first, second and third-order
factor loadings are highly significant (p < 0.001). In tab.10, we report the standardised factor loadings for the second and third-order latent factors. Regarding the first order factor loadings, the differences compared with previous models are negligible (fig.1).
8 Since also higher-order factors must have a metric, instead of fixing to 1 the first factor loadings of the
Fig.1 – Third-order social cohesion model
The CFI value is just above the cut-off point for an acceptable fit. However, we have to take into account that the model is extremely complex. In complex models, CFI tends to decrease even if the model is properly specified (Kenny and McCoach 2003). Kenny and McCoach (2003) suggested inspecting simultaneously RMSEA and CFI and accepting the model if the CFI is slightly lower than the cut-off point and the RMSEA is acceptable. In addition, higher-order CFA models cannot improve the fit of the first-order solution. Indeed, higher-order CFA models attempt to reproduce the correlations of the first-order factors (that are freely estimated in the first-order model) with a smaller number of parameters. Thus, the advantage is the parsimony of the model and the benefits that higher-order models provide to the theoretical reasoning. Following the multiple group SEM strategy previously shown, we cross-validated the third-order CFA model of social cohesion.
Starting from configural model, where all the parameters were freely estimated across samples, we progressively imposed constraints to the model (Chen et al. 2005; Widaman and Reise 1997). Precisely, the equality constraints refer to:
first-order factor loadings;
third-order factor loadings;
three covariances previously specified;
intercepts of the indicators;
residual variances of the first-order factor loadings;
residual variances of the second-order factor loadings;
variance of the third-order factor.
The goodness-of-fit indices for the third-order configural model are acceptable: RMSEA = .039, CFI .913 (χ2 = 21024.34, d.f. 485). Instead, the model with the constrained parameters shows a good fit with
RMSEA = .022, CFI .969 and χ2 = 7909.10 (d.f. 541).
The chi-square difference test is highly not significant: ΔWLSMV χ2
[56] = 55.035, p = 0.511. The fit indices
and the chi-square test show that the parameters of the Third-order Social Cohesion model are operating equivalently across samples.
Tab.10 – Standardised Parameter Estimates for third-order CFA Social Cohesion model
Standardised factor loadings MICRO
Interpersonal trust .807 (0.005) Density of social relations .557 (0.006) Social support .601 (0.006) MESO
Participation .519 (0.008) Openness .553 (0.007) MACRO
Institutional trust .893 (0.003) Legitimacy of institutions .933 (0.003) SOCIAL COHESION
MICRO .945 (0.006)
MESO .933 (0.010)
MACRO .739 (0.005)
The third-order model corroborate the validity of the theoretical social cohesion scheme proposed showing that cohesion is composed of three different sub-levels – micro, meso, macro (Chan.et al. 2006; Dickes et al. 2010). Therefore, social cohesion represents a general factor not directly observable that accounts for primary dimensions (trust, legitimacy, participation, social relationships, etc.) essential for a well-functioning Country. We showed that social cohesion is a multidimensional construct of higher order. Therefore, social cohesion does not exert a direct effect on individuals’ attitudes and behaviour. Instead, social cohesion is a general concept that affects its multiple sub-dimensions, which in turn affects individuals’ attitudes and behaviours.
9. Discussion
After reviewing the main contributions, we defined the levels at which a researcher can analyse social cohesion. There are six conceptual levels of social cohesion (tab.2). We focused only on the levels comprising individuals. Even though social cohesion is considered a societal attribute, it is ascribed to individual attitudes and behaviours toward several social spheres.
On this conceptual ground, we provided a social cohesion framework that aims to help researchers to measure social cohesion identifying indicators for all levels and perspectives (subjective and objective). Afterward, we provided an operationalization of social cohesion identifying seven constituent dimensions.
a good fit suggesting a strong measurement and structural invariance across samples. From a substantive point of view, the invariance indicates that the social cohesion model parameters are not dependent from the specific characteristics of the selected sample. Thus, the model can be generalised to an independent sample.
According to our social cohesion scheme, the seven dimensions should be clustered in three higher-order dimensions – micro, meso, macro – which in turn should be part of a more general construct named social cohesion. Therefore, social cohesion is understood as a general property that produces its effects within a society shaping components like interpersonal and institutional trust, social and political participation, density of social and interpersonal relationships and openness toward diversity. In order to test the hypothesis that social cohesion is a general construct underlying the seven dimensions identified as constituents, we specified a third-order factor model. The advantages correlated to higher-order models are several (Chen et al. 2005; Marsh and Hocevar 1985; Rindskopf and Rose 1988). Higher-order models can help a researcher to test complex theories and if hypothesised higher-order constructs explain the structure of correlations between lower-order factors. Imposing a structure on the first-order factor covariances, higher-order factor models are more parsimonious. This issue has positive consequences on theoretical reasoning permitting to develop simpler but with greater explanatory power theories.
Since the fit of the third-order social cohesion model does not decrease compared to the model with the seven latent factors, we can affirm that the model with social cohesion as a third-order general factor provides a good explanation of the correlations between the first-order factors. Moreover, this represents good evidence of the existence of a general non-observed property (social cohesion) that accounts for observed surface phenomena, attitudes and behaviours like trust, participation, interpersonal relationships and perception of the legitimacy of institutions.
The seven sub-dimensions (interpersonal trust, density of social relationships, social support, participation, openness, institutional trust and legitimacy of institutions) are the key factors that contribute to uphold social cohesion between individuals in a society.
The measurement invariance of the social cohesion model across samples provides evidence that the seven first-order constructs, the three second-order constructs and the third-order social cohesion construct have been measured in the same way across independent samples. This represents additional evidence of the validity of the social cohesion model.
In addition to substantive findings, we have presented an approach that can help a researcher to test the cross-validity of a model. The approach is based on a multi-group SEM strategy. A researcher can test the cross-validity of its model testing simultaneously the invariance of the model across independent samples. The strategy involves the specification of a multiple group SEM model with independent samples considered as groups and then simultaneously testing for measurement invariance progressively imposing constraints to the multiple group model. As far as we know, there are no studies that show how to test the invariance of parameters of a third-order model. In addition, we have briefly introduced a new available approach implemented in Mplus named exploratory structural equation modeling (ESEM) that shows several useful characteristics. ESEM combines confirmatory factor analysis and exploratory factor analysis, allowing us to specify less restrictive models than CFA models.
To sum up, we provided an operational definition of social cohesion trying to avoid the highlighted issues related to the different approaches to social cohesion. Differently from institutional approach, we tried to provide a solid theoretical background to our conceptual definition of social cohesion avoiding shrinking the concept to a never-ending list of indicators.
In addition, we avoided mixing up constituents and conditions of social cohesion and operationalizing social cohesion in terms of policy goals that should be achieved.
represents a sound basis on which researchers can develop further the theoretical reasoning on social cohesion.
Further lines of research could include studies that investigate social cohesion at the remaining levels that we have identified but not considered. Indeed, in tab.2 we have stated that there are at least six levels of social cohesion. Following a methodological individualism approach, we have taken into account only the levels comprising individuals (levels 1, 2 and 3). Therefore, it would be of primary interest to investigate cohesion in a country analysing the relationships among different social groups and to what extent each institution is connected to the other institutions and evaluating the vertical or the horizontal nature of those relationships (Chan et al. 2006).
References
Asparouhov, T., Muthen, B.: Computationally efficient estimation of multilevel high-dimensional latent variable models. In proceedings of the 2007 JSM meeting in Salt Lake City, Utah, Section on Statistics in Epidemiology, pp. 2531-2535, (2007).
Asparouhov, T., Muthén, B.: Exploratory structural equation modeling. Struct. Equ. Modeling, 16(3), 397-438. (2009).
Bentler, P. M.: Comparative fit indexes in structural models. Psychol. Bull., 107(2), 238-246 (1990). Bentler, P. M.: On the fit of models to covariances and methodology to the Bulletin. Psychol. Bull., 112
(3), 400 (1992).
Berger-Schmitt, R.: Social cohesion as an aspect of the quality of societies: concept and measurement. Eureporting Working Paper n°14 (Centre for Survey Research and Methodology, Mannheim) (2000). Berger-Schmitt, R.: Considering social cohesion in quality of life assessments: Concept and
measurement. Soc. Indic. Res. 58, 403–428 (2002).
Bernard, P.: Social cohesion: A dialectical critique of a quasi-concept. Paper SRA-491, Ottawa: Strategic Research and Analysis Directorate. Department of Canadian Heritage (1999).
Bollen, K. A.: Structural equations with latent variables. John Wiley & Sons (1989).
Bollen, K. A., Hoyle, R. H.: Perceived cohesion: A conceptual and empirical examination. Soc. Forces, 479-504 (1990).
Browne, M. W.: An overview of analytic rotation in exploratory factor analysis. Multivariate Behav. Res., 36(1), 111-150 (2001).
Browne, M. W., Cudeck, R.: Single sample cross-validation indices for covariance structures. Multivariate Behav. Res., 24(4), 445-455 (1989).
Browne, M.W., Cudeck, R.: Alternative ways of assessing model fit. In: K.A. Bollen, J. S. Long (Eds.), Testing structural equation models, pp. 136–162. Newbury Park, CA: Sage. (1993).
Chan, J., To, H. P., Chan, E.: Reconsidering social cohesion: Developing a definition and analytical framework for empirical research. Soc. Indic. Res., 75(2), 273-302 (2006).
Chen, F. F., Sousa, K. H., West, S. G.: Testing measurement invariance of second-order factor models. Struct. Equ. Modeling, 12(3), 471-492 (2005).
Cudeck, R., Browne, M. W.: Cross-validation of covariance structures. Multivariate Behav. Res. 18(2), 147-167 (1983).
Dickes, P., Valentova, M.: Construction, validation and application of the measurement of social cohesion in 47 European countries and regions. Soc. Indic. Res., 113(3), 827-846 (2013).
Duhaime, G., Searles, E., Usher, P. J., Myers, H. Frechette, P.: Social cohesion and living conditions in the Canadian Arctic: From theory to measurement. Soc. Indic. Res., 66(3), 295-318 (2004).
Dunteman, G. H.: Principal components analysis. Sage. (1989).
Durkheim, E.: De la division du travail social: étude sur l'organisation des sociétés supérieures. Presses Universitaires de France (1893).
European Commission: Sixth Report on economic, social and territorial cohesion, Bruxelles (2014). European Union: First Report on Economic and Social Cohesion 1996. Luxembourg: Office for Official
Publications of the European Communities (1996).
Friedkin, N. E.: Social cohesion. Annu. Rev. Sociol., 30: 409-425 (2004).
Granovetter, M. S.: The strength of weak ties. Am. J. Sociol., 1360-1380 (1973).
Hox, J. J., Bechger, T. M.: An introduction to structural equation modeling. Family Science Rewiew, 11, 354-373 (1998).
Jeannotte, M. S.: Social cohesion around the world: An international comparison of definitions and issues, Strategic Research and Analysis, Ottawa: Canadian Heritage (2000).
Jenson, J.: Mapping social cohesion: The state of Canadian research. Paper SRA-321, Family Network, Canadian Policy Research Networks Inc. (1998).
Jöreskog, K. G., Sörbom, D.: LISREL 8: Structural equation modeling with the SIMPLIS command language. Scientific Software International (1993).
Kenny, D. A., McCoach, D. B.: Effect of the number of variables on measures of fit in structural equation modeling. Struct. Equ. Modeling, 10(3), 333-351 (2003).
Le Bon, G.: Psychologie des foules, Alcan (1895).
Lockwood, D.: Civic integration and social cohesion. In Gough, I. (Ed.) Capitalism and Social Cohesion (pp. 63-84). Palgrave Macmillan UK (1999).
MacCallum, R. C., Roznowski, M., Necowitz, L. B.: Model modifications in covariance structure analysis: the problem of capitalization on chance. Psychol. Bull.. 111 (3), 490 (1992).
MacCallum, R. C., Browne, M. W., Sugawara, H. M.: Power analysis and determination of sample size for covariance structure modeling. Psychol. Methods, 1(2), 130 (1996).
Marsh, H. W., Hocevar, D.: Application of confirmatory factor analysis to the study of self-concept: First-and higher order factor models and their invariance across groups. Psychol. Bull., 97(3), 562 (1985).
Marsh, H. W., Muthén, B., Asparouhov, T., Lüdtke, O., Robitzsch, A., Morin, A. J., Trautwein, U.: Exploratory structural equation modeling, integrating CFA and EFA: Application to students' evaluations of university teaching. Struct. Equ. Modeling, 16(3), 439-476 (2009).
Marsh, H. W., Lüdtke, O., Nagengast, B., Morin, A. J., Von Davier, M.: Why item parcels are (almost) never appropriate: Two wrongs do not make a right—Camouflaging misspecification with item parcels in CFA models. Psychol. Methods, 18(3), 257 (2013).
Marsh, H. W., Morin, A. J., Parker, P. D., Kaur, G.: Exploratory structural equation modeling: An integration of the best features of exploratory and confirmatory factor analysis. Annu. Rev. Clin. Psychol., 10, 85-110 (2014).
Meredith, W.: Measurement invariance, factor analysis and factorial invariance. Psychometrika, 58(4), 525-543 (1993).
Morin A.J., Marsh H.W., Nagengast B.: Exploratory structural equation modeling: an introduction. In: G.R. Hancock, R.O. Mueller (eds.), Structural Equation Modeling: A Second Course, pp. 395– 436. Greenwich, CT: IAP. 2nd ed. (2013).
Muthén, B.: A general structural equation model with dichotomous, ordered, categorical and continuous latent variable indicators. Psychometrika. 49(1), 115-132 (1984).
Muthén, B. O. and Muthén, L. K.: Mplus User’s guide. Los Angeles, CA: Muthén & Muthén, (1998-2012). Noll, H. H: Towards a European system of social indicators: Theoretical framework and system
architecture. Soc. Indic. Res., 58(1-3), 47-87 (2002). Parsons, T.: The social system Chicago, Free Press (1951).
Putnam, R. D.: Bowling alone: The collapse and revival of American community. Simon and Schuster (2001).
Social, Health and Family Affairs Committee: Fighting social exclusion and strengthening social cohesion in Europe. Strasbourg: Parliamentary Assembly of the Council of Europe (1998).
Steiger, J. H., Lind, J. C.: Statistically based tests for the number of common factors. In annual meeting of the Psychometric Society, Iowa City, IA (Vol. 758) (1980).
Parsons, T.: The Social System. Glencoe, Free Press (1951).
Rindskopf, D., Rose, T.: Some theory and applications of confirmatory second-order factor analysis. Multivariate Behav. Res., 23(1), 51-67 (1988).
Whittaker, T. A., Stapleton, L. M.: The performance of cross-validation indices used to select among competing covariance structure models under multivariate nonnormality conditions. Multivariate Behav. Res., 41(3), 295-335 (2006).
Widaman, K. F., Reise, S. P.: Exploring the measurement invariance of psychological instruments: Applications in the substance use domain. In: K. J. Bryant, M. Windle, S. G. West (Eds.), The science of prevention: Methodological advances from alcohol and substance abuse research (pp. 281–324). Washington, DC: American Psychological Association (1997).